Published by Jonny CARLSSON – Unipower AB, David HOLMBERG – AB Vattenfall, Jan ÖSTLUND – ABB AB
Abstract A method of real-time calibrating the voltage signal from the Capacitive Tap on an ABB Current Transformer using Unipowers ‘UP-2210R/ABB Capacitive tap Module’ has produced accurate results of unbalance, harmonics and transients with no limitation in bandwidth. The method is to be preferred prior to measurements directly on the inductive VT since the capacitive tap eliminates the problem of limited frequency response on inductive VTs.
Another advantage of the method is that installation can be done without interrupting the power distribution.
Purpose
The purpose of this project is to evaluate a new technology for measurements on the capacitive tap where harmonics, relative and absolute, unbalance and transients can be measured correctly.
Background
Inductive and Capacitor Voltage Transformers do not reproduce harmonics in an accurate manner. Limited bandwidth changes the waveform at the transformer output causing harmonics to be amplified or attenuated.
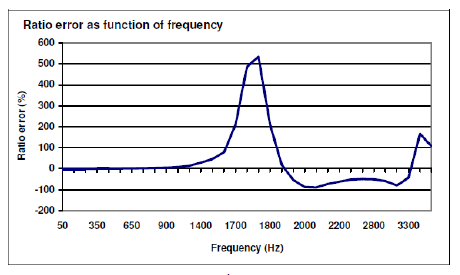
The charts below show an approximate overview of the bandwidth for inductive VTs and CVTs. In many substations there are capacitor tap outputs that can be used for high bandwidth measurements. A good example is the capacitive tap available on ABB current transformers. The bandwidth is similar to the C divider.
In the paper ‘Problems of Voltage Transducer in Harmonic Measurement’ Xiao, Hu and Deng describe the method of using the capacitive taps in Current Transformer bushings for relative harmonic measurements. The drawback of the recommended method is though that this voltage signal has no absolute reference and is floating/fluctuating over time and can therefore not be used for anything else than relative harmonics.
Project Background
At the interconnection points between Vattenfall, the largest sub-transmission and distribution company in Sweden and Banverket, Swedish railway operator, static converters are used for producing 16 2/3 Hz. Both Banverket and Vattenfall are interested in measuring power quality accurately in these points.
A joint project between Vattenfall, ABB and Unipower was therefore formed with the purpose of evaluating a new technique for PQ measurements conducted on an ABB current transformer ASEA IMBD145 in Gothenburg. The bandwidth of capacitive tap on this transformer is approx 1 MHz with a tangent delta of 0.025%-0.030% at 50 Hz.
Technical setup
Measurement techniques using the capacitive tap on the Current Transformer exist already today. The advantage is a very high frequency bandwidth. The drawback is that the signal is fluctuating quite a lot over time so measurement can only be relative, not absolute. Unbalance is a parameter impossible to measure on a floating signal and also the exact magnitude of transients registered will not be known. These parameters are usually of highest concern.
Thanks to modern signal-processing technique there is a new possibility available. Unipower AB producing PQ meters has specifically designed and equipped one of their high-end PQ meters with a set of extra voltage inputs (reference) with the purpose of real-time calibrating the high band-width voltage signal from the capacitive tap. The capacitive tap signal is calibrated continuously using a high accuracy, low band-width signal from either an inductive VT or CVT.
The result is a high band-width signal with absolute reference producing correct absolute harmonics, voltage, unbalance and transient recordings where measurements earlier were not possible. In addition the technique is cost effective since it is using the existing capacitive taps on the transformers already installed.
The Voltage transformer ASEA EMFC 145 has got an expected frequency response that is same as ABB EMF 145, see below picture:
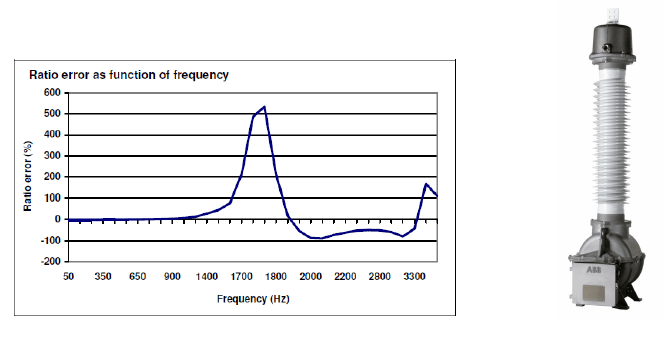
This means that the result from the capacitive tap and from the Reference meter (Inductive VT) is expected to be the same up to approx 25th harmonic. Around 35th-40th harmonic the signal from the Inductive VT is expected to be amplified approx five times due to resonance.
Test results – Voltage measurements
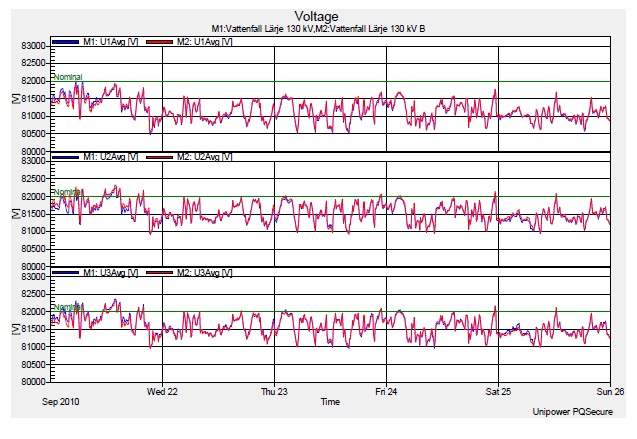
To verify that the measurements on the Capacitive tap is calibrated correctly the two meters are plotted in the same diagram. Picture below shows that Capacitive Tap (blue) vs. Inductive VT (red) are correlating. This confirms that the on-line calibration of the signal from the capacitive tap is working accurately.
Test results – Unbalance
For Unbalance the measurement result between the two meters are about the same. There is a small difference, about 0.05% that is within the accuracy requirements of IEC 61000-4-30 Class A. See picture below.

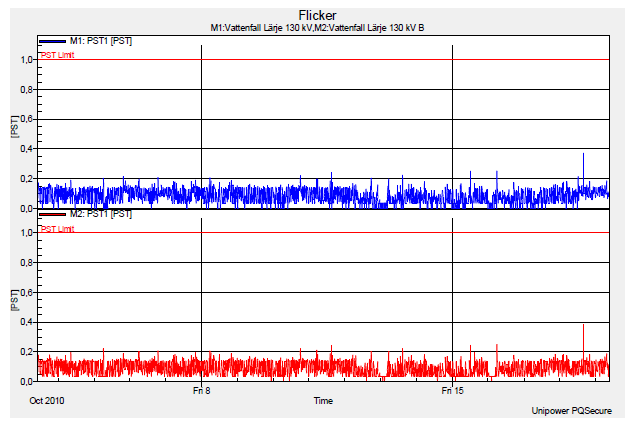
Test results – Flicker
For Flicker the measurement result between the two meters are the same.
Test results – Transients
During the test period there were few transients. The expected result was however confirmed. The Inductive VT was supposed to attenuate high bandwidth signals. Picture below show a transient captured at the capacitive tap. Since the amplitude was rather low the signal on the Inductive VT was attenuated and below the transient threshold level set at 30% deviation. The transient measured below correlate to a capacitor switching in the station. The time of the switching is 2010-10-15 6:15:26 according to Vattenfalls log (daylight saving) and the registered transient is at 2010-10-15 05:15:24,50 (standard time).
Next picture shows the same transient, but with fundamental subtracted:
Test results – Harmonics
The low order harmonics are as expected to be similar between the capacitive tap and inductive VT, see below:
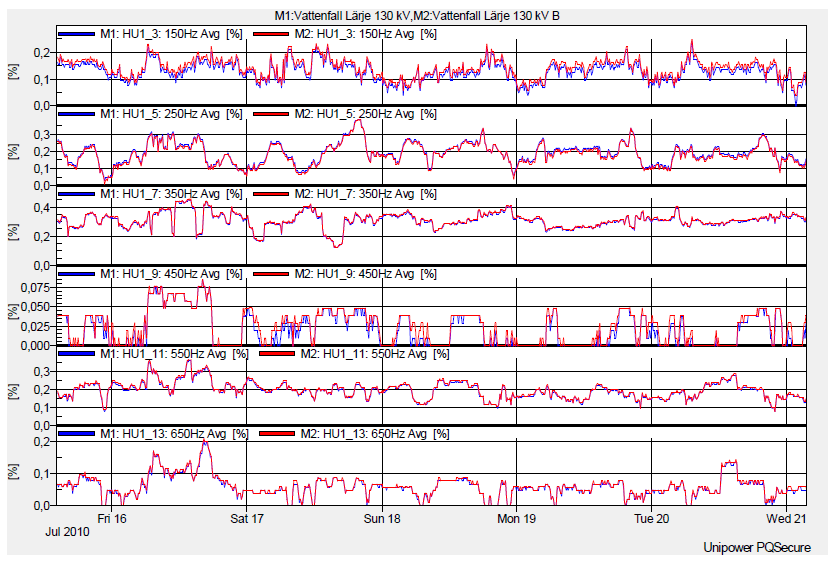
Difference on 3rd harmonic is 0.02%. Signal from capacitive tap is slightly lower.
Difference on 5th harmonic is 0.01%. Signal from capacitive tap is slightly higher.
H7, no significant difference.
H9, no significant difference.
H11, no significant difference.
H13, no significant difference.
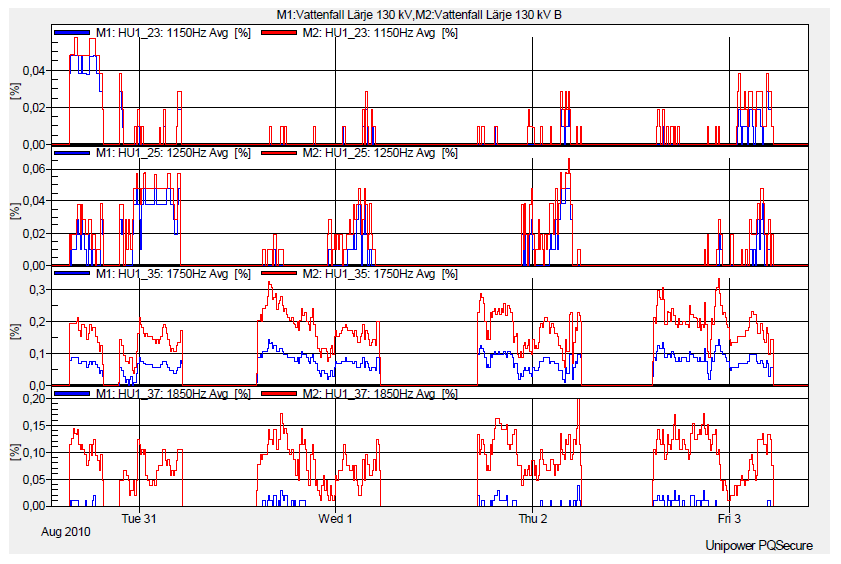
Up to the 25th harmonic there is no significant difference between the capacitive tap and the inductive VT. However on the 35th harmonic the signal from the inductive VT is approx +150% to 200%, and on 37th harmonic the difference is at its maximum and the signal from the inductive VT is approx +500% as compared with the signal from capacitive tap, see picture below. This is the expected behavior caused by resonance in the VT. The resonance points of the inductive VT can vary between different transformers but a typical frequency response can be seen below.
Conclusion
The method of real-time calibrating the voltage signal from the Capacitive Tap using Unipowers ‘UP- 2210R/ABB Capacitive tap Module’ instrument has produced accurate results of absolute voltage, voltage unbalance, harmonics and transients with no limitation in bandwidth. The method is to be preferred prior to measurements directly on the inductive VT since the capacitive tap eliminates the problem of frequency response on inductive VTs.
Another advantage of the method is that installation can be done without interrupting the power distribution.
Source URL: https://www.unipower.se/wp-content/uploads/2022/10/Unipower_cap_measurements_rev6.pdf
