Published by Ameur Fethi AIMER1, Ahmed Hamida BOUDINAR2, Mohamed Amine KHODJA2, Azeddine BENDIABDELLAH2, University of Saida. Algeria (1), University of Sciences and Technology of Oran. Algeria (2) ORCID: 1. 0000-0003-4933-109X
Abstract. Induction machines are enjoying growing interest mainly due to their robustness, their weight to power ratio and their manufacturing cost. However, several faults affect the reliability of these machines. In order to identify these defects, the power spectral density, based on the Periodogram technique is used for its simplicity and its short computing time. However, it is limited in frequency resolution in cases of low motor slip (harmonic close to the fundamental), in the case of very noisy signals (false alarms) and in the detection of incipient faults (low amplitude harmonics) which makes the diagnosis inefficient. To improve the frequency resolution of the spectral analysis, we highlight in this paper the impact of the choice of the weighting windows in order to have a reliable diagnosis of induction motor’s rotor faults. The experimental results will then show the properties of each window to improve the frequency resolution and thus correct the Periodogram’s limits.
Streszczenie. Maszyny indukcyjne cieszą się coraz większym zainteresowaniem głównie ze względu na ich solidność, stosunek masy do mocy oraz koszt wykonania. Jednak kilka usterek wpływa na niezawodność tych maszyn. W celu identyfikacji tych defektów wykorzystuje się gęstość widmową mocy, opartą na technice Periodogram, ze względu na jej prostotę i krótki czas obliczeń. Jest jednak ograniczona w rozdzielczości częstotliwości w przypadkach niskiego poślizgu silnika (harmoniczna zbliżona do podstawowej), w przypadku bardzo zaszumionych sygnałów (fałszywe alarmy) oraz w wykrywaniu początkowych usterek (harmoniczne o niskiej amplitudzie), co sprawia, że diagnoza jest nieskuteczna . Aby poprawić rozdzielczość częstotliwościową analizy spektralnej, w niniejszym artykule zwracamy uwagę na wpływ doboru okien ważenia na wiarygodną diagnozę uszkodzeń wirnika silnika indukcyjnego. Wyniki eksperymentalne pokażą następnie właściwości każdego okna, aby poprawić rozdzielczość częstotliwości, a tym samym skorygować granice Periodogramu. (Poprawa rozdzielczości częstotliwości w diagnostyce usterek silnika indukcyjnego: walidacja eksperymentalna)
Keywords: Induction motor; Fault diagnosis; Broken rotor bars; Frequency resolution.
Słowa kluczowe: silnik indukcyjny, diagnostyka, uszkodzenie prętów
Introduction
Nowadays, induction motor is widely used in most electric drives applications, especially at constant speed. Advances in power electronics associated with modern control techniques have led to the consideration of variable speed applications, which were previously limited exclusively to DC motors and synchronous motors. Thus, faced with this growing interest, a general reflection is naturally directed towards the detection of faults and the monitoring of induction machines state. There are several techniques in fault diagnosis; vibration analysis being the most widely used method [1], [2], [3]. This method is mainly used for the detection of mechanical faults.
Motor current signature analysis or MCSA has been used more and more in recent years. Its peculiarity is that the stator current spectrum carries information on almost all of the electrical and mechanical faults that can affect the induction motor [4], [5], [6]. Spectral analysis based on signal processing has been used in recent years in the diagnosis and monitoring of induction machines faults [7]. This technique is well suited to the fault diagnosis insofar as many phenomena result in the appearance of sideband frequencies directly related to the speed of rotation of the motor.
Based on the calculation of the Fourier transform (FT), the power spectral density (PSD) is a widely used tool in research and industry associated with the analysis of stator current [8]. This is justified by the simplicity and the low cost of the current sensors and the harmonic content of the stator current. However, this technique has several drawbacks linked to the problem of frequency resolution. Indeed, the calculation of FT introduces a smoothing effect as well as a negative effect. These effects result in the appearance of sideband lobes in the stator current spectrum [9] and therefore reduce the clarity of the analysis.
When analyzing a signal, it is interested to have a main lobe as narrow as possible and side lobe amplitudes as low as possible, both advantages are impossible to achieve simultaneously. Because of this resolution problem, the PSD find difficulties in detecting faults when harmonic are near to the fundamental (in the case of a low motor slip), of false alarms (in the case of highly noisy signals) and for harmonics of low amplitude (case of incipient faults detection ).
Within this objective, this paper focuses on the choice criteria through experimental tests of the window weights and the impacts of this choice on the detection and localization of induction motor’s rotor faults.
Stator current analysis
The spectral analysis of the stator current knows a growing interest these last years, because of the quantity of information contained in its spectrum on most of the faults which can appear on an induction machine. It is interesting to note that, as in the case of the vibratory analysis, the spectral components of the fault continue to increase with time by the increase of the fault severity [6]. The broken rotor bars faults of the induction motor are considered among the most commonly studied faults because of their simplicity of implementation. This fault induces changes in the spectral components of the stator current and thus generates the appearance of new sideband frequencies in the current spectrum relating to the broken rotor bars fault [7].
Indeed, broken rotor bars give rise to a sequence of sidebands frequencies given by:

where: fs is the supply frequency and fc the sideband frequencies associated with the broken rotor bars fault, s is the motor slip and k = 1, 2, 3…
When analyzing the stator current, it is just possible to evaluate the general condition of the rotor. If there are broken rotor bars in various parts of the rotor, the current analysis is not able to provide information on the configuration of non-contiguous broken bars. For example, the frequency component does not exist if broken bars are electrically π/2 radians away from each other.
It should be noted that some experimental studies have demonstrated that both the skewing and non-insulation of rotor bars lead to a reduction of broken rotor bars harmonic components.
Power Spectral Density Calculation
Fourier Transform
The Fourier transform (FT) is a powerful mathematical tool used to extract useful information from a signal in the frequency domain. It is a nonparametric method, which lends itself well to the analysis of stationary phenomena. The FT is given by the following relation [9-10]:
where FTx(f) is called the Fourier Transform of the signal x(t), represented in our case by the stator current signal of the induction motor. Of course, it is impossible to analyze the signal over an infinite period. It is therefore necessary to truncate the signal prior to digital processing.
Truncation operation
The signal to be processed must be limited in time, this is said to be truncated. Mathematically, this amounts to do the following operation:

where: x(t): is the measured signal; xT(t): is the signal to be processed; ΠT: is the rectangular window; T: is the time length of the window.
However, this truncation operation introduces negative effects on the signal spectrum. Indeed, these effects also known as side lobes appear during this operation. These side lobes result from the brutal impact of truncation of the signal that comes to replace it by zero outside the support of the rectangular window ΠT. These effects reduce the analysis accuracy.
Weighting windows
To resolve the truncation operation effects, we use the weighting windows ωT(t). This implies that the weighted signal xp(t) is processed instead the truncated signal xT(t).
The new signal is given by :

While performing a fault diagnosis operation based on peaks detection, it is more suitable to have a main lobe as narrow as possible and side lobe amplitudes very low to avoid false alarms. Unfortunately, it is almost impossible to have both properties in the same time. Thus, the weighting windows are chosen based on the nature of the processed where: signal and the searched compromise.
Table 1. Weighting windows description

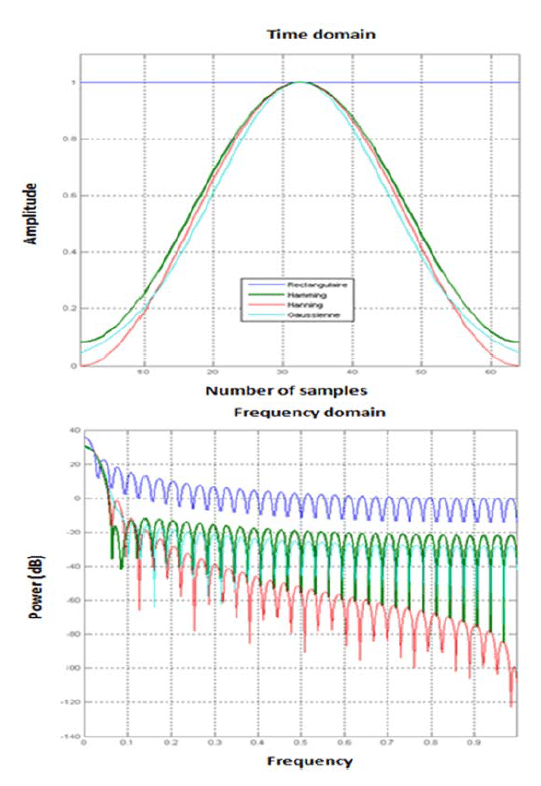
Table 1 gives the main weighting windows used with a compact support. Therefore, we consider the main lobe width at -3dB defined by the parameter L for the frequency resolution Δf, and the amplitude of the highest side lobe given by the parameter A. These windows are shown in Fig. 1 [11].
Discrete Fourier Transform
To determine the Fourier transform of a signal using a digital computer, the number of frequencies obtained is limited due to the limited computing power of the computer. It is therefore necessary to substitute the continuous variable f by a discrete variable.
The operation dedicated to the frequency discretization is based on the replacement of the continuous frequency f by the discrete frequency kΔf (where k is an integer). The obtained frequencies are known as frequencies components of the DFT (Discrete Fourier Transform). Since the FT of a digital signal should be periodic with Fe period, the frequency resolution is given for N samples by the following equation:
where: Δf : Frequency resolution; ; Fe : Sampling frequency; N : Number of samples (with which we calculate the DFT).
The frequency discretization is than defined by a sampling operation in the spectral domain. Numerically, the DFT is expressed by:
FFT Algorithm
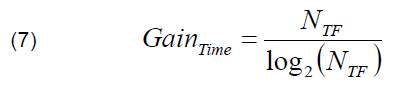
The Fast Fourier Transform, also known as FFT is an algorithm based on fast calculation of the DFT proposed by J.W. Colley and J.W. Tuckey in 1965. The FFT algorithm uses a number of points NTF equal to a power of 2, which results in a computing time gain compared to a classic calculation using the DFT, this gain in time is given by the following equation [11]:
If the number of points obtained after the acquisition step is not a power of 2, the record length of the signal is completed with zeros in order to use the FFT algorithm; this procedure is called as the zero padding procedure or the zeros extension step.
Power spectrum
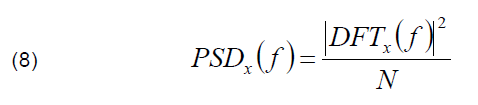
Finally, we define the power spectral density (PSD) as the square modulus of the Fourier Transform. The PSD is independent of the signal phase. In addition, it is always real and positive; it is given by [12]:
Experimental tests
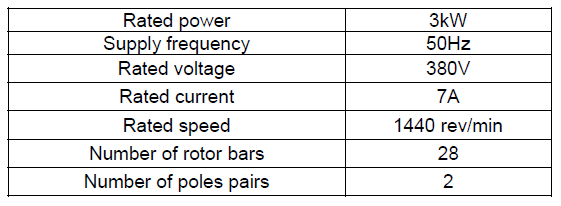
The experimental tests presented in this paper are carried out by the DIAGNOSIS group at the LDEE laboratory at the University of Sciences and Technology of Oran, Algeria. The motor used in these practical tests is a three-phase squirrel cage induction motor coupled to a Direct Current generator used as a load. The parameters of the induction motor are given in the appendix.
In this paper, we deal with the broken rotor bar diagnosis issue; this fault is created artificially in our tests. The measurement chain includes three hall-effect current sensors, an anti-aliasing filter, a tachometer and an acquisition card. Finally, a computer is used to process the acquired signals. this test bench is shown in Fig. 2.
The motor operating modes used to validate the diagnosis procedure are:
– Healthy engine operation.
– Motor operating with 01 broken bar at a motor slip of 4.06%.
– Motor operating with 01 broken bar at a motor slip of 2.13%

Interpretation and discussion
Figure 3 shows the estimation of the power spectral density PSD using the periodogram in the case of 1 broken rotor bar. For this purpose, the spectral analysis is carried out using the four weighting windows studied in this paper. According to eq. (1), the rotor bars fault is located on both side of the fundamental at a particular frequency. For this test, the motor slip is 4.06% which gives a sideband frequency signatures around 45.94Hz and 54.06Hz for k=1. This frequency signature is repeated for the values of k=2,3…etc. Indeed, the parameter k represents the multiplicity of the fault frequency signatures on the spectrum.


For the rectangular window, the frequencies are barely detectable. Whereas for the other windows, the detection of these frequencies is easier. It should be noted that the Hanning window is distinguished by a larger main lobe compared to the Hamming and Gaussian windows. On the other hand, this same Hanning window gives the sideband frequencies with the greatest amplitude.
For the last test shown in Fig. 4, the power spectral density PSD per Periodogram of the stator current in the case of 1 broken rotor bar is highlighted. In this test, the motor slip is equal to 2.13% which gives sideband frequencies close to the fundamental. These frequencies calculated using eq. (1) are located around 47.87Hz and 52.13 from either side of the fundamental. For this low value of the motor slip, the sideband frequencies of the broken rotor fault are too close to the fundamental.
Under these conditions, localization using the rectangular window is almost impossible due to the position of the sideband frequencies regarding the fundamental. For the Hamming and Gaussian windows, the localization is difficult and less obvious compared to the Hanning window. Indeed, the Hamming and Gaussian windows offer a narrow main lobe and therefore are best suited for cases of low motor slip.
Finally, the Hanning window is more suitable in the case of incipient faults, given the large amplitude of the side lobes.
Conclusion
This paper investigates the influence of the weighting windows choice on the frequency resolution of the stator current spectrum. In this aim, we present three weighting windows used to resolve the resolution problems due to the rectangular window use. Indeed, a proper choice of the weighting window is necessary to study critical cases that may arise (e.g. case of low motor slip and incipient faults).
To assess each window, we take into consideration the study of fault diagnosis of broken rotor bars and its identification using the power spectral density spectrum. Through the study of each window, we searched a compromise between a narrow main lobe width and side lobes amplitude. This compromise was clearly shown by the experimental results presented in this paper. It has been observed that the Hanning window gave side lobes of low amplitude but the main lobe is wider.
Furthermore, windows Gaussian and Hamming offer the possibility of having a narrow main lobe but the side lobes has more amplitude than that obtained with the Hanning.
Finally, we can say that the Hanning window is recommended for the diagnosis of incipient faults and the Hamming window or Gaussian window is more appropriate in the case of faults too close to the fundamental. The next step will be devoted to the development of an adaptive process composed of several weighting windows. This process will be achieved using Artificial Intelligence.
Appendix. Induction motor parameters
REFERENCES
[1] H. Henao, G.A. Capolino, M.F. Cabanas, F.Fiippetti, C. Bruzzese, E. Strangas, R. Pusca, J. Estima, M. Riera-Guasp, S.H. Kia, Trends in fault diagnosis for electric machines: A review of diagnostic methods. IEEE Industrial Electronics Magazines, June 2014
[2] W. Li, C.K. Meshefske, Detection of induction motor faults: a comparison of stator current, vibration and acoustic methods, Journal of Vibration and Control, vol. 12, pp. 165-188. 2006
[3] B. Liang, S.D. Iwnicki, A.D. Ball, Asymmetrical stator and rotor faulty detection using vibration, phase current and transient speed analysis, Mechanical Systems and Signal Processing, Elsevier, vol. 17, pp. 857-869. 2003
[4] A.F. Aïmer, A.H. Boudinar, N. Benouzza, A. Bendiabdellah, Simulation and Experimental Study of Induction Motor Broken Rotor Bars Fault Diagnosis using Stator Current Spectrogram, In Proc. of IEEE 3rd International Conference on Control, Engineering & Information Technology (CEIT), Tlemcen, Algeria. 25-27 May 2015.
[5] A. H. Bonnett and C. Yung, Increased Efficiency Versus Increased Reliability, Industry Applications Magazine, IEEE, vol. 14, pp. 29-36, 2008
[6] M. M. Rahman, M. N. Uddin, Online Unbalanced Rotor Fault Detection of an IM Drive Based on Both Time and Frequency Domain Analyses, IEEE Transactions on Industry Applications, vol. 53, no. 4, pp. 4087-4096, July-Aug. 2017
[7] M.E.H. Benbouzid, M. Viera, C. Theys, Induction motors’ faults detection and localization using stator current advanced signal processing techniques, IEEE Trans. on Power Electronics, vol. 14, pp. 14-22, January 1999
[8] M.E.H. Benbouzid, A review of induction motors signature analysis as a medium for faults detection, IEEE Trans. on Industry Electronics, vol. 47, pp. 984-993, October 2000
[9] F. Filippetti, A. Bellini and G. A. Capolino, Condition monitoring and diagnosis of rotor faults in induction machines: State of art and future perspectives, IEEE Workshop on Electrical Machines Design Control and Diagnosis (WEMDCD), Paris, 2013
[10] A. Bendiabdellah, A.H. Boudinar, N. Benouzza, M. Khodja, The enhancements of broken bar fault detection in induction motors. In Proc. of Intl Aegean Conference on Electrical Machines & Power Electronics (ACEMP), Intl Conference on Optimization of Electrical & Electronic Equipment (OPTIM) & Intl Symposium on Advanced Electromechanical Motion Systems (ELECTROMOTION), Side, Turkey, 02-04 Sep. 2015
[11] A.F. Aimer, A.H. Boudinar, M.A. Khodja, A. Bendiabdellah, Assessment of windowing effect on the frequency resolution of the stator current PSD for induction motor broken rotor bars diagnosis, IEEE 1st International Conference on Innovative Research in Applied Science, Engineering and Technology IRASET, Meknes, Marocco 16-19 Apr. 2020
[12] M.B. Koura, A.h.Boudinar, A. Bendiabdellah, A.F. Aimer, Z. Gherabi, Rotor faults diagnosis by adjustable window, Przeglad Elektrotechniczny Journal. March 2021. Vol. 97, Issue 3. pp.123-129
Authors: Dr. Ameur Fethi AIMER, Diagnosis Group-LDEE Laboratory. University of Saida, Algeria. Email: fethi.aimer@yahoo.fr Prof. Ahmed Hamida BOUDINAR, Diagnosis Group-LDEE Laboratory. USTO-Oran, Algeria. Dr. Mohamed Amine KHODJA, Diagnosis Group-LDEE Laboratory. USTO-Oran, Algeria. Prof. Azeddine BENDIABDELLAH, Diagnosis Group-LDEE Laboratory. USTO-Oran, Algeria.
Source & Publisher Item Identifier: PRZEGLĄD ELEKTROTECHNICZNY, ISSN 0033-2097, R. 97 NR 11/2021. doi:10.15199/48.2021.11.12
