Published by Pietro Vincenzo Barbaro, Antonio Cataliotti, Valentina Cosentino, Salvatore Nuccio, Dipartimento di Ingegneria Elettrica, Elettronica e delle Telecomunicazioni, Università di Palermo, Palermo, Italy. E-mails: barbaro@diepa.unipa.it, acataliotti@ieee.org, cosentino@diepa.unipa.it, nuccio@unipa.it
Abstract: This paper presents a comparative analysis among different nonactive power quantities proposed in literature in nonsinusoidal conditions; with respect to this, a new single-point approach is proposed, for the detection of the dominant harmonic sources in polluted power systems. It is based on the observation that in the same distorted working condition the analyzed power quantities present a different behavior. In order to verify the theoretical assumptions, some simulations tests were carried out on a standard IEEE test system, proposed as a benchmark for harmonic propagation studies. Simulation results show how the approach based on a comparison of different definitions of nonactive powers can give some useful information for the detection of dominant harmonic sources.
Keywords: harmonics, nonactive powers, harmonic sources.
1. INTRODUCTION
In the last years current and voltage distortion is ever increasing and the problem of the detection of harmonic sources has become more urgent, because of the proliferation in distribution systems of a number of loads that draw non-sinusoidal currents. In practical situations, harmonic sources can be located both upstream and downstream the metering section, so that both supply and load may be responsible for harmonic distortion. Thus, it has became a very important target to determine customers and utilities polluting contributions to the disturbances affecting the supply voltage at the metering section.
The traditional billing quantities do not allow one to achieve any useful information about the responsibility for the disturbances affecting the power system. They are related to the concepts of active, reactive and apparent powers, and power factor, that are well known in sinusoidal conditions, but that are not meaningful anymore in nonsinusoidal situations (with the exception of the active power). On the other hand, the international standards concerning the measurement on polluted power systems, refers to the measurement of the amplitudes of single harmonics and of some traditional parameters, such as the Total Harmonic Distortion Factor (THD), but do not provide any piece of information about the detection of harmonic sources.
With respect to this problem, several approaches have been proposed in literature for harmonic sources detection. They can be generally divided into multi-point and single-point methods [1-4]. The multi-point methods are based on the elaboration of more than one measurements performed in different metering sections; these methods can give a complete information about the harmonic state of the power system, but they require the implementation of a distributed and synchronous measurement system, with a complex and expensive measurement instrumentation. On the contrary, the single-point methods have many advantages, e.g. easy implementation and low cost, but in some conditions they can report imprecise information about the harmonic state of the system. Some of single-point strategies are based on the evaluation of harmonic active power flow at the metering section. However, it has been demonstrated that in some practical situations this approach cannot provide a correct information about the location of the dominant harmonic source, upstream or downstream the metering section. On the other hand, it could be interesting to study the behavior of “nonactive” components of the apparent power. The interpretation of these power terms has been widely discussed in literature [5-8]. Several “nonactive” power definitions have been formulated, starting from different approaches for the grouping of the terms of instantaneous power that do not contribute to the net transfer of energy.
In this paper the authors have investigated if a comparative evaluation of different definitions of nonactive powers, already proposed in literature, could give useful information about the non-linearity degree of the power system and the location of the dominant harmonic source. Thus, a new approach is proposed for the detection of the dominant harmonic source in power systems, that is based on the simultaneous evaluation of three nonactive power quantities at the metering section. The new approach starts from the theoretical observation that in the same distorted working condition the considered power quantities present a different behavior. This is due to the different grouping of the components of the terms of instantaneous power that do not contribute to the net transfer of energy. The proposed strategy was firstly validated on a simple test system, developed by the authors, that is able to simulate different working conditions, with both sinusoidal and distorted supply and both linear and non linear loads. Further simulations were carried out on a IEEE standard test power system [9], proposed, by other authors, as a benchmark system for the analysis of multi-point measurement techniques for harmonic pollution monitoring. Simulation results show how the approach based on a comparison of different definitions of nonactive powers could give some useful information for the detection of dominant harmonic sources.
2. THE CONCEPT OF REACTIVE POWER IN NONSINUSOIDAL CONDITIONS
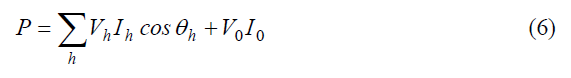
It is well known that, for steady-state conditions, in a single-phase system affected by harmonics, the instantaneous voltage and current can be expressed as follows [5]:

where v1 and i1 are the power system frequency components of voltage and current, and the remaining terms vh and ih contain all the remaining harmonic components. V1 and I1 are the rms values of the fundamental components of voltage and current, Vh and Ih are the rms values of the h-harmonic components of voltage and current, α1 and β1 are the phase angles of the fundamental components of voltage and current, αh and βh are the phase angles of the h-harmonic components of voltage and current, ω=2πf is the angular frequency, t is the time, V0 and I0 are the direct voltage and the direct current terms, obtained for h = 0.
The instantaneous power is the product of the instantaneous voltage and current; it can be written as:

(The angle θh = βh −αh is the phase angle between the phasors Vh and Ih).
The first term, pa, contains all the components that have non-zero average value; the total average value is the active power, which is equal to the sum of harmonic active powers:
The second term, pq, contains all the components whose average value is nil, thus it does not contribute to the net transfer of energy. The first addendum of pq contains the terms related to harmonic components that are present in both voltage and current; the other addenda contains the terms related to harmonic components that are not common to both voltage and current, including the direct components.
As it is well known, in the sinusoidal case, the first addendum is a sinusoidal term, with a frequency double of the power system frequency, while the other addenda are nil; the amplitude of the double-frequency component is the reactive power.
Finally, the apparent power is given by the product of the rms values of voltage and current:

The interpretation of pq in nonsinusoidal case has been widely discussed in literature. Several “nonactive” power definitions have been formulated, starting from different approaches for the grouping of the components of pq. The developed power theories can be mainly classified into time-domain and frequency-domain approaches [6-8].
The time domain approach is based on the concept of splitting the load current into two or more components, that are meant to be responsible for different energy phenomena. The most general time-domain power theory is due to Fryze. Its approach is essentially based on the separation of the current i into two components; the first one, namely the “active” current ia, is in phase with the voltage and has the same waveform, the second one, namely the “nonactive” or “reactive” current, ir = i – ia is the remaining part of the current. Starting from this approach, the apparent power can be divided into active and reactive power (in analogy with the sinusoidal case). On the other hand, the first power theory in the frequency-domain was formulated by Budeanu: it was based on the assumption that in nonsinusoidal situations, a power system can be ideally decomposed into a number of elementary sinusoidal systems, each one corresponding to a singular harmonic of the spectrum of the voltage or of the current . In this sense for each elementary sinusoidal system, the traditional electrical quantities can be defined (rms values of voltage and current, active, reactive and apparent powers and power factor). Starting from the Fryze and Budeanu approaches, many other power theories have been developed and different definitions of reactive power have been formulated (Kusters-Moore, Page, Shepherd-Zakikhani, Sharon, Czarnecki, etc).
However, it can be observed that none of the proposed definitions is able to maintain all the properties of the reactive power in the sinusoidal case. Moreover, many of the above mentioned power theories were developed for the single-phase case; their extension to the three-phase system is not a trivial question, and it is strictly related to the generalization of the apparent power concept, that, in the three-phase case, is not uniquely defined. In this sense, different concepts for the apparent power were introduced and discussed in literature [10-11]. From the physical point of view, the expression (7) can be interpreted in different ways. A first concept is that the apparent power is considered as the maximum active power that can be transmitted under ideal conditions, (i.e. sinusoidal symmetric voltages and sinusoidal balanced currents) with the same voltage impact (insulation and no-load losses) and the same current impact (line losses). This is the approach of the IEEE Standard 1459-2000 [5]. A second concept is that the apparent power is considered as the maximum active power that can be transmitted for the given voltage waveform and the given current rms value of the current (line losses). This definition corresponds to the concepts developed by many authors (Buchholz, Fryze, ecc.) [10]. On the other hand, other definitions of apparent power were introduced, such as the “Arithmetic Apparent Power”, given by the sum of the phase apparent powers, or the “Vector Apparent Power” [11].
It was demonstrated that, in the sinusoidal and balanced case, all these concepts for the apparent power lead to the same results On the contrary, in the most general case of a distorted and unbalanced system, the definitions of apparent power lead to different results.
3. THE PROPOSED APPROACH
It can be observed that, in sinusoidal conditions, all the definitions of reactive power lead to the same result, that is the sinusoidal reactive power. On the contrary, in the presence of harmonic distortion they assume different values. This difference can be very significant, depending on the working conditions, i. e. depending on the amount of the harmonic distortion in both voltage and current and on the presence of common and uncommon harmonics in voltage and current. This is due to the different grouping of the components of the terms of instantaneous power that do not contribute to the net transfer of energy. In some cases only the harmonic components that are common to both voltage and current are considered. In other cases, like in the Fryze approach, both common and uncommon harmonics are considered. In other cases an intermediate situation is considered.
Starting from these considerations, the authors have investigated if a comparative evaluation of different reactive powers, already defined in literature, could give useful information about the non-linearity degree of the power system and the location of the dominant harmonic source. More in detail, the following quantities are considered:
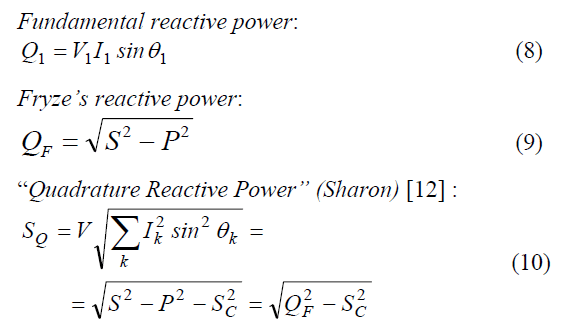
(S is the apparent power, P is the active power, V is the rms value of the voltage, SC the complementary power [12] and k is the index related to the harmonic components that are common to both voltage and current).
Q1 can be considered as a minimum reference value, since it is the only nonactive power component in the sinusoidal condition; on the other hand, QF is the maximum value for the nonactive power, since it is related to all terms of pq, and it is the only nonactive component of the apparent power. It can be easily observed that the higher is the amount of distortion, the higher is the difference between Q1 and QF. On the other hand, the expressions of SQ lead to a nonactive power value that is intermediate between Q1 and QF, due to the fact that SQ is not the only nonactive component of the apparent power as shown by (10). SQ depends on both common and uncommon harmonics of the voltage and common harmonics of the current.
Therefore, in case of a non sinusoidal supply voltage and a linear load, the harmonic content of the current corresponds to the one of the voltage and its contribution, in terms of power, is small if compared with the fundamental one. Thus, SQ is closer to Q1 than to QF. On the contrary, in case of a sinusoidal supply voltage and a non linear load the amount of the distortion of current is higher than the one of the voltage. In this case, SQ is closer to QF than to Q1. in this sense, SQ can be considered as an indicator of the nonlinear behavior of the load. Finally when the supply voltage is sinusoidal and the load is linear SQ, Q1 and QF have comparable values.
Therefore, a comparison among Q1, QF and SQ, calculated in a PCC in the same working conditions, could give a piece of information on the detection of disturbing loads. In a single point strategy, the proposed approach could be combined with the one based on the sign of active power harmonic components [4], allowing one to avoid misleading results.
The proposed approach was developed for three-phase systems, considering each of the nonactive powers Q1, QF and SQ as the sum of the respective phase quantities. This was preliminarily made for the balanced case, where the different approaches for apparent power resolution lead essentially to the same results. On the other hand, the validity of the proposed approach was investigated also in the unbalanced case. In this case, the separation of the effects of the unbalance and nonlinearity is not easy to achieve, because of the overlapping of the effects due to such disturbances.
4. SIMULATIONS
4.1. Preliminary validation
In order to carry out a preliminary validation of the proposed approach, a simple three-phase balanced test system was implemented on a calculator, by means of the software package POWER SYSTEM BLOCKSET® of MATLAB®. The test system was realized with: a three phase symmetrical voltage supply, either sinusoidal or distorted (THD = 6,9%) with a known harmonic content; an equivalent network impedance; a linear and balanced load (resistive-inductive load) and a non linear and balanced load (a diode bridge rectifier feeding a dc load; it was dimensioned in order to absorb a fundamental active and reactive power equal to the one absorbed by the linear load). The implemented test system is reported in figure 1.
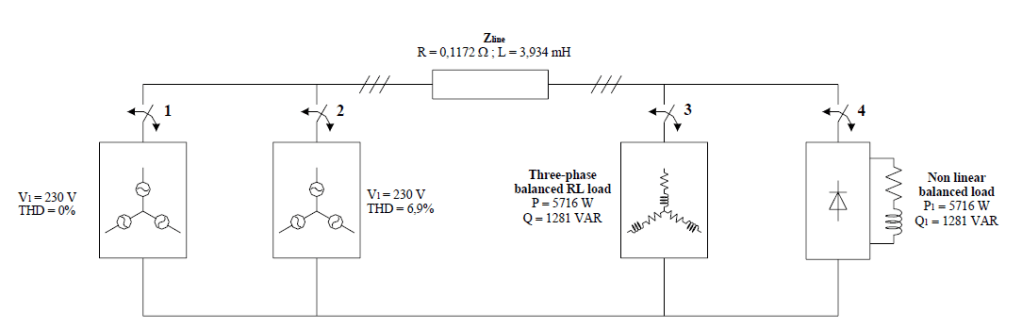
Simulations were carried out for different working conditions:
1. sinusoidal supply voltage and linear load (switches 1 and 3 closed, 2 and 4 open);
2. sinusoidal supply voltage and non linear load (switches 1 and 4 closed, 2 and 3 open);
3. nonsinusoidal supply voltage and linear load (switches 2 and 3 closed, 1 and 4 open);
4. nonsinusoidal supply voltage and non linear load (switches 2 and 4 closed, 1 and 3 open).
The proposed approach, based on the comparison of the nonactive powers Q1, QF and SQ, was implemented by means of the software package SIMULINK® of MATLAB®; each phase was considered as a single phase system and the three-phase quantities were evaluated as the sum of the respective reactive powers obtained for each phase.
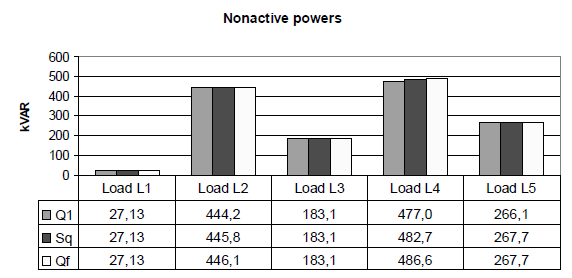
In figure 2 some simulation results are reported, that are referred to the above mentioned working conditions.

As expected, the nonactive powers Q1, SQ and QF have different values in the same working condition, with the exception of the case of sinusoidal supply and linear load. More in detail, it can be observed that Q1 and QF assume respectively the minimum and the maximum value for nonactive power. The difference between these values is more significant when the harmonic distortion is present and when the load is nonlinear; in this sense, the difference between Q1 and QF can be considered as a global indicator of the non linearity degree of the system. Further considerations can be made with respect to the value of SQ that is intermediate between Q1 and QF; its value depends on the nonlinearity degree of the load. For example, in the case of a sinusoidal supply and a non linear load SQ is close to QF, while in the case of a linear load and a nonsinusoidal supply SQ is close to Q1. Finally in the case of nonsinusoidal supply and non linear load the values of SQ is between Q1 and QF.
4.2. IEEE Test System
In order to test the proposed strategy on a more complex real size network, further computer simulations were carried out on the IEEE Test System n. 2 proposed in [9] (see figure 3). This system was already used as a benchmark for the analysis of some multi-point measurement techniques for harmonic pollution monitoring by other authors [1]. It is based on the IEEE 13 bus radial distribution test feeder; it contains voltage, regulators, three and single phase line configurations, shunt capacitors, spot and distributed loads. Phase-ground and phase-phase connected loads are included. For harmonic studies, load compositions are specified to include harmonic producing loads. Three types of loads are considered for test purposes: fluorescent light banks, adjustable speed drives, and composite residential loads. Complete data of the system are reported in [9].

The IEEE benchmark network was implemented by means of the PSCAD/EMTDC software. With respect to the original network configuration reported in [9], the following simplifying assumptions were made [1]: the distributed load between nodes 32 and 71 were modeled as two spot loads connected to the above mentioned nodes; all the three-phase lines were considered as transposed and they were modeled by means of balanced π branches; the loads supplied by single-phase and two-phase feeders were aggregated to the closest three-phase node, thus obtaining a complete three-phase network. With these assumptions, the network under test essentially consisted of a sinusoidal and balanced power source (at node 50), a transformer (between nodes 50 and 31) and the following five loads:
– L1 (at node 33, including the single-phase load 34);
– L2 (at node 32, consisting of the single-phase load 45, the phase-phase load 46, and half the distributed load between nodes 32 and 71);
– L3 (at node 71, consisting of half the distributed load between nodes 32 and 71, the phase-phase load 92 and the single-phase loads 52 and 911, with shunt capacitors);
– L4 (at node 71, consisting of a three-phase load);
– L5 (at node 75, consisting of a three-phase load, with shunt capacitors).
The simulations were carried out considering several different network configurations obtained by substituting some of the nonlinear and/or unbalanced loads with equivalent linear and balanced loads having the same power characteristics of the original ones. Moreover, further simulations were carried out on a modified the test system, that was obtained by substituting the nonlinear and unbalanced loads with nonlinear but balanced loads (they were obtained by reproducing the harmonic content of phase A on the other phases). This was made in order to verify the validity of the proposed strategy when the power system is contemporary affected by both harmonic distortion and unbalance.
In each test, the simulation on the PSCAD/EMTDC environment were run and the instantaneous values of voltages and currents were calculated for each considered load. The obtained data were saved in a MATLAB file and they were used as input data for the evaluation of the nonactive powers Q1, SQ and QF for each metering section.
The first series of tests were performed on modified test systems, where only one load at time was considered in its original configuration, while all other loads were substituted with their linear and balanced loads. Moreover, when the disturbing load was both nonlinear and unbalanced, the tests were repeated by substituting the original load with a nonlinear and balanced load, as described before.
The simulation results showed that the comparison of the powers in each metering section led to the correct individuation of the dominant polluting source.
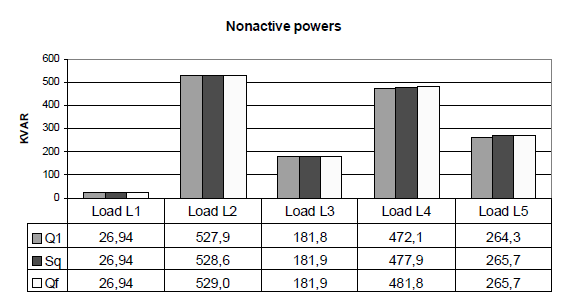
For example, figure 4a shows the simulation results in the case of loads L1, L2, L3, L4 linear and load L5 (globally capacitive) non linear and unbalanced, in its original configuration reported in [9]. It can be observed that for the loads L1, L2, L3 and L4, the nonactive powers Q1, SQ and QF are very close in all cases; thus, it can be deduced that these load have a linear behavior and the harmonic distortion at the metering section is due to the supply. On the contrary, for the load L5, the difference between the considered nonactive powers are more significant and SQ is closer to QF; thus, it can be concluded that L5 is the disturbing load. The same considerations can be made with respect to the case reported in figure 4b, where the original load L5 was substituted by a nonlinear and balanced load. Also in this case, the comparative analysis of the nonactive powers Q1, SQ and QF leads to the correct individuation of the disturbing load L5.
The second series of test were performed considering more than one nonlinear loads at time. For example, figures 5a shows the obtained results in the case of loads L1, L3 and L5 linear and loads L2 and L4 non linear (original configurations). The analysis of the nonactive powers in each metering section led to the correct location of the disturbing loads. Also in this case, the tests were repeated by substituting the original nonlinear loads with the nonlinear and balanced loads; figure 5b shows the obtained results. In both cases, the analysis of the nonactive powers in each metering section led to the correct location of the disturbing loads.
Finally, also in the case of all nonlinear loads the proposed strategy based on nonactive powers led to the correct location of the disturbing loads. In Figure 6a and 6b the simulations results are reported; in detail, figure 6a is referred to the original configuration of the test system, while figure 6b is referred to the modified test system, obtained by substituting all the nonlinear and unbalanced loads with the nonlinear balanced loads.


5. CONCLUSIONS
In this paper a new single-point strategy is proposed, for the detection of the dominant harmonic source in a polluted power systems. It is based on the comparison among different reactive power quantities proposed in literature, that, in the same working conditions, assume different values at the metering section. Several simulation tests were carried out on a standard IEEE test system, proposed, by other authors, as a benchmark system for the analysis of multi-point measurement techniques for harmonic pollution monitoring. The obtained results show that the proposed approach can give useful indications for the detection of the dominant harmonic source in a metering section, in both balanced and unbalanced situations. On the other hand, the proposed approach can be used also in multi-point strategy to detect disturbing loads, performing a comparison among Q1, QF and SQ in each metering section and. In this sense, the combination of different strategies could be useful, in order to achieve a better information on the harmonic state of the system and on the location of harmonic sources.
REFERENCES
[1] C. Muscas, L. Peretto, S. Sulis, R. Tinarelli, “Implementation of multi-point measurement techniques for PQ monitoring” IEEE Instrumentation and Measurement Technology Conference, IMTC 2004, 18-20 May 2004, Como, Italy, pp. 1626-1631.
[2] A. P. J. Rens, P. H. Swart, “On Techniques for the Localization of Multiple Distortion Sources in Three-Phase Systems. Time Domain Verification” ETEP, Vol. 11, No 5, Sept.-Oct. 2001.
[3] E. J. Davis, A. E. Emmanuel, D. J. Pileggi, “Evaluation of Single-Point Measurements Method for Harmonic Pollution Cost Allocation” IEEE Trans. On Power Delivery, Vol. 15, No 1, January 2000.
[4] M. Aiello, A. Cataliotti, V. Cosentino, S. Nuccio, “A Self-Synchronizing Instrument for Harmonic Sources Detection in Power Systems”, IEEE Transactions on Instrumentation and Measurement, Vol. 54, No 1, February 2005, pp. 15-23.
[5] IEEE Std 1459-2000, “IEEE Trial-use standard definitions for the measurement of electric power quantities under sinusoidal, non sinusoidal, balanced or unbalanced conditions”, September 2002
[6] P. S. Filipski, P. W. Labaj, “Evaluation of reactive power meters in the presence of high harmonic distortion”, IEEE Trans. On Power Delivery, Vol. 7, No. 4, October 1992.
[7] A. E. Emanuel, “Powers in nonsinusoidal situation. A review of definitions and physical meaning”, IEEE Trans. On Power Delivery, Vol. 5, No. 3, July 1990
[8] L. S. Czarnecki, “Budeanu and Fryze: two frameworks for interpreting power properties of circuits with nonsinusoidal voltages and currents”, Electrical Engineering, vol. 80, n. 6, 1997, pp. 359-420.
[9] IEEE Task Force on Harmonics Modeling and Simulation, “Test Systems for Harmonic Modeling and Simulation”, IEEE Transactions on Power Delivery, vol. 14, n. 2, 1999, pp. 579-587
[10] J. L. Willems, J. A. Ghijselen, A. E. Emanuel “The apparent power concept and the IEEE Standard 1459-2000”, IEEE Transactions on Power Delivery, Vol. 20, No. 2, pp. 876-884, April 2005, pp. 876-884
[11] A. E. Emanuel, “Apparent power definitions for threephase systems”, IEEE Transactions on Power Delivery, vol. 14, n. 3, July 1999, pp. 767-772
[12] D. Sharon, “Reactive power definitions and power factor improvement in nonlinear systems”, Proc. IEE, Vol 120, n. 6, 1973, pp. 704.706
Source URL: https://citeseerx.ist.psu.edu/document?repid=rep1&type=pdf&doi=08a680e923b0baff60eaa25dc17109aee0456c4e , XVIII IMEKO WORLD CONGRESS Metrology for a Sustainable Development September, 17 – 22, 2006, Rio de Janeiro, Brazil.
