Published by M. Jawad Ghorbani, H. Mokhtari**, Dept. of CSEE, West Virginia University, Morgantown, WV, USA, ** Dept. of EE, Sharif University of Technology, Tehran, Iran.
ABSTRACT – This paper investigates the harmonic distortion and losses in power distribution systems due to the dramatic increase of nonlinear loads. This paper tries to determine the amount of the harmonics generated by nonlinear loads in residential, commercial and office loads in distribution feeders and estimates the energy losses due to these harmonics. Norton equivalent modeling technique has been used to model the nonlinear loads. The presented harmonic Norton equivalent models of the end user appliances are accurately obtained based on the experimental data taken from the laboratory measurements. A 20 kV/400V distribution feeder is simulated to analyze the impact of nonlinear loads on feeder harmonic distortion level and losses. The model follows a “bottom-up” approach, starting from end users appliances Norton equivalent model and then modeling residential, commercial and office loads. Two new indices are introduced by the authors to quantize the effect of each nonlinear appliance on the power quality of a distribution feeder and loads are ranked based on these new defined indices. The simulation results show that harmonic distortion in distribution systems can increase power losses up to 20%.
Keyword: Harmonic Distortion, Loss Estimation, Non-linear Loads, Norton Equivalent Model, Power Quality
1. INTRODUCTION
In recent years, the use of nonlinear electronic loads such as compact fluorescent lamps (CFLs), computers, televisions, etc. has increased significantly. Nonlinear loads inject harmonic currents into distribution systems. When a combination of linear and nonlinear loads is fed from a sinusoidal supply, the total supply current will contain harmonics. The injected harmonic currents and the resulted harmonic voltages can cause power quality problems and affect the performance of the consumers connected to the electric power network [1].
Excessive heat in equipment, components aging and capacity decrease, malfunction of protection and measurement devices, lower power factor and consequently reducing power system efficiency due to the increasing losses are some main effects of harmonics in power distribution systems. Harmonic distortions also increase the monetary costs in power systems by increasing energy losses, premature aging or de-rating of electrical equipment [2]. The energy loss due to harmonics caused by a large number of nonlinear loads used in different power system sectors can be estimated. The difference between the generated power and the consumed power us considered as the energy loss. However, energy losses in distribution networks are generally estimated rather than measured, because of inadequate metering in these networks and also due to high cost of data collection. Moreover, power system distribution loss estimation methods are reliable ways to determine the technical losses.
This work uses an accurate Norton equivalent model for 20 kV/400V feeders to estimate distribution network losses. In that model, residential, commercial and office load types are modeled using their appliances models by the process of synthesis. Then a feeder model is obtained by aggregating different residential, commercial and office load models.
The appliances are modeled by Norton equivalent technique. To obtain the Norton equivalent model of an appliance, measurement results under different operation conditions are required. Thus, voltage and current waveforms for more than 32 nonlinear appliances are measured using a power quality analyzer set. The Norton model parameters for each appliance are calculated using the measurements results under different operating conditions. More details about Norton equivalent model of appliances and loads is presented in [3-5]. The authors have also introduced new indices to quantize each appliance impact on the power quality in power distribution systems. The proposed indices take the harmonic distortion caused by each load, their rms current value and daily operation time into account.
This paper is organized as follows. In Section 3, harmonic power formulation for nonlinear loads is introduced. In Section 4, characteristics of some nonlinear appliances are presented and harmonic characteristics of different appliances are described. In Section 5, obtaining a Norton model for a nonlinear load based on the measurement data is discussed. In section 6, different appliances models are presented. Loads effect on power quality using the new introduced indexes is discussed in section 8. The losses due to nonlinear loads in a sample 20 kV/400 V feeder are simulated and analyzed in section 9. Finally, the conclusions are summarized in Section 10.
2. RELATED WORKS
Accurate loss estimation plays an important role in determining the share of technical and commercial losses in the total loss. Researchers have tried to estimate the losses in distribution systems by different methods. Some works have used the simplified feeder models and curve fitting approaches to estimate the losses [6-10]. A comprehensive loss estimation method using detailed feeder and load models in a load-flow program is presented in [11]. A combination of statistical and load-flow methods is used to find various types of losses in a sample power system in [12]. Simulation of distribution feeders with load data estimated from typical customer loads is performed in [13]. Ref. [14] applies some approximations to power flow equations in order to estimate the losses under variations in power system components. A fuzzy-based clustering method of losses and fuzzy regression technique and neural network technique for modeling the losses are obtained in [15, 16]. It is difficult to guarantee the reliability of the simplified, statistical and approximate models. The drawback of the fuzzy based methods is that they don’t consider the power system dynamics.
3. HARMONIC POWER FORMULATIONS
If a signal contains harmonics, the Individual Harmonic Distortion (IHD) for any harmonic order is defined as:

Where Ih/Vh is the current/voltage harmonic of order h, and I1/V1 is the fundamental current/voltage component. Nonetheless, for determining the level of harmonic content in an alternating signal, the term “Total Harmonic Distortion” (THD) of the current and voltage signals are widely used. The current and voltage THD of a harmonic polluted waveform can be expressed as:

Where I and V are the current and voltage rms values. The separation of the rms current and voltage into fundamental and harmonic terms resolves the apparent power in the following manner [16].

Where S1 is the fundamental apparent power. The presence of harmonics causes the presence of a new type of non-fundamental apparent power (SN) which is resolved in the following three distinctive terms [17]:
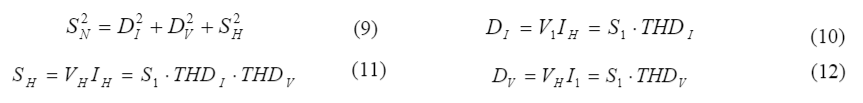
In practical power systems, THDI > THDV , and SN can be computed using the following expression:
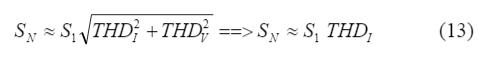
Power factor is not only affected by the phase displacement between voltage and current waveforms. The existence of non-fundamental apparent power (SN) also affects the power factor. Power factor will decrease in presence of harmonics and consequently distortion power (non-fundamental apparent power, SN). In the case of presence of harmonics, power factor is composed of two factors, Displacement Power Factor (pfdisp) and Distortion Power Factor (pfdist).
Where p is the real power. Nonlinear loads can be considered as harmonic real power sources that inject harmonic real power into the distribution system which is the product of the harmonic voltage and current of the same orders. Although this power is much smaller than the fundamental real power, the presence of the distortion power caused by harmonics will result in increased losses in the utility supply system.
In the presence of harmonics, the loss would be as shown in Eq.17. Therefore, it can be seen that a significant increase in loss of the utility will occur in the presence of harmonic distortions. For example, with a THDI=40%, the loss would be increased by 16%. For a three-phase three-wire utility, the total losses are shown in Eq.18.

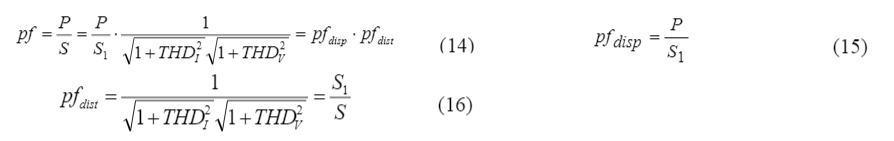
Where Ip is the phase current of the balanced network and In is the neutral line current. The harmonic losses are:
Where Iah, Ibh, and Ich are the harmonic h currents in phase A, B and C respectively, INh is the hth harmonic of the neutral current, and Rp and Rn are the phase and neutral resistances.
The loss in the neutral wire can be considerable and may result in overloading due to 1) the unbalanced loads and 2) the zero-sequence currents [11].
4. NONLINEAR LOADS CHARACTERISTICS
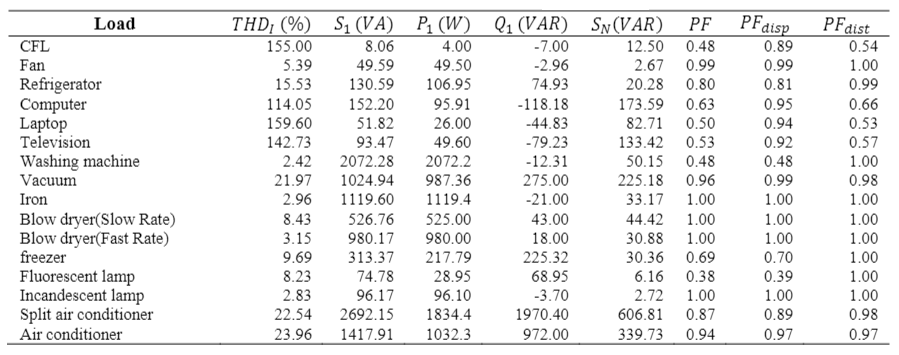
This section presents the measurement results for some common residential and commercial appliances. The measurements consist of current and voltage THD’s, load rms current, power factor, and active and reactive powers. All the measurements are done using a HIOKI 9624 power quality analyzer. The ac current waveform of a 4W CFL as a nonlinear load is shown in the Figure 1. In Figure 2, the harmonic spectra are shown for three different brands of CFLs. Table 1 shows the electrical parameters for some linear and nonlinear appliances which are usually used in residential, commercial and office load types. Active, reactive powers and also non-fundamental apparent power (SN), which has a nonzero value for nonlinear loads, are calculated for each appliance.
Fortunately, for many appliances the harmonic real power is much smaller that the fundamental real power. But, the harmonic current increases the apparent power (S), increasing the power losses. In this work, the power factor for all appliances is also measured and the effect of displacement and distortion factors on the total power factor is investigated. What follows is a summary of the measurements of the some appliances.
5. NORTON EQUIVALENT MODEL
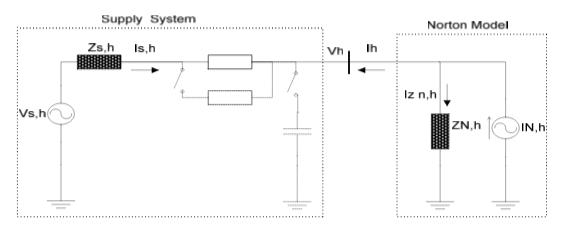
To obtain a Norton model for a nonlinear load, the circuit shown in Figure 3 can be used [12, 13]. In this circuit, the supply side is represented by the Thevenin equivalent while the nonlinear load side is represented by its Norton equivalent. To calculate the Norton model parameters, the measurement of voltage (Vh) and current (Ih) spectra at two different operating conditions of the supply system are needed. The change in the supply system operating condition can for example be obtained by switching a shunt capacitor, a parallel transformer, shunt impedance or some other changes that cause a change in the supply system harmonic impedance [12, 13].
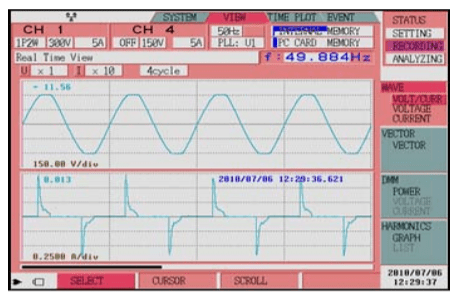
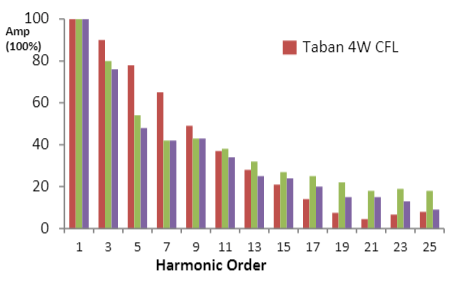
Table 1. Measurement results for some appliances
However, such changes in the supply system will not yield unique parameters for the Norton model, and the Model parameters are dependent on the amount of change. This makes the accuracy of the model debatable. In [13], it is shown that the Norton model parameters which are obtained by changing the supply voltage are more accurate and valid for a wider range of voltage variations. Also, changing the supply voltage, beside its simplicity, does not require switching large capacitors or impedances which may cause some problems for network components.
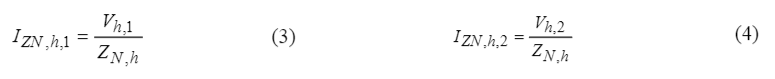
As Figure 3 shows, when the supply voltage varies, harmonic voltage Vh and harmonic current Ih will change, and IN,h, finds a path which consists of a parallel combination of ZN,h, and the supply system impedance. With the assumption of no change in the operating conditions of the nonlinear load, it can be seen from Figure 3 that Ih,1 and Ih,2 can be expressed as:

The harmonic Norton impedance current IZN,h, before and after the change can be expressed as:
By substituting Eqs. (3) and (4) into Eqs. (1) and (2) and solving for ZN,h, and IN,h, the following formulas are achieved [13]:

Where Vh,1 and Ih,1 are the harmonic voltage and current measurements before the change in the operating condition, and Vh,2 and Ih,2 are the measurements after the change.
These equations are complex and the phase angles should be measured precisely. In the following section, a Norton model is developed for some commonly used appliances.
6. RESIDENTIAL, COMMERCIAL AND OFFICE LOADS NORTON EQUIVALENT MODEL
In this section, a model for residential, commercial and office loads is developed by aggregating their corresponding appliances models. To develop the Norton model for each appliance at least two measurements at different operating condition of the supply system are needed. More details about how to achieve the Norton equivalent model parameters using measurement results is described in previous sections and [16-20].
Norton equivalent model parameters consist of ZN and IN for each harmonic order. The Norton equivalent model is developed for each harmonic order separately, and the complete Norton equivalent model is obtained by combining these models. The Norton model parameters for different residential loads are given in Table 3.
In this work, more than two different operating conditions are considered to obtain better modeling results. The measurements are performed at more than two hundred different operating conditions of the supply voltage. The obtained Norton equivalent current and impedances values at different operating conditions converge to specific value which makes the results more reliable. After modeling each appliance, residential, commercial and office loads Norton equivalent model are achieved by aggregating their corresponding appliances Norton equivalent models. A feeder Norton equivalent model will then be obtained by aggregating corresponding residential, commercial and office load Norton equivalent models
7. SIMULATION OF A 20 KV DISTRIBUTION FEEDER
This section analyses the characteristics of a sample distribution network feeder modeled by Norton equivalent technique. This feeder model is obtained by aggregating the Norton equivalent model of all end user appliances for all type types of loads i.e. residential, commercial and office loads. A simple schematic for a 3-phase balanced distribution network is shown in Figure 4. As Figure 4 shows, the sample feeder feeds 3 different loads (residential, commercial, office). The total feeder load is equal to the sum of all 3 loads. In this section, a sample office load model and its characteristics are specifically investigated, and then simulation results for a feeder consisting of residential, commercial and office loads are presented.
Using the models for each appliance, an estimation of the power quality of an office load can be obtained. It is assumed that the office load consists of 2 PCs, 2 CFLs and 2 fans with slow and fast rates. The loads turn on one by one. Figs. 5 and 6 show the rms current and the THD of the office load. The points of turning on or off for each appliance are specified in Figure 5. The Total Harmonic Distortion (THD) of the office load depends on its appliances THD and their rms current value. As Figs. 5 and 6 show, the THD decreases as the accumulative load currents increases. To model a distribution feeder, it is assumed that a 20 kV feeder feeds residential, commercial and office loads. Each load type appliances are described in Table 2. The appliances turn on one by one, and finally, all of the appliances are in service. The effect of each appliance on the feeder THD is dependent on each appliance THD and its current rms value.
Table 2. Simulated residential, commercial and office load appliances
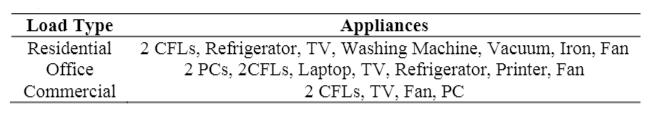
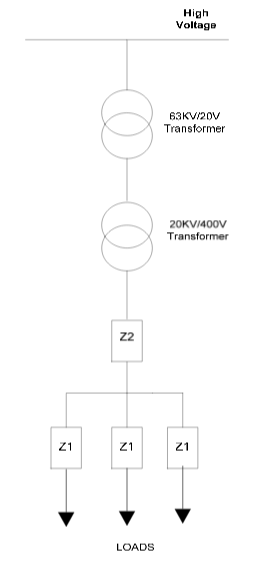
Table 3. Norton Model Parameters for Residential appliances (A, Ω)


8. NONLINEAR LOADS RANKING BASED ON TWO NEW POWER QUALITY INDICES
In this section, two new indices are introduced to determine the impact of each appliance on a feeder power quality. The first index indicates the contribution of each load in the feeder THD. This index is defined in Eq. (1). Where THDK is total harmonic distortion of load k and Irms,K is its current rms value. As described in (1), THDC indicates the contribution of each load in the feeder THD in presence of other loads. Assuming that all loads in Table 2 are in service, the THDC index for each appliance can be calculated. The results are shown in Table 4. As shown in Table 4, the Split air conditioner has the most destructive effect in comparison with the other loads. Although, the THD of the Split air conditioner is not more than that of the other loads, it has a worse effect on power quality than others.
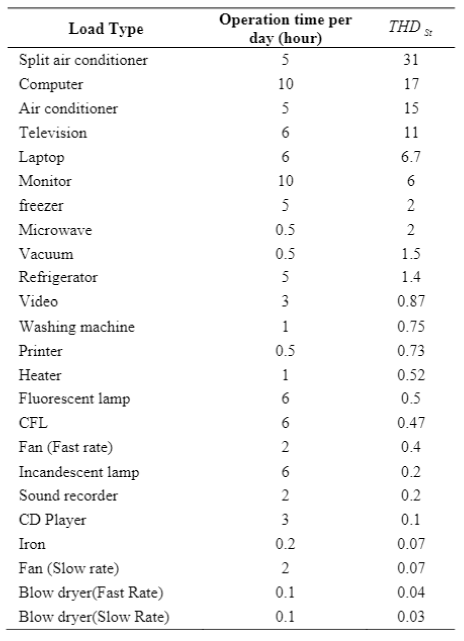
THDC is a useful index to classify loads based on their effects on power quality, but it is evident that appliances operating time during the day is also a very important factor and should be considered in the calculations. Therefore, a new index (Eq.2) which takes into account the daily operation time for each appliance is defined,
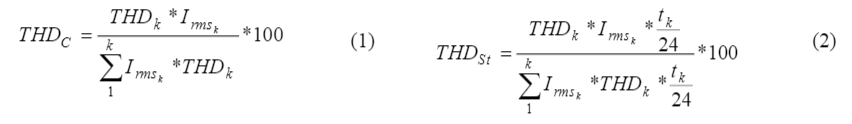
Where tk is the appliance operating time per day. In Table 5, loads are ranked based on the new index value. As shown in Table 5, the new loads ranking based on THDST index is different with that when the loads ranking based on THDC index. According to the new ranking, appliances with longer operating time per day have higher ranks. For example, long operation time of a computer causes a higher rank based on THDST index as compared to the ranking by THDC index.
9. POWER LOSS SIMULATIONS IN A DISTRIBUTION FEEDER
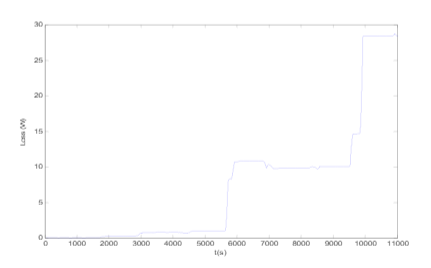
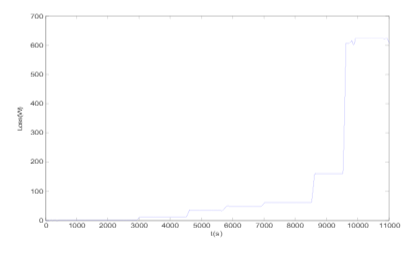
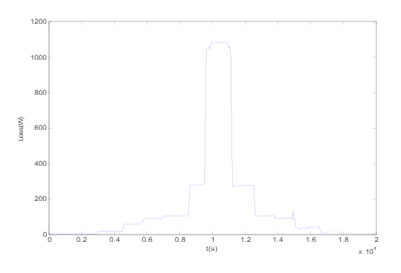
In this section, losses in a distribution feeder are simulated using the equations introduced in section 3. The schematic diagram of the simulated feeder shown in Figure 4 contains two impedances for the transmission lines (Z1 and Z2). Figure 7 shows the losses due to Z1 impedance for an office load and Figure 8 shows losses due to Z2 impedance when feeding residential, commercial and office loads. The peak value of the feeder loss is when all the appliances are on. Z1 and Z2 are considered resistive with values of 1 ohm. Total loss in Z1 and Z2 impedances for the simulated feeder is shown in Figure 9. As Figure 9 shows, the loss trend copes with the aggregated loads rms current. The total amount of losses in this sample feeder reaches maximum 1100 W. The amount of losses versus the total feeder load is plotted in Figure 10.
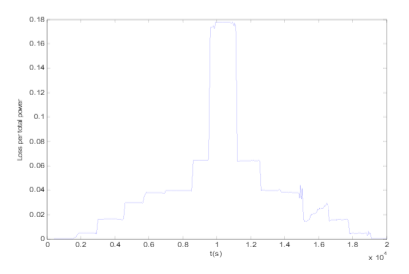
Losses due to transmission lines impedance for the simulated power network can be up to 18% of the total feeder power and this amount of loss means a considerable cost for distribution networks that can not be neglected. Share of nonlinear loads and their harmonics in causing loss of power in distribution networks could be obtained by the Eq 16. Based on the simulation results, the average Total Harmonic Distortion (THD) of the simulated power distribution feeder with the loads mentioned in Table 2, can be considered to be 50%, this means 20% of total loss is caused by harmonics in the simulated feeder.
10. CONCLUSIONS
In this paper, a comprehensive investigation has been done to determine the impacts of harmonic distortions on power system distribution networks. The study uses the Norton equivalent model of different appliances to model a distribution feeder. The individual models are obtained by analyzing loads measurement results.
Different load type models are found by aggregating the Norton equivalent model of their individual appliances. Two new indices are introduced to quantize the impact of each appliance in causing harmonic distortions in a distribution feeder. These indices consider not only the THD into account, but also the current rms value and the loads operation duration per day.
A distribution feeder is simulated using residential, commercial and office Norton load models. The losses in a transmission line are estimated, and the effect of harmonics on causing extra losses is discussed. The results are reasonably accurate, since the Norton equivalent models are precise and obtained based on the real world measurement results. The results show that the losses can be up to 18% of the feeder power usage while the share of harmonics in causing these losses is dependent to the THD of the feeder current.
Table 4. Loads Ranking Based On THDC Index
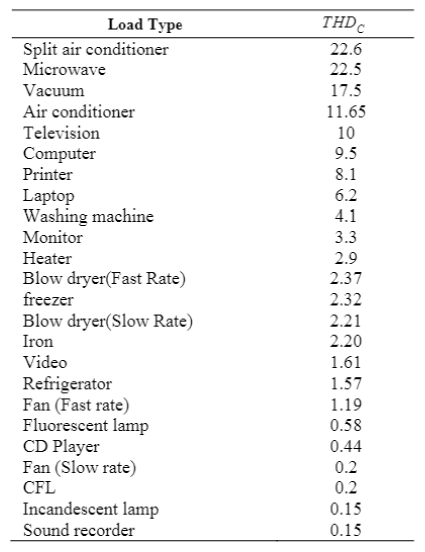
Table 5. Loads Ranking Based On THDST THDST Index
REFERENCES
[1] Hunter, I., “Power quality issues-a distribution company perspective”, Power Engineering Journal, Vol. 15, No. 2, 2001.
[2] M Shafiee Rad, M. Kazerooni, M. Jawad Ghorbany, H. Mokhtari, “Analysis of the grid harmonics and their impacts on distribution transformers”, 2012 IEEE Power and Energy Conference at Illinois (PECI), 2012.
[3] Thunberg, E. and Söder, L., “A Norton Approach to Distribution Network Modeling for Harmonic Studies”, IEEE Trans. Power Delivery, Vol.14, No.1, pp. 272-277, January, 1999.
[4] Thunberg, E. and Söder, L., “On the Performance of a Distribution Network Harmonic Norton Model”, ICHQP 2000, Florida, USA, 01-04 October, 2000.
[5] Abdelkader, S., Abdel-Rahman, M.H., “A Norton equivalent model for nonlinear loads”, LESCOPE conference, Halifax, Canada, July, 2001.
[6] F. H. Buller and C. A. Woodrow, “Load factor equivalent hour’s values compared,” Electric. World, Jul. 1928.
[7] H. F. Hoebel, “Cost of electric distribution losses,” Electr. Light and Power, Mar. 1959.
[8] M.W. Gustafson, J. S. Baylor, and S. S. Mulnix, “Equivalent hours loss factor revisited,” IEEE Trans. Power Syst., vol. 3, no. 4, pp. 1502–1507, Nov. 1988.
[9] M.W. Gustafson, “Demand, energy and marginal electric system losses,” IEEE Trans. Power App. Syst., vol. PAS-102, no. 9, pp. 3189–3195, Sep. 1983.
[10] M.W. Gustafson and J. S. Baylor, “Approximating the system losses equation,” IEEE Trans. Power Syst., vol. 4, no. 3, pp. 850–855, Aug. 1989.
[11] D. I. H. Sun, S. Abe, R. R. Shoults, M. S. Chen, P. Eichenberger, and D. Ferris, “Calculation of energy losses in a distribution system,” IEEE Trans. Power App. Syst., vol. PAS-99, no. 4, Jul./Aug. 1980.
[12] R. Céspedes, H. Durán, H. Hernández, and A. Rodríguez, “Assessment of electrical energy losses in the Colombian power system,” IEEE Trans. Power App. Syst., vol. PAS-102, no. 11, pp. 3509–3515, Nov. 1983.
[13] C. S. Chen, M. Y. Cho, and Y.W. Chen, “Development of simplified loss models for distribution system analysis,” IEEE Trans. Power Del., vol. 9, no. 3, pp. 1545–1551, Jul. 1994.
[14] O.M. Mikic, “Variance Based Energy Loss Comptation in LV Distribution Networks”. IEEE Trans. Power Syst., vol. 22, no. 1, pp. 179-187, Feb. 2007.
[15] C.S.Chen, C.H.Lin, “Development of Distribution Feeder Loss Models by Artificial Neural Networks”, IEEE Conference, 2005, Taiwan.
[16] Y.-Y. Hong and Z.-T. Chao, “Development of energy loss formula for distribution systems using FCN algorithm and cluster-wise fuzzy regression,” IEEE Trans. Power Del., vol. 17, no. 3, Jul. 2002.
[17] IEEE Standard Definitions for the Measurement of Electric Power Quantities Under Sinusoidal, Nonsinusoidal, Balanced, or Unbalanced Conditions,” IEEE Std 1459-2010, vol., no., pp.1,50, March 19, 2010.
[18 ]Balci, M.E., Ozturk, D., Karacasu, O., Hocaoglu, M.H., “Experimental Verification of Harmonic Load Models”, UPEC conference, Padova, September, 2008.
[19] Jing Yong, Liang Chen, Nassif, A.B., Wilsun Xu, “A Frequency-Domain Model for Compact Fluorescent Lamps”, IEEE Trans. Power Delivery, Vol.25, No.2, pp. 1182-1189, April, 2010.
[20] M.J.Ghorbani, H.Mokhtari,”Residential load modeling by Norton Equivalent Model of household loads”, APPEEC 2011, China, 2011
Corresponding Author: M. Jawad Ghorbani, Departement of Computer and Electrical Engineering, West Virginia University, Morgantown, WV, 26505, USA Email: mghorban@mix.wvu.edu
Source & Publisher Item Identifier: International Journal of Electrical and Computer Engineering (IJECE) Vol. 5, No. 1, February 2015, pp. 166~174 ISSN: 2088-8708
