Publishd by H. Mokhtari1, S. Hasani and M. Masoudi2, 1Associate Professor Department of Electrical Engineering, Sharif University of Technology, Azadi Ave., Tehran, Iran. Email: mokhtari@sharif.edu, 2Project Engineer and Management, West Azarbayjan Utility, Oroumieh, Iran. Email: sh592b@yahoo.com
Abstract ⎯ This paper presents the results of a power quality survey in a distribution system. More than fifty nodes are selected and monitored. Power quality indices are extracted based on IEEE and IEC Standards. The evaluation includes field data collection, extraction of statistical power quality indices and comparing the results against standard limits. Experimental data as well as clarifying tables and graphs are presented. The results are then discussed to evaluate the strength and weaknesses of applying standard limits when real observations are to be performed. Some proposals are also made in order to make standard procedures and limits more effective based on practical observations
Index Terms ⎯ power quality, standard limits, harmonic content, flicker, survey.
I. INTRODUCTION
Increase of nonlinear loads such as power-electronics devices and arc furnaces has generated Power Quality (PQ) pollution such as voltage/current harmonics and flicker at both industry and utility sides. The cost of low power quality has been estimated from tens of thousands to millions of dollars depending on the customer sensitivity and severity of power quality disturbances [1-3]. Therefore, it has become a necessary for engineers to 1) define PQ indices, 2) propose procedures of how to determine PQ at different locations, 3) specify PQ standard limits, and 4) take counter measure actions in order to reduce impacts of low PQ.
This paper summarizes the results of a power quality monitoring project carried out in West Azarbayjan Utility in north-west of Iran. More than 50 locations in the distribution system and low-voltage network have been monitored for a period of one-week and most PQ indices have been determined. The field data are statistically analyzed based on IEEE proposed procedure, and corresponding PQ indices have been determined. An overview of a typical distribution system in terms of PQ is given and proposals are made for mitigation of those where are out of standard limits. The paper brings up new concerns and issues in applying PQ standard limits and procedures and proposes practical tips for the future research in PQ surveys.
II. FIELD DATA
Fifty two nodes have selected from the power distribution and low-voltage network, and all power quality parameters are recorded over one-week using a power quality analyzer. The analyzer captures the time-series data with a sampling period of 12.8 Khz. The time interval is set to ten-minute. Severe transients have also been captured in the form of voltage and current waveforms.
III. POWER QUALITY PARAMETERS
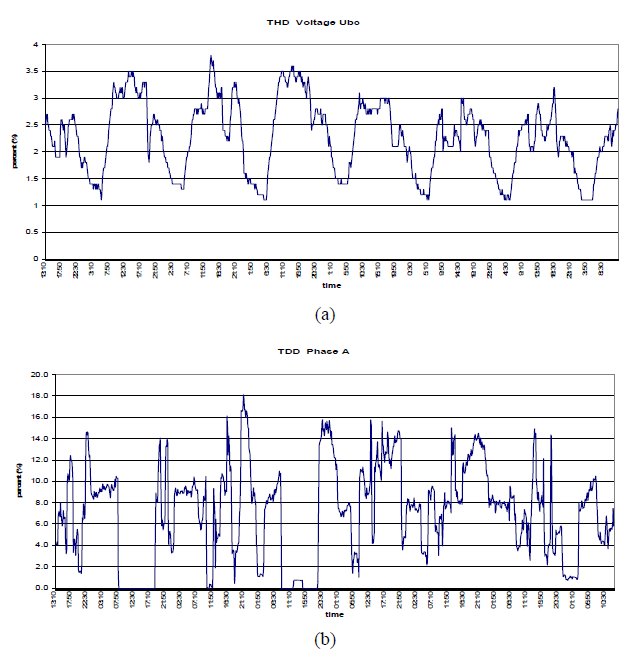
The power analyzer calculates voltage/current harmonic indices, voltage/current imbalance, voltage flicker, system frequency, and all power parameters for all three phases. Parameter calculation is done every cycle, and an average is taken over a 10 minute period. Fig. 1 shows a sample of the filed data for voltage and current THD in one of the test locations collected over one week. The test location is a 20 kV line which feeds a granite factory.
III. STATISTICAL ANALYSIS
For many PQ parameters, it is recommended that the Cumulative Probability (CP) of the captured data to be tabulated, and the value below which 95% of the measurement data lies is selected as the PQ index at the corresponding node [4]. This is called CP95% of that PQ parameter. This procedure is applied to all harmonic data as well as imbalance indices. Table 1 summarizes the results of statistical analysis of voltage THD in a granite factory.
TABLE I. Voltage THD analysis at a granite factory

IV. VOLTAGE RESULTS SUMMARY
In this section, the study results are summarized. Fig. 2 shows average, maximum, and minimum rms voltage measured at different locations.
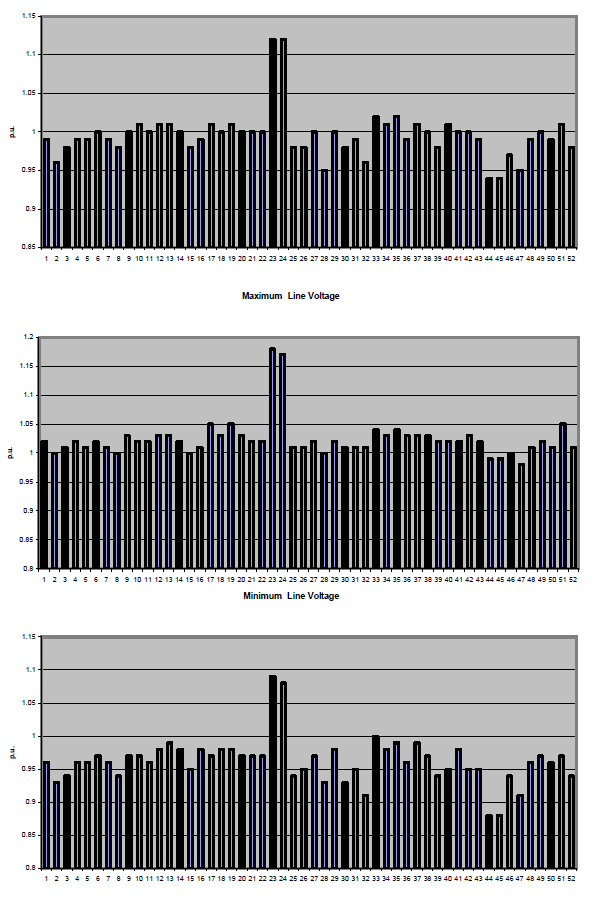
From Fig. 2, it can be seen that at 3.8% of the nodes in the distribution system, the maximum voltage level is beyond the maximum permissible 5% defined by the Iranian standard limits. At 25% of the locations, the minimum voltage is below the minimum permissible limit, i.e. 0.95 p.u..
Figs. 3 and 4 depict voltage THD and the 5th harmonic at the tested nodes respectively. The results are compared against IEEE 519 Std. limits [4].
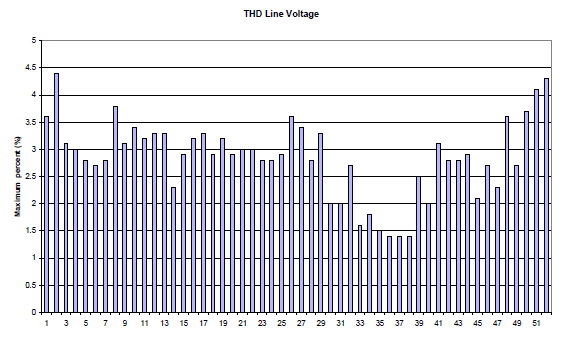

It can be seen that the distribution system is IEEE 519 compliant in terms of voltage THD. However, as Fig. 4 shows, the level of the 5th harmonic is higher than IEEE 519 standard at some nodes. At 38.5 % of the cases, the 5th harmonic is not complaint with the standard. The same procedure is carried out to determine other harmonics as well.
Flicker is the result of voltage fluctuation which is determined by the percentage of voltage change as well as its frequency. It is determined by short term and long term flicker, i.e. Pst and Plt, indices. The flicker level is compared against the level defined by IEC 61000-4-15 [5]. The power analyzer calculates only the Pst. Plt index is then calculated using the following equation:

Fig. 5 depicts the results for flicker determination. From Fig. 5, it can be concluded that the level of flicker is of no concern in the distribution system.
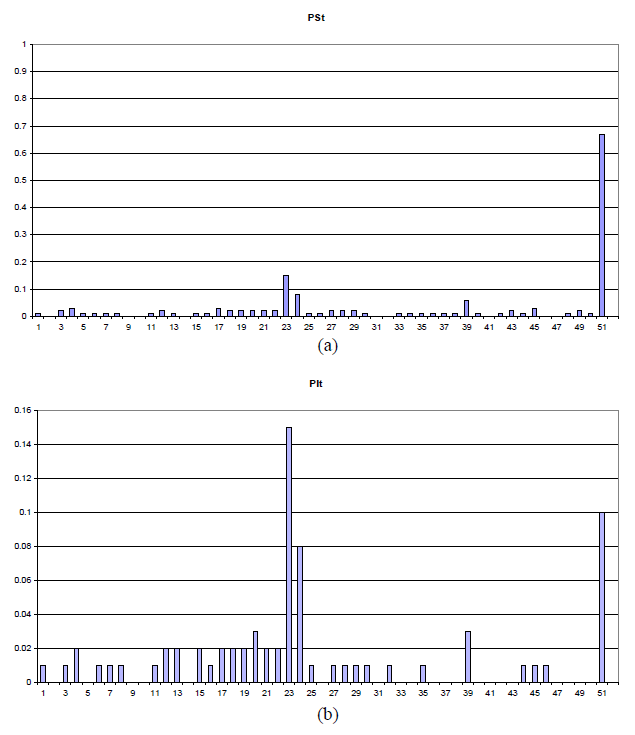
Fig. 6 shows the results of voltage imbalance in the distribution system. Based on IEEE 1159 Standard, the ratio of the negative sequence to the positive sequence is the imbalance ratio. To determine the imbalance index, the CP95 of the imbalance value calculated for each day, and the maximum CP95 is selected.
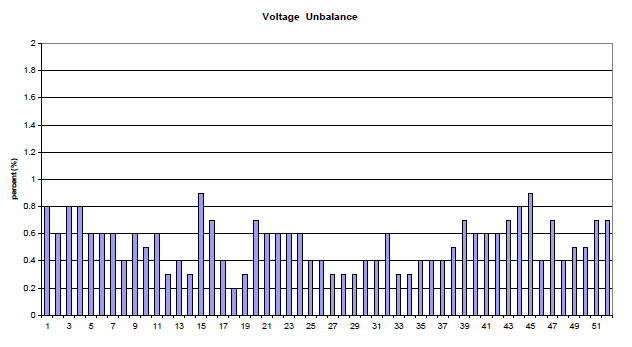
The maximum voltage imbalance was logged at node No. 15 which is 0.9. Since, the maximum permitted value is 2, therefore, the distribution system is fine with respect to voltage imbalance.
The other parameter which was investigated is the system frequency. Fig. 7 shows the maximum and minimum frequency at steady state operation. Based on Iranian standard, the maximum frequency deviation is 0.3 Hz. Therefore, at some moments, the system frequency drops below the minimum permissible threshold.

V. CURRENT RESULTS SUMMARY
In this section, the quality of load current is investigated. Fig. 8 shows the results of the current harmonic pollution level. As it can be seen from this figure, at 13.5% of the locations, the TDD is out of limit. The results correspond to the CP95 index of the TDD.

The analysis is extended to determine the pollution of load current in terms of individual harmonics. Fig. 9 depicts the results corresponding to the 3rd, 5th, 7th and 11th harmonics. The results indicate that the maximum pollution is related to the 5th harmonic. At 17.3% of the substations, at 20 kV, the 5th harmonic is beyond the permitted limit set by IEEE 519.
For the other harmonics, the results are as follows. At 1.9% of the locations, the 3rd and 7th harmonic are more than standard limits. At 11% of the locations, the 11th harmonic is out of standard limit.

Load power factor is also checked at the test locations. Fig. 10 shows the average power factor measured at the distribution transformer inputs. It can be seen that in most cases, the average power factor is acceptable.

VI. ANALYSIS OF THE RESULTS AND STANDARD LIMITATION
The PQ survey in the utility under study indicate that the voltage quality is mostly within acceptable limits except for the 5th harmonic. However, the current distortion may be of concern at some locations. This conclusion is based on the CP95 limit which has the following shortcomings:
• The CP95 index is silent about the operating condition. In some cases, e.g. at light load conditions, the THD and TDD values may become larger than expected.
• The CP95 does not directly reflect the effect of harmonic on devices, e.g. extra heat in magnetic systems.
• The results show that the number of cases in which the 5th voltage harmonic level is more than standard is higher than that of the 5th current harmonic. This implies that in some cases, the load is injecting standard level of harmonics into the distribution system, however, the level of the voltage harmonic is not standard.
• The CP95 of current cannot be easily related to the CP95 of the voltage signal.
VI. DISCUSSION AND CONCLUSIONS
This paper presents the PQ analysis in a utility system. The analysis is based on IEEE standard limits. The study shows that the growth of nonlinear loads is propagating into the utility distribution system gradually. The 5th harmonic is becoming a concern in terms of standard limits. This problem has to be mitigated at load sites by using proper compensating devices, e.g. harmonic filters. However, the existing procedures have to change in a way to relate the pollution to system malfunction and costs more directly. There are shortcomings associated with the existing procedures and limits when it comes to three-phase unbalanced and non-sinusoidal conditions. At the moment, the quality of voltage at 20kV distribution level is acceptable considering IEEE and IEC standards. However, this cannot be guaranteed if the rate of increase of non linear loads does not change or counter measure actions are not taken in order to prevent power quality problems to propagate from load sites into distribution and transmission systems.
V. REFERENCES
[1] D. Chapman, “The cost of poor power quality”, Copper Development Association, March 2001.
[2] G. W. Massey, “Estimation method for power system harmonic effect on power distribution transformer,” IEEE Transaction on Industry Applications, vol. 30, no. 2, pp. 485-489, 1994.
[3] G.T. Heydt, R. Ayyanar, R. Thallam, “Power Acceptability”, IEEE Power Engineering Review, 2001.
[4] Recommended Practices and Requirements for Harmonic Control in Electrical Power Systems, IEEE Standard 519-1992.
[5] Flicker meter-functional and design specification, IEC Standard 61000-4-15, 1997
VIII. BIOGRAPHIES
Hossein Mokhtari was born in 1969 in Tehran, Iran. He received his B.Sc. degree in electrical engineering from Tehran University, Tehran, Iran in 1989. He worked as a consultant engineer for Electric Power Research Center (EPRC) in Tehran in dispatching projects. In 1994, he received his M.A.Sc. degree from University of New Brunswick, Fredericton, N.B., Canada. He obtained his Ph.D. degree in electrical engineering from the University of Toronto in 1998. He is currently an associate professor at Sharif University of Technology, Tehran, Iran. His research interests include power quality and power electronics.
Sasan Hasani was born in July 1976 in Orumieh. He received his B.Sc. in electrical engineering from Shaihd Abbaspour University, Tehran, Iran. He is currently a project engineer working in transmission and distribution network division of West Azarbayjan Regional Electric Company, Orumieh, Iran.
Masoud Masoudi was born in April 1951 in Orumieh. He received his B.Sc. in electrical engineering from Iran University of Science and Technology, Tehran, Iran. He obtained his masters degree in management from Orumieh University, Orumieh, Iran. He is currently the head of Engineering Department of West Azarbayjan Regional Electric Company.
Source & Publisher Item Identifier: https://doi.org/10.24084/repqj05.316, RE&PQJ, Vol. 1, No.5, March 2007
