Published by Huilian Liao, Jovica V. Milanović, School of Electrical and Electronic Engineering, The University of Manchester, Manchester M60 1QD, UK E-mail: milanovic@manchester.ac.uk. IET Generation, Transmission & Distribution – Research Article
Abstract: This study investigates the impact of different flexible AC transmission system (FACTS) devices on critical power quality (PQ) phenomena including voltage sags, harmonics and unbalance from the perspective of both mitigation effect and potential negative impact. The FACTS devices, including static VAR compensator, static compensator (STATCOM) and dynamic voltage restorers, are modelled in commercially available software PowerFactory/DIgSILENT to study their impacts on the critical PQ phenomena. Two control strategies, voltage regulation and reactive power compensation, are considered for STATCOM. For DVR, a PI-controller is developed for the purpose of voltage sag mitigation. The merit of the proposed controller is presented by the dynamic response of during fault voltage and the capability of post-fault voltage recovery. The study is carried out on a large-scale generic distribution network. The impact of various devices on PQ phenomena is assessed using appropriate evaluation methodologies, and the results obtained with and without mitigation are presented and compared using heatmaps.
1. Introduction
Power quality (PQ) issues have attracted significant attention from both utilities and customers due to the substantial financial losses caused by inadequate PQ [1, 2]. Voltage sags, as one of the most critical PQ problems, have become a focal point for many researchers in the area of PQ in the past. This phenomenon causes frequent disruptions to industrial processes and malfunction of electronic equipment, consequently resulting in substantial financial loss to distribution network operators (DNOs) and end users [3, 4]. Voltage unbalance issues are also becoming more important as the penetration of single-phase distributed energy resources (generation and storage) grows continuously. This phenomenon imposes thermal aging/stress to power system equipment and user-connected devices, causes additional power/ energy loss in the network, and consequently reduces the efficiency of load and overall network [2, 5]. Apart from voltage sags and unbalance, harmonics phenomenon is also one of the main concerns in power networks, due to the increasing number of nonlinear loads, electric vehicles and power electronic interface connected distributed generators (DGs) and loads. Harmonics phenomenon causes thermal stress and losses to both power system’s and customers’ equipment. Besides, it increases the peak voltage resulting in thermal stress of insulation, i.e. reduced life time of the insulators, and the disruption of operation of sensitive loads. Its presence can also cause telephone interference (high harmonic orders in particular), mal-operation of protection devices and switchgears, problems in the metering and instrumentation and damage of capacitors and cables under resonance conditions [6].
A number of standards have been developed to specify the performance requirement and evaluation techniques with respect to various PQ phenomena. For instance, international standards IEEE 1346 [7] and IEEE 1564 [8] have been set up to provide guidelines for system/tool design in terms of ride-through capability to voltage sags. EN 50160 provides recommended levels for voltage characteristic in public distribution systems [9]. IEC 61000-4-30 provides measurement methods, accuracy levels, aggregation periods and evaluation techniques for unbalance phenomena [10]. IEEE 519 defines the harmonics performance allowed in the networks [11]. Violation of the standard specified thresholds could potentially result in heavy penalties imposed to DNOs. Thus, it is important to meet the requirements as specified. To ensure provision of appropriate PQ levels, various methodologies have been explored in the literature to mitigate PQ phenomena [12, 13]. Flexible AC transmission system (FACTS) devices are becoming more and more popular option for PQ mitigation in power systems, due to their undisputed mitigation capabilities and fast development of power electronic components resulting in decreasing cost of these devices. They have been reasonably and widely investigated in power systems for various purposes, e.g. restoring bus voltages locally or globally [14], enhancing transfer capability [15] and maximising power system load ability [16] etc. Due to their flexibility, FACTS devices have also been considered as promising solutions for mitigating PQ phenomena. Even though these devices are still relatively expensive, placing FACTS devices for PQ mitigation is potential and beneficial in the long run, as the financial benefits resulting from their installation will cover the investment, which has been proved in the past studies [17, 18]. So far, FACTS devices have been mainly studied for mitigating one particular PQ phenomenon [19–21]. However, generally the installation of these devices will also affect the performance of other PQ phenomena. Thus comprehensive investigation on the impact of FACTS devices on different PQ phenomena is still required.
In this paper, the impact of FACTS devices (including static VAR compensator, SVC; static compensator, STATCOM; dynamic voltage restorers, DVR) on critical PQ phenomena (including voltage sags, harmonics and unbalance phenomena) is comprehensively studied by modelling them in DIgSILENT. The control strategies of voltage regulation and reactive power compensation are considered for STATCOM. A proportional integral (PI)-based controller is developed for voltage sag compensation, and its capability of compensating during fault voltages and fast recovery of post-fault voltage are presented by comparing its dynamic voltage response with those obtained by STATCOM and SVC. The study is carried out on a large-scale generic distribution network (GDN). The simulation results demonstrate the strengths and weaknesses of various FACTS devices in terms of mitigating different PQ phenomena. This study provides useful reference to understand the impact of the installation of FACTS devices on PQ phenomena including those that were not originally targeted by the installed devices.
2. Modelling of FACTS devices
In the study, commercially available DIgSILENT/PowerFacotry software is used to model SVC, STATCOM and DVR and to perform all dynamic simulations.
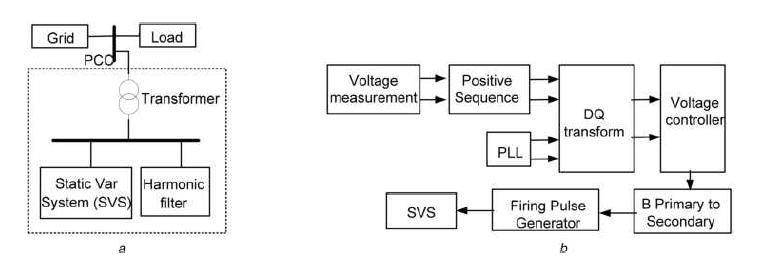
2.1 Static VAR compensator
SVC, as a shunt device, provides rapidly controllable reactive shunt compensation for dynamic voltage control through its utilisation of high-speed thyristor switching/controlled reactive devices. The model of SVC is given in Fig. 1. It consists of harmonic filter and a static var system which comprises thyristor controlled reactor (TCR), thyristor-switched capacitor (TSC) and mechanically switched capacitor. SVC regulates the voltage by controlling the reactive power generated into (via TSC) or absorbed from (via TCR) the power system. The TSC provides a ‘stepped’ response and the TCR provides a ‘smooth’ or continuously variable susceptance.
2.2 Static compensator
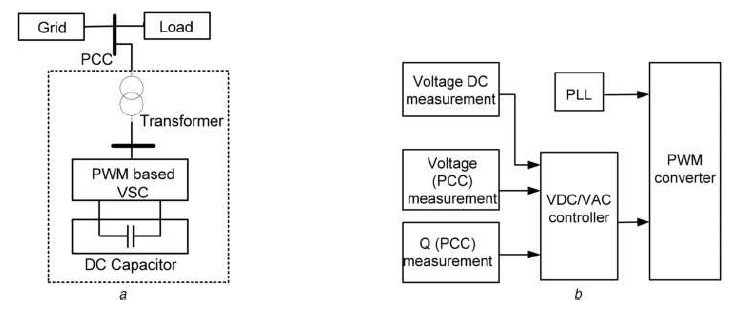
STATCOM, connected in shunt to the AC power system, regulates the voltage by adjusting the amount of reactive and active power transmitted between the power system and the voltage-sourced converter (VSC). The model of STATCOM is illustrated in Fig. 2, which mainly consists of a power transformer, a VSC on the secondary side of the transformer and a DC capacitor working as an energy storage device. The VSC provides a multifunctional topology which can be used for various purposes, e.g. voltage regulation and compensation of reactive power, correction of power factor and elimination of current harmonics [22]. In the study, the first two control strategies are investigated.
2.3 Dynamic voltage restorers
DVR, a device connected in series with the grid, is capable of protecting sensitive loads against the voltage variations or disturbances via a VSC that injects a dynamically controlled voltage in series with the supply voltage through transformers for correcting the load voltage. With proper control design, DVR can be used to mitigate key PQ disturbances like voltage sags [23].
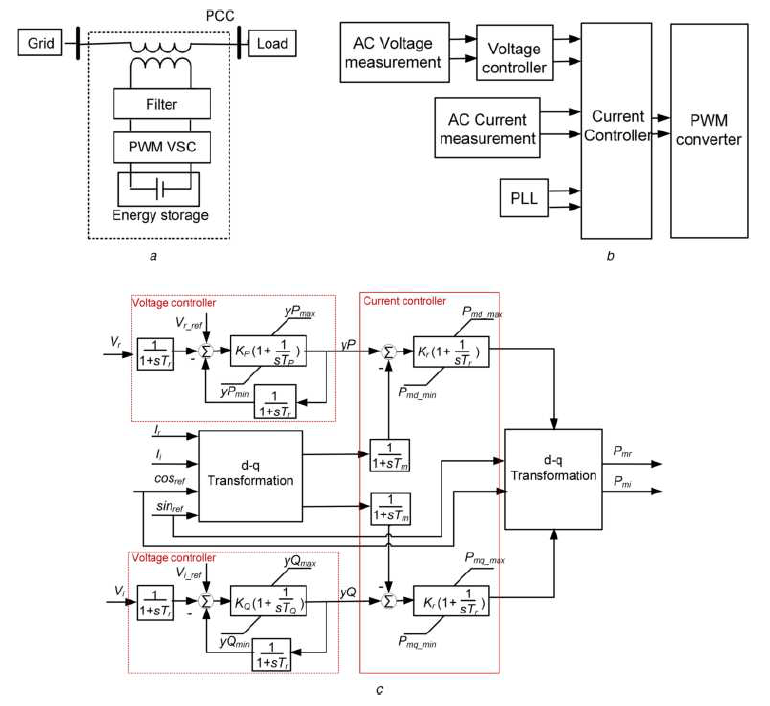
The modelling of DVR is given in Figs. 3a and b. In the study, a PI-based control strategy is developed for the purpose of voltage sag mitigation, as shown in Fig. 3c. The control structure consists of a PI-based current controller and a PI-based feedback voltage controller, together with a proper time-delay function. Pmr and Pmi, the signals coming from the controller, are modulation indices which will be used by PWM VSC to determine the real and imaginary parts of the voltage at AC-side, respectively, based on the following equations:
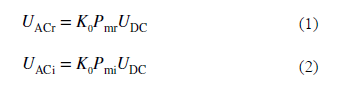
where K0 is a constant that depends on the modulation method applied in PWM, and UDC is the voltage at DC-side.
3. Evaluation methodologies
To evaluate the mitigation effect of FACTS devices on various critical PQ phenomena (including voltage sags, harmonics and unbalance), appropriate evaluation methodologies/indices should be applied to account for the factors of concern for each phenomenon. In the study, bus performance index (BPI) [24, 25] is adopted to evaluate the severity of voltage sag phenomena from the perspective of utilities and customers in distribution networks. This index takes into account various sag characteristics simultaneously as well as sensitivity of equipment to voltage sags. It accounts for sag magnitude, sag duration, sag occurrence frequency, the sensitivity of equipment to voltage sags, the uncertainty of voltage tolerance curve, the stochastic nature of load variation and the uncertainty of sag characteristics. It reflects, to a good approximation, the practical consequence of voltage sags from the point of view of system/equipment operation. With this index, voltage sag performance across the network can be assessed, and customer requirements can be evaluated.
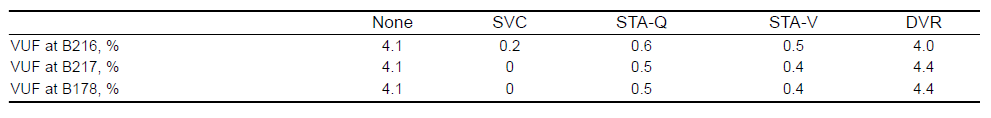
Voltage unbalance factor (VUF), defined as the ratio of negative to positive sequence voltage, is applied to assess the unbalance severity at buses [10].
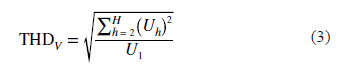
The performance of harmonics is characterised by the total voltage harmonic distortion defined as follows:
4. Mitigation capabilities of FACTS devices
The response of various devices to different PQ phenomena is mainly determined by control design. In this study, the controllers of FACTS devices are designed to achieve optimal performance for predefined/specific purposes, and the controller parameters are tuned to serve these purposes while at the same time taking into account the characteristic of the network they are connected to. In the study, SVC is equipped with unbalanced controller to mitigate unbalance; DVR is designed for voltage sag mitigation, with its series connected injection transformer responding to the detection of voltage sags; STATCOM-V (i.e. the STATCOM used for voltage regulation) is to maintain the voltage at nominal value; STATCOM-Q (i.e. the STATCOM used for reactive power compensation) is to compensate required reactive power in downstream branches. Three-phase converter with PWM is used to model DVR and STATCOM operation.
The impact of FACTS devices on various PQ phenomena is tested in a large-scale distribution network, 295-bus GDN, as shown in Fig. 4 [24, 26]. It comprises 275 kV transmission in feeds, 132 and 33 kV predominantly meshed sub-transmission networks, and 11 kV predominantly radial distribution network. The network consists of 276 lines including overhead lines and underground cables, 37 transformers with various winding connections, 297 loads (including ten unbalance loads) representing industrial, commercial and domestic loads, 26 DGs (including five wind turbines, nine fuel cells and 12 photovoltaic (PV) generators) connected to 11 kV distribution network. The locations of unbalanced loads and DGs are marked by different labels in Fig. 4. The wind generators were modelled as three-phase asynchronous generators of doubly fed induction generator (DFIG) type with max output of 0.6 p.u. based on their full capacity. The fuel cells were connected as single-phase static generators. As for 12 PVs, three PVs are connected as three-phase generators (to simulate larger PV installations), and the remaining nine as single phase.
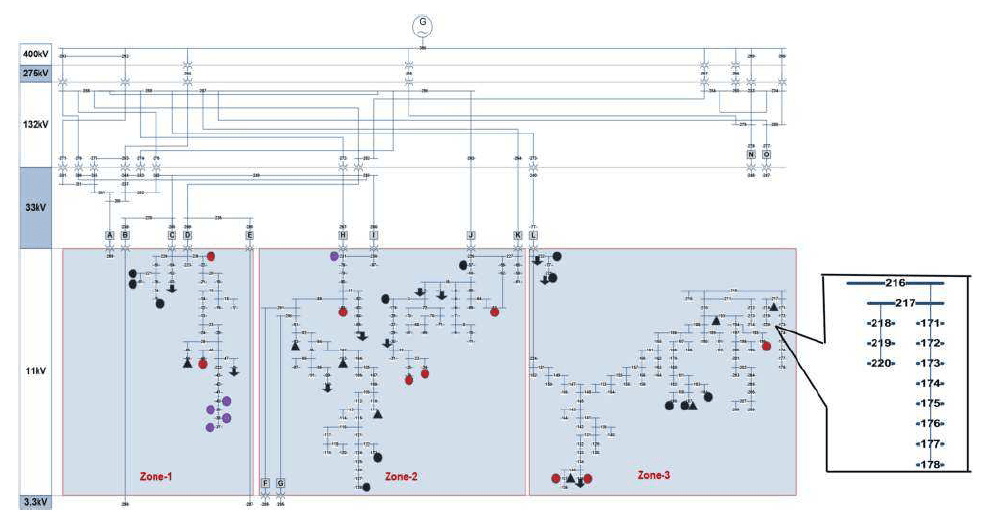
STATCOM and SVC devices are placed at bus 217, and DVR is connected in the line between buses 216 and 217. Although a DVR is typically used to provide customised power supply to an individual sensitive load (individual plant), the application here considers protecting a number of downstream sensitive loads from upstream voltage sags. For the convenience of comparison, only one representative operating point is used, and one device is activated at one time. In Fig. 4, the two downstream branches at bus 217 are denoted as feeders 1 and 2, respectively.
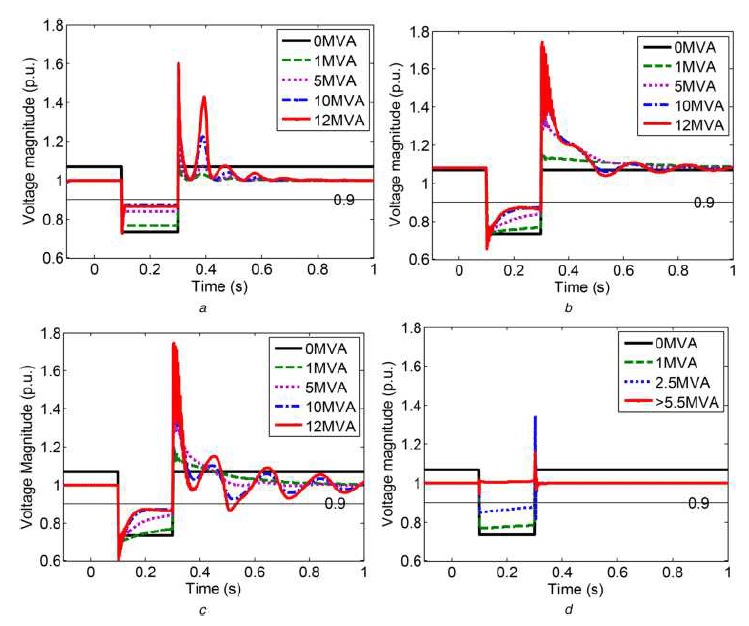
The compensation effect of various devices on voltage sag performance is studied by applying a fault at upstream bus. The dynamic response of voltage at bus 217 is given in Fig. 5. Without the connection of any FACTS device, the voltage at bus 217 is >1 p.u. With the connection of STATCOM-V, SVC or DVR, the pre-fault voltage is 1 p.u. When STATCOM-Q is connected, the pre-fault voltage is the same as that obtained without the connection of any device, as seen from Fig. 5b. Although STATCOM-Q and STATCOM-V perform similarly during fault, they present different capability of post-fault voltage recovery. During the post-fault period, the performance of STATCOM-Q and STATCOM-V is similar when the rating is small. However, as the rating increases, STATCOM-V results in more pronounced voltage oscillations compared to STATCOM-Q. SVC is generally used for fast voltage regulation and to improve voltage recovery after the fault clearing. In this case, the SVC improved voltage recovery performance when its rating was relatively small. The application of larger SVC, however, led to pronounced post-fault voltage oscillations as in its control design TSC is not blocked during severe voltage sags to prevent excessive transient voltage on fault recovery. It was observed that once the ratings of devices (SVC, STATCOM-Q and STATCOM-V) reached a certain value, the support they provide with respect to voltage sags performance reduces and even if their rating is further increased there is no improvement in performance. In this case, DVR provides much better voltage dynamic response at B217 compared to other devices. DVR, equipped with energy storage for sag compensation, is not only able to compensate the voltage up to 1 p.u. (given sufficient energy storage) but also able to recover the post-fault voltage fast and does not result in postfault voltage oscillation.
The mitigation effect of various FACTS devices on harmonics and unbalance phenomena is given in Tables 1 and 2, respectively. STATCOM-Q outperforms other FACTS devices in terms of harmonics mitigation, and SVC has the best performance in terms of unbalance mitigation.
Table 1. THD obtained with various FACTS devices
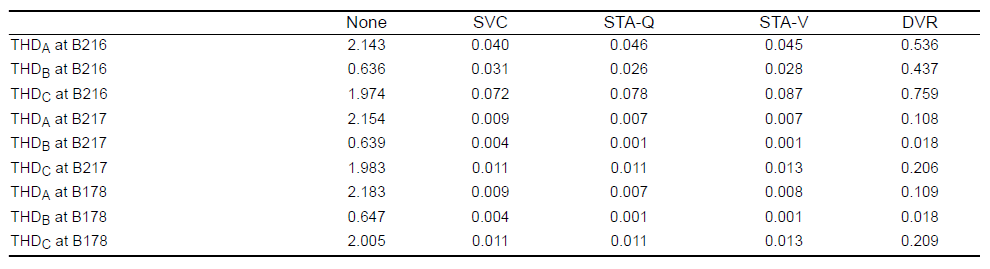
Table 2. VUF performance with various FACTS devices
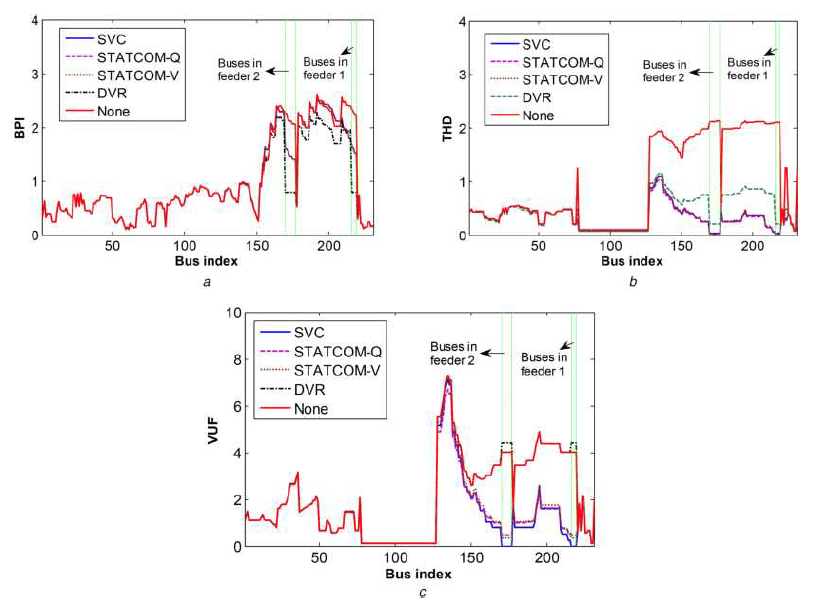
To see the influence of each device on its neighbouring buses, BPIs at all buses are given in Fig. 6a. SVC, STATCOM-Q and STATCOM-V have similar performance. DVR improves the sag performance at downstream buses significantly, i.e. the buses on feeders 1 and 2.
Harmonics performance at all buses due to the connection of various FACTS devices is presented in Fig. 6b. It can be seen that the performance of SVC, STATCOM-Q and STATCOM-V is similar. For DVR, the obtained total harmonic distortions (THDs) at the downstream buses are better than those at the upstream buses.
The unbalance performance at all buses with various FACTS devices is given in Fig. 6c. In this case, SVC outperforms other FACTS devices. When SVC is installed, the obtained VUFs at the buses which are close to the installation location are greatly improved. Between STATCOM-V and STATCOM-Q, the former provides better performance at the buses which are close to B217, while the latter provides better mitigation effect at the buses which are relatively further away from B217. DVR has minor impact on the upstream buses while causing slightly higher VUFs at the downstream buses.
5. Optimal placement of FACTS devices for mitigation of individual PQ phenomena across GDN
Instead of using only one operating point, a comprehensive simulation is performed on GDN based on probabilistic approaches. The simulation accounts for various uncertain factors in the network, e.g. the probability nature of the system fault statistics, the uncertainty of the fault clearing time and unbalance severity, and the variation of harmonic current injection. The variation of load profiles and network parameters are also taken into account to evaluate the sag performance more accurately. Annual hourly loading curves were extracted from 2010 survey of different types of loads (including commercial, industrial and residential loads), and 8760 operating points are obtained. Since there are different variation patterns for industrial load, commercial load, domestic load and PV outputs in terms of day and season, some operating conditions re-occur during the year. In the study, Cluster Evaluation of Statistics Toolbox in Matlab is used to find the representative operating conditions. With this approach, nine representative points are obtained. Additionally, seven more operating points are considered in the simulation, and these operating points are corresponding to the maximum load, the maximum DG output, the maximum wind output, the maximum PV output, the maximum industrial load, the maximum commercial load and the maximum domestic load. In total, there are 16 characteristic operating points taken into account. The PQ evaluation based on these 16 operating points is taken as the reference for the optimisation procedure which is applied to select the optimal set of FACTS devices for mitigating a specific PQ phenomenon.
Before applying the optimisation procedure, a pool of potential solutions, which consists of locations, types of devices and ratings, are made available initially for selection. Location of FACTS devices (in total 59), including SVC, STATCOM and DVR, are pre-selected based on PQ performance and the sensitivity of voltage variation at a bus due to the injection of active or reactive power. Passive filters (PFs) are also selected as the potential solution to harmonic phenomenon, as they have been, and are still being used to mitigate harmonic pollution for utilities or industrial installations. The buses exposed to severe THD and at the intersections of two relatively long branches (with more than three downstream buses) are made available for the placement of double tuned PF (tuned to compensate two harmonics with the largest magnitude at the specific location). In total, 77 devices (21 SVC, 21 STATCOM, 17 DVR and 18 PF) are made available initially for optimisation procedure. For each device the range of ratings is given, divided into 10 intervals, and a rating is selected by randomly generating a value within the interval.
Given the initial pool of devices, greedy optimisation algorithm is applied to select the optimal mitigation solution for each PQ phenomenon separately. The optimal device is selected among the available devices, and the number of devices is increased iteratively until the improvement of the corresponding PQ index becomes smaller than a given threshold (2% of the PQ index evaluated without mitigation). Based on this approach, the optimal mitigation solution is obtained for each PQ phenomenon. All simulations are carried out in DIgSILENT/PowerFactory software. Heatmaps are used to present the variation of PQ performance obtained without and with mitigation.
5.1 Mitigation of voltage sags
In this study, BPI is used to evaluate voltage sag performance. Faults are simulated throughout the network based on probabilistic methodology proposed [24]. The components at different voltage levels have different fault rates, and the detailed system fault statistics in the distribution network are given in Table 3 [24, 27, 28]. The mean and standard deviation of the distribution of fault clearing time are given in Table 4, together with the failure probability of primary protection relays.
Table 3. System fault statistic for components in GDN network
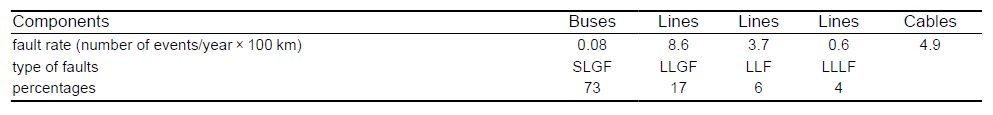
Table 4. Fault clearing time for primary and back-up bus and line protection relays
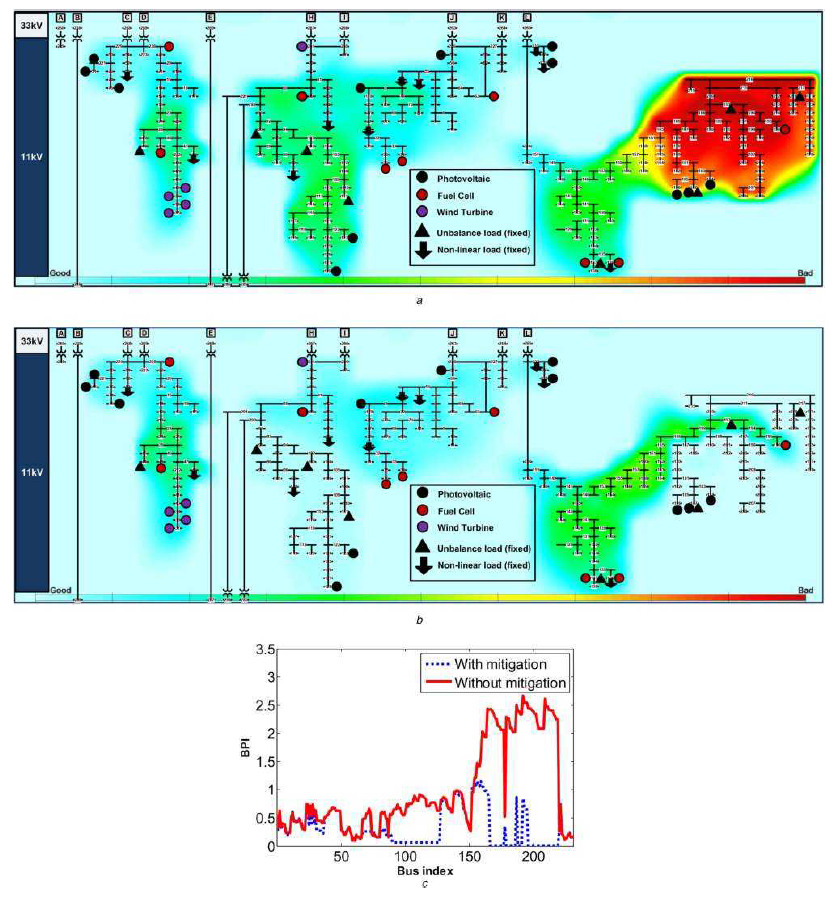
Based on the pool of potential mitigation devices, greedy optimisation algorithm is applied to select the optimal FACTS devices to mitigate voltage sags. The selected optimal solution will be discussed in Section 5.4. The heatmaps of BPIs obtained without and with the mitigation are given in Figs. 7a and b, in which the area exposed to severe sag disturbance is marked in red. It can be seen that the sag performance at the critical area is significantly improved by the placement of the optimal set of FACTS devices. To further observe the sag performance, BPIs at all buses are given in Fig. 7c. It can be seen that the peak of the solid red curve, which is corresponding to the critical area in Fig. 7a, is significantly reduced with the installation of the optimal mitigation solution.
5.2 Mitigation of unbalance
A number of loads are selected as potential sources of unbalance in the network. For these unbalance loads, the real power demand at each phase is set based on the true load profiles, while the reactive power is set based on power factors, which are generated randomly according to a pre-set normal distribution. In the study, 10 unbalance loads are applied. The mean of the normally distributed power factors is set to 0.95 which represents a general load [29], and the standard deviation is set to 0.053.
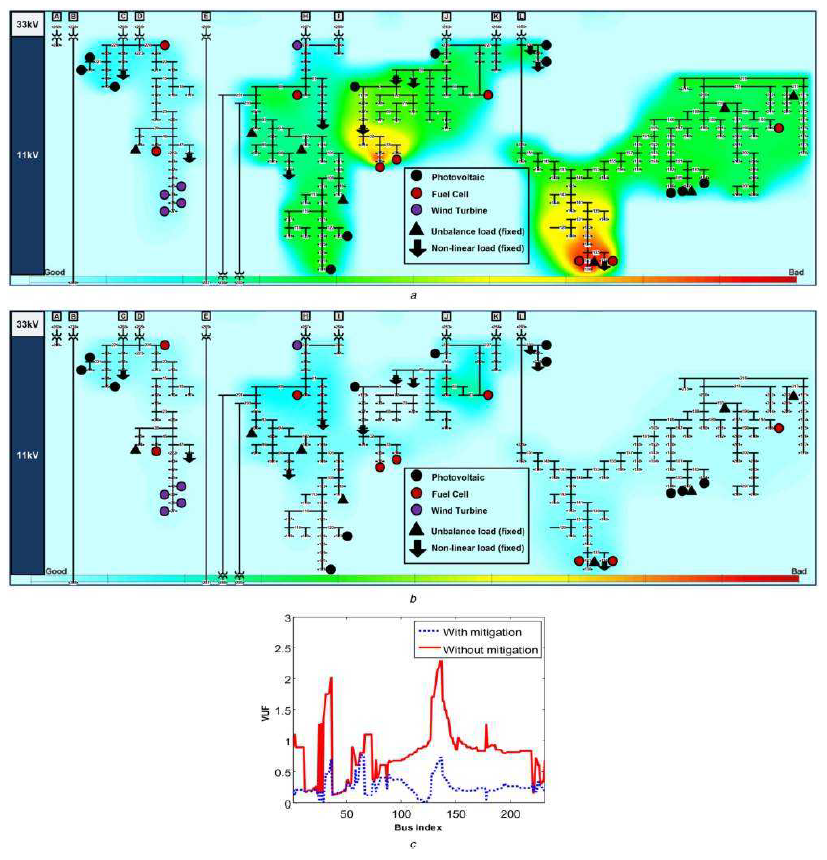
The optimal mitigation solution is obtained with the application of greedy algorithm optimisation procedure. The heatmaps of the VUFs obtained without and with mitigation are given in Figs. 8a and b, respectively. It can be seen from Fig. 8a that there are two areas suffering from unbalance, marked in red. The unbalance issues experienced in the two critical areas are eliminated with the installation of the obtained optimal mitigation solution, as shown in Fig. 8b. The VUFs at all buses are given in Fig. 8c, which shows that VUFs of all buses are improved to some extent with the application of mitigation solution.
5.3 Mitigation of harmonics
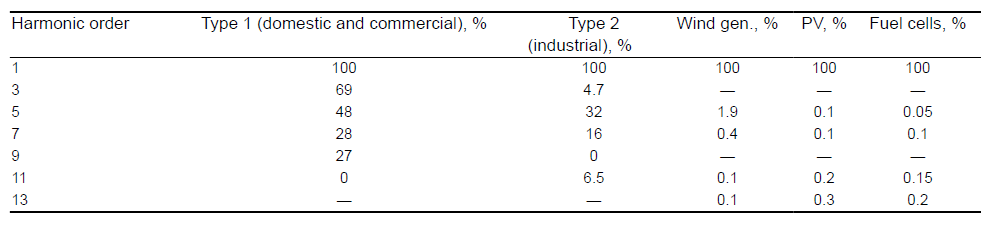
In the study, 30 loads in total are selected as non-linear loads. Ten of these are fixed non-linear loads, which inject harmonic current into the grid at fixed locations. Further 20 loads are randomly selected (their location varies with different operating points) from the rest of the load buses and taken as non-linear loads. The ratio of the magnitude of the injected harmonic current to that of the fundamental component follows pre-set normal distributions. Based on the types of the non-linear loads, the mean of the normal distribution varies, as given in Table 5. The harmonic current injection from DGs follows pre-set normal distributions as well, and the mean of the normal distribution is also given in Table 5 [30]. The standard deviation of the aforementioned normal distributions is set to 10% of the mean.
Table 5. Harmonic current spectra amplitude ranges of non-linear loads and DG
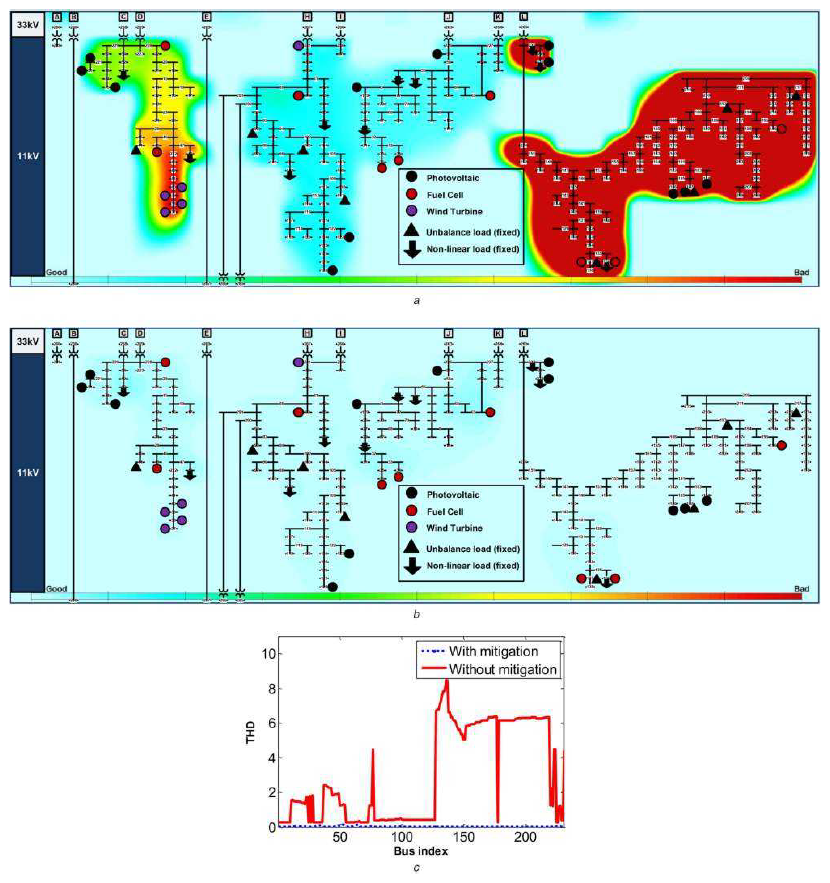
The heatmaps of THDs obtained without mitigation and with the optimal mitigation solution are provided in Figs. 9a and b, respectively. The THDs evaluated at all buses are provided in Fig. 9c. It can be seen that the harmonic performance is significantly improved with the installation of the optimal mitigation solution.
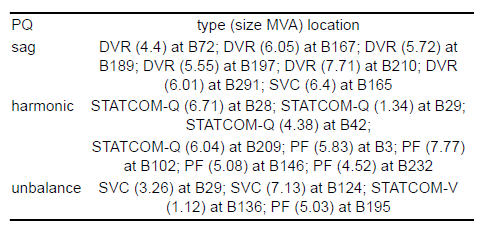
5.4 Comparison of optimal solutions for different phenomena
The optimal solutions for different PQ phenomena are listed in Table 6, which provides the type, size and installation location of the selected devices. The optimal solution obtained for sag mitigation consists of six DVR and one SVC, which confirms the preference of DVR for sag mitigation. For unbalance, the obtained optimal mitigation solution consists of four devices (two SVC, one STATCOM-V and one PF). It can be seen that the mitigation solution favours SVC, followed by STATCOM-V, which are in line with the results presented in Section 4. PF, working along with other active devices, can also contribute to compensation of reactive power and ultimately voltage regulation. As for harmonic, the obtained optimal set of mitigation devices consists of four FACTS devices (four STATCOM-Q) together with four properly placed PFs in the network. It can be seen that between STATCOMV and STATCOM-Q, the former has better performance in mitigating unbalance, and the latter performs better in mitigating harmonics. It should be mentioned though that due to their cost-effectiveness, the typical solution for harmonic mitigation is passive filters, rather than STATCOM. This paper however, focuses on providing a global picture with respect to the technical capability, impact and limitations that widely used FACTS devices offer in terms of mitigation of different PQ phenomena, hence PFs were not considered as part of this study.
Table 6. Optimal solutions for different PQ phenomena
6. Conclusion
This paper investigates both the mitigation effect and negative impact of FACTS devices (including SVC, STATCOM and DVR) on various PQ phenomena (voltage sags, harmonics and unbalance). The impact of varying the size of the devices and the selection of different control strategies for STATCOM are also studied. A PI-based controller, with properly designed time-delay function, is developed to control the voltage injected at the AC-side of DVR in PowerFactory/DIgSILENT. The DVR with the developed controller outperforms SVC and STATCOM in terms of mitigating voltage sag phenomena. It not only compensates during fault voltage as expected but also has the ability to recover voltage quickly without suffering from voltage oscillation as experienced by other devices. The study is carried out on a large-scale GDN. The strengths and weakness of each device are analysed and demonstrated in the paper. In the case of GDN, the optimal mitigation solution is obtained for each PQ phenomenon using greedy algorithm, and the PQ performance is greatly improved when the obtained optimal solutions are applied.
Acknowledgments – This work was supported by SuSTAINABLE project under Grant no. 308755.
References
[1] Chan, J.Y., Milanović, J.V., Delahunty, A.: ‘Risk-based assessment of financial losses due to voltage sag’, IEEE Trans. Power Del., 2011, 26, (2), pp. 492–500
[2] JWG CIGRE-CIRED C4.107: ‘Economic framework for power quality’ (2011), https://www.scribd.com/document/71715649/467-Economic-Framework-for-Power-Quality
[3] Bollen, M.H.J.: ‘Understanding power quality problems: voltage sags and interruptions’ (Wiley, New York, 2000)
[4] Chan, J.Y., Milanović, J.V., Delahunty, A.: ‘Generic failure-risk assessment of industrial processes due to voltage sags’, IEEE Trans. Power Del., 2009, 24, (4), pp. 2405–2414
[5] Woolley, N.C., Milanović, J.V.: ‘Statistical estimation of the source and level of voltage unbalance in distribution networks’, IEEE Trans. Power Del., 2012, 27, (3), pp. 1450–1460
[6] Wakileh, G.J.: ‘Power systems harmonics fundamentals, analysis and filter design’ (Springer, New York, 2001)
[7] IEEE Std 1346–1998: ‘IEEE recommended practice for evaluating electric power system compatibility with electronic process equipment’ (1998), http://ieeexplore.ieee.org/document/694188/
[8] IEEE Std 1564-2014: ‘IEEE guide for voltage sag indices’ (2014), http://ieeexplore.ieee.org/document/6842577/
[9] EN 50160: ‘Voltage disturbances standard EN 50160 – voltage characteristics in public distribution systems’ (2004), https://www.scribd.com/document/50699770/Standard-EN50160
[10] IEC 61000-4-30:2003: ‘Testing and measurement techniques – Power quality measurement methods’ (2003), http://www.iecee.org/dyn/www/f?p=106:49:0::::FSP_STD_ID:18768
[11] IEEE Std 519-1992: ‘IEEE recommended practices and requirements for harmonic control in electrical power systems’ (1993), http://ieeexplore.ieee.org/document/6826459/
[12] More, T.G., Asabe, P.R.: ‘Power quality issues and it’s mitigation techniques’, Int. J. Eng. Res. Appl., 2014, 4, (4), pp. 170–177
[13] Chan, J.Y.: ‘Framework for assessment of economic feasibility of voltage sag mitigation solutions’. PhD thesis, Department of Electrical and Electronic Engineering, University of Manchester, Manchester, UK, 2010
[14] Masdi, H., Mariun, N., Mahmud, S., et al.: ‘Design of a prototype DSTATCOM for voltage sag mitigation’. Proc. National Power and Energy Conf., Kuala Lumpur, Malaysia, 2004, pp. 61–66
[15] Xiao, Y., Song, Y.H., Liu, C.C., et al.: ‘Available transfer capability enhancement using FACTS devices’, IEEE Trans. Power Syst., 2003, 18, (1), pp. 305–312
[16] Ghahremani, E., Kamwa, I.: ‘Optimal placement of multiple-type FACTS devices to maximize power system loadability using a generic graphical user interface’, IEEE Trans. Power Syst., 2013, 28, (2), pp. 764–778
[17] Milanović, J.V., Yan, Z.: ‘Global minimization of financial losses due to voltage sags with FACTS based devices’, IEEE Trans. Power Del., 2010, 25, (1), pp. 298–306
[18] Alhasawi, F.B., Milanović, J.V.: ‘Techno-economic contribution of FACTS devices to the operation of power systems with high level of wind power integration’, IEEE Trans. Power Syst., 2012, 27, (3), pp. 1414–1421
[19] Milanović, J.V., Zhang, Y.: ‘Modeling of FACTS devices for voltage sag mitigation studies in large power systems’, IEEE Trans. Power Del., 2010, 25, (4), pp. 3044–3052
[20] Zhang, Y., Milanović, J.V.: ‘Global voltage sag mitigation with FACTS-based devices’, IEEE Trans. Power Del., 2010, 25, (4), pp. 2842–2850
[21] Grunbaum, R.: ‘FACTS for voltage control and power quality improvement in distribution grids’. Proc. CIRED Semi. Smart Grids for Dist., 2008, pp. 1–4
[22] Hatami, H., Shahnia, F., Pashaei, A., et al.: ‘Investigation on D-STATCOM and DVR operation for voltage control in distribution networks with a new control strategy’. Proc. IEEE Lau. Power Tech., 2007, pp. 2207–2212
[23] Asati, R., Kulkarni, N.R.: ‘A review on the control strategies used for DSTATCOM and DVR’, Int. J. Electr., Electron. Comp. Eng., 2013, 2, (1), pp. 59–64
[24] Liao, H.L., Abdelrahman, S., Guo, Y., et al.: ‘Identification of weak areas of power network based on exposure to voltage sags—Part II: assessment of network performance using sag severity index’, IEEE Trans. Power Del., 2015, 30, (6), pp. 2401–2409
[25] Liao, H.L., Abdelrahman, S., Milanović, J.V.: ‘Identification of weak areas of power network based on exposure to voltage sags—part I: development of sag severity index for single-event characterization’, IEEE Trans. Power Del., 2014, 30, (6), pp. 2392–2400
[26] Zhang, Y., Milanović, J.V.: ‘Voltage sag cost reduction with optimally placed FACTS devices’. Proc. International Conf. on Electrical Power Quality and Utilisation, 2007, pp. 1–6
[27] Milanović, J.V., Gupta, C.P.: ‘Probabilistic assessment of financial losses due to interruptions and voltage sags – part I: the methodology’, IEEE Trans. Power Del., 2006, 21, (2), pp. 918–924
[28] Milanović, J.V., Gupta, C.P.: ‘Probabilistic assessment of financial losses due to interruptions and voltage sags – part II: practical implementation’, IEEE Trans. Power Del., 2006, 21, (2), pp. 925–932
[29] Liu, Z., Milanović, J.V.: ‘Probabilistic estimation of voltage unbalance in MV distribution networks with unbalanced load’, IEEE Trans. Power Del., 2015, 30, (2), pp. 693–703
[30] Abdelrahman, S., Liao, H.L., Yu, J., et al.: ‘Probabilistic assessment of the impact of distributed generation and non-linear load on harmonic propagation in power systems’. Proc. 18th Power Systems Computation Conf., Wroclaw, Poland, 2014
Source & Publisher Item Identifier: IET Gener. Transm. Distrib., 2017, Vol. 11 Iss. 5, pp. 1202-1211. doi: 10.1049/iet-gtd.2016.1017
