Published by Fawaz S. Abdulla1, Ali N. Hamoodi2, Abdulaziz M. Kheder3, Northern Technical University, Engineering Technical College of Mosul, Mosul, Iraq. ORCID. 1. 0000-0002-6888-0580, 2. /000-0003-0991-3538, 3. 0000-0003-2606-4697
Abstract. Conventional maximum power point tracking (MPPT) has several demits such as steady-state oscillation and the inability to distinguish between multipacks generated under partial shading conditions (PSC). This paper studies the compression between the conventional Perturb and Observe (P&O) algorithm and the Particle Swarm Optimization ( PSO) algorithm to track global peak (GP) . Matlab Simulink carried out under PSC, the result shows that the PSO algorithm is successful to capture GP with 98.6% efficiency and the P&O algorithm is failed to capture the GP.
Streszczenie. Konwencjonalne śledzenie punktu maksymalnej mocy (MPPT) ma kilka wad, takich jak oscylacja stanu ustalonego i niemożność rozróżnienia opakowań zbiorczych generowanych w warunkach częściowego zacienienia (PSC). Ten artykuł bada kompresję pomiędzy konwencjonalnym algorytmem Perturb and Observe (P&O) a algorytmem Particle Swarm Optimization (PSO) w celu śledzenia globalnego piku (GP). Matlab Simulink przeprowadzony w ramach PSC, wynik pokazuje, że algorytm PSO z powodzeniem wychwytuje GP z wydajnością 98,6%, a algorytm P&O nie jest w stanie wychwycić GP. (Algorytm optymalizacji roju cząstek dla systemu fotowoltaicznego w warunkach częściowego zacienienia)
Keywords: particle swarm optimization (PSO), maximum power point (MPPT), photovoltaic (PV), partial shading condition (PSC).
Słowa kluczowe: algorytm rojowy, system fotowoltaiczny,
Introduction
Renewable energy represents the energy of future, especially with use advance control system. solar energy system considered as very important option for electricity generation[1, 2]. Furthermore, World energy consumption rises nearly 50% by 2050 [3]. Besides the fossil fuel depletion and increases pollution, all these challenges tend to focus on alternate energy resources. Solar energy is the most interesting option to fill this gap between generation and demand. It is a freely abundant, sustainable and clean energy source without environmentally negative effects. The power harvested from the PV module is non-linear and has a unique maximum power point (MPP), which is depends on the solar irradiance and ambient temperature. This state will be more complex when a PV power system operate under PSC. In such case a PV modules received non-uniform irradiance. Hence the P-V characteristic curve has multiple peaks. Several local peaks(LP) and one of them is the GP. The conventional MPPTs especially P&O algorithm and Incremental conductance algorithm are unable to distinguish between them and fail to capture GP.
Recently, numerous MPPT algorithms were carried out to track GP regardless of environmental condition changes such as particle swarm optimization (PSO), anti-colony, bee colony, and gray wolf optimization. Because the PV power losses under PSC may be greater than 70% of the generated power [4].
1. PV equivalent circuit
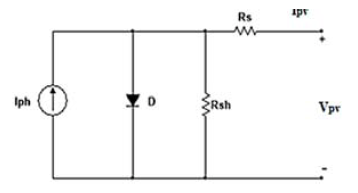
PV cells represent the main component of the PV power system, which is made by two or more wafers of doping Silicon. One cell is generated a small amount of power, about one watt[5], this value insufficient to load requirement. A group of solar cells are blocked together in parallel and series via grid collector busbar to get desired power value and this block is called a PV module. Also, a number of PV modules are arranged in series to constitute a string and increase the voltage to the desired level. A group of strings connected in parallel to form an array and enhance the output current. In the night, the solar cell is not active and act as a P-N junction diode[6]. Depending on the Shockley diode equation, the single diode model represents the simplest and more common PV model [7]. The model is used to describe the output characteristics curves. Fig.(1) represent the single diode modelling of PV cell, which consists of parallel connection between diode and current source with shunt, and series resistors. The diode represents the effect of the P-N junction of the PV cell. The series resistance is used to describe the internal losses of one PV cell and adjacent PV cells connected to it and shunt resistance to show the effect of ground leakage current.
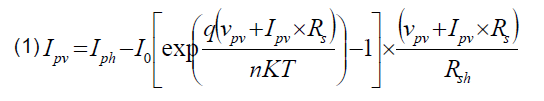
where: Ipv – Photovoltaic output current of a module, Iph – photo generated current, Io – saturation current, ID – Diode current, Q –Electron charge (1.6×10⁻¹⁹ C), Vpv – Output voltage of PV module, Rs – Series resistance, Rsh – Shunt resistance, n – Ideality factor, K – Boltzmann’s constant (13.8×10⁻²³ J/k).
2. Characteristics of PV module
The output curves of 350W half-cut PV module are obtained under standard test conditions (STC) (G=1000 W/m2, T=25oC, AM=1.5) where: G – solar irradiance, T – ambient temperature, AM – Air mass Fig.2 represents the (I-V) and (P-V) characteristic curves of PV module The characteristic curves have three important points used to explain the electrical behave of the PV module.
The first is short circuit points, which are obtained when the output terminals of the PV module are shorted and the output current is called Ish. The second is the open circuit point if output terminals of the PV module are opened and the terminal voltage called Voc. The third point is MPP, the maximum operating point of the PV module. At this point, the output current is called IMPP and the voltage is VMPP. The PV module should be operated at MPP to extract maximum from the PV module – where: Ish – Short circuit current of PV module, Voc – open circuit voltage of PV module, IMPP – PV module current at MPP, VMPP – PV module voltage at MPP.

3. The effect of partial shading
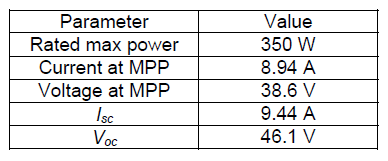
Normally, the PV power system outdoor installed, this means it is exhibited to external circumstances. PSC is one of the challenging effects on PV system performance. In this case, the PV power system is composed of four PV modules arranged in series; each one of them received a different irradiance level due to cloud movements, trees, buildings, or manufacturing mismatch. The shaded PV cells act as a load more than an energy source and the current of adjacent cells pass through it, lead to generating the hot spot on shaded cells. To protect PV cells from a hot spot, a group of PV cells connected to bypass diodes in parallel. Under uniform irradiance the bypass diode inactive, but under PSC the bypass diode active and allow to the current passing through it. Half-cut PV module technology is used to reduce PSC power losses via cutting PV modules into two parts: upper and lower. Each module has double numbers of cells. If one part is shaded, the bypass diode of an affected part will act, but the not shaded part still generates electrical power. The PV module can save about 50% power in the case of PSC [8]. The parameters of KDP350 PV module are given in table1.


Fig.3. represents the simulation of PV modules under PSC. Local and global peaks under PSC are shown in Fig.4.
Table 1. KD-P350 PV module parameters
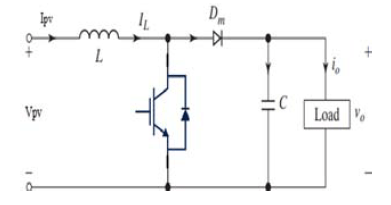
4. Boost converter
The MPPT circuit consists of a boost converter connected between PV array and load to regulate the DC voltage and current to the optimal value. Because low energy conversion of a PV system, the adoption of MPPT becomes more necessary for maintain the operation point at MPPT. A circuit diagram of boost converter illustrated in fig.5 which is contains an IGBT, diode, passive inductance and capacitance, and resistive load. The operation of the boost converter can be described into two modes. The first mode starts when the IGBT switched-on for period Ton. The input inductor current rises from L1 to L2 [9]. At the same time, the boost capacitor discharged and provide output current to the load. The second mode starts when the IGBT switched-off and the inductor stored energy in the previous mode are discharged through the diode.
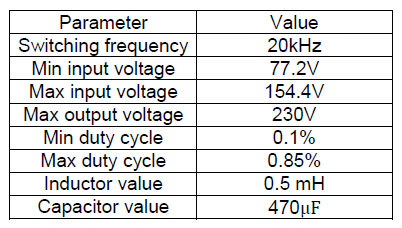
The converter parameters illustrated in table 2.
Table 2. The boost converter parameters

5. Perturb and observe algorithm
Most commonly used in PV systems to drive DC/DC converter with certain duty cycle for maintaining the operation point at MPP. The advantages of this method that simple, easy to implement, and low cost. The basic concept of P&O is that perturb the output voltage by a small magnitude and observes the change of output power after each amount. If ΔP is positive, still raise the output voltage of DC-DC converter in the same direction and get more convergence to MPP. Else if, ΔP is negative we are going in the divergence of MPP and should decrease the value of output voltage. The main drawbacks of this method are oscillation around MPP and inaccurate tracking under PSC. Fig.6 illustrates the algorithm of P&O method – where: ΔP – the MPPT output power change


6. Particle swarm optimization
PSO is a Meta-heuristic algorithm introduced by (James Kenndy and Russell Eberhart in 1995) to optimize nonlinear and multidimensional problems [10]. This method was inspired by simulating the community behaves of fishes schooling and birds flocking [10]. The basic strategy of PSO is that each particle moves in search space to find the optimum solution. PSO optimization depends on two main equations of velocity and position.

where: xik – previous position of particle, x(k+1) – updated position after each iteration, vik – previous velocity of particle, vi(k+1) – updated velocity after each iteration, xibest – personal experience of each particle, Xgbest – social experience of whole swarm, w – the inertia weight, C1 and C2 – acceleration coefficients, r1 and r2 – random numbers between [0 ,1]
7. Modeling the circuit diagram
The circuit diagram consists of four PV modules connected as the string to raise the output voltage at the desired value. Each PV module in the string received a different irradiance level, the incident irradiance on the first PV module is 500W/m2, the second one received 800W/m2, the third and fourth PV modules received the same value of solar irradiance which is equal 1000W/m2. For obtained maximum energy from the sun, the PV module connected to the MPPT to capture MPP and extract the maximum power available under PSC. Fig.8 illustrate the circuit design with two algorithms, PSO and P&O.
8. Simulation results
In this PV system two MPPTs, PSO and P&O are examined under PSC. The PV array is four 350W polycrystalline half-cut PV modules connected in series for reached output voltage and power to the desired value. VMPP and IMPP of PV array under STC are (154.4V, 8.94A) sequentially. Under PSC (P-V) curve have three peaks, one of them is GP located between two LPs. As mentioned in fig.4, the power at GP is equal to 890W, the first LP is 680W and the second LP is 790W. The prime goal of PSO based MPPT is to distinguish between multi-peaks generated under PSC and maintain the operation point at GP.
8.1 P&O algorithm
Fig.9 represents the relationship between the voltages before and after boosting with respect to time.
Fig.10 represents the relationship between the currents before and after boosting with respect to time. Fig.11 represents the relationship between the output power of P&O MPPT with time.
8.2 PSO algorithm
Fig.12 Represent the relationship between the voltages before and after boosting with respect to time. Fig.13 represents the relationship between the input and output current of PSO MPPT. There is an oscillation in the input current due to PSC effect and the boost circuit regulate it. Fig.14 represents the relationship between the PSO MPPT output power after boosting with time.
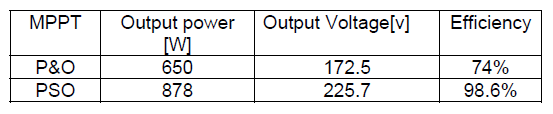
Table 2. Represents the obtained results for two algorithms ( PSO and P&O).
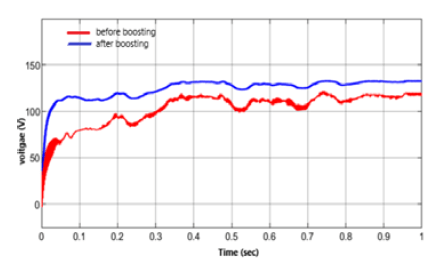

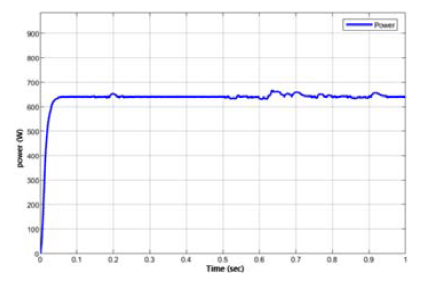
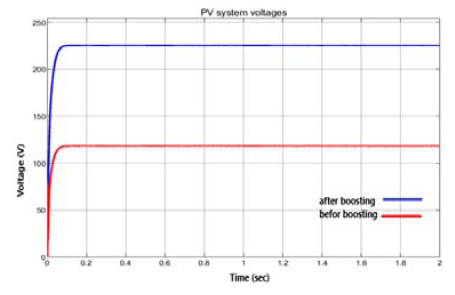

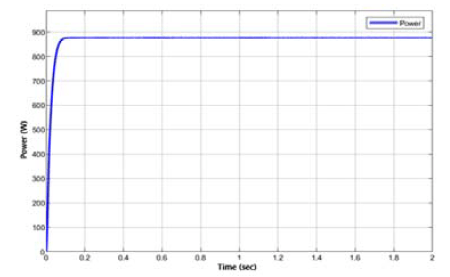
Table 3. obtained resultant
9. Conclusions
The influence of PSC on PV staring performance is examined and analyzed via two MPPTs under the same circumstances. The Simulink results indicated above, which are show the output power extracted from PV string, when using P&O MPPT is equal to 650W. But when we use PSO MPPT the output extracted power is 877.9W. The PSO algorithm is stable, accurate, and provides constant maximum output power with high efficiency whatever conditions change. On the other hand, the P&O MPPT has high steady-state fluctuation around MPP and poor performance under PSC.
REFERENCES
[1] ashif Ishaque, et al., A Direct Control Based Maximum Power Point Tracking Method for Photovoltaic System Under partial Shading Conditions using Particle Swarm Optimization algorithm, Applied Energy 99 (2012): 414-422.
[2] Ali M. Eltamaly, et al., Photovoltaic Maximum Power Point Tracking Under Dynamic Partial Shading Changes by Novel Adaptive Particle Swarm Optimization Strategy, Transactions of the Institute of Measurement and Control 42.1 (2020): 104-115.
[3] Outlook, Annual Energy. , U.S. Energy information administration, Department of Energy (2020).
[4] Eltamaly, Ali M., and Almoataz Y. Abdelaziz, eds, Modern Maximum Power Point Tracking Techniques for Photovoltaic Energy Systems. Springer, 2019.
[5] Teo, Kenneth Tze Kin, et al., Maximum Power Point Tracking of Partially Shaded Photovoltaic Arrays using Particle Swarm Optimization, 2014 4th International Conference on Artificial Intelligence with Applications in Engineering and Technology. IEEE, 2014.
[6] Mahdi, A. J., et al., Improvement of a MPPT Algorithm for PV Systems and its Experimental Validation, International Conference on Renewable Energies and Power Quality. Vol.25. 2010.
[7] González-Longatt, Francisco M. ,Model of Photovoltaic Module in Matlab, i Cibelec 2005 (2005): 1-5.
[8] Joshi, Arati, Afrah Khan, and S. P. Afra., Comparison of Half Cut Solar Cells with Standard Solar Cells, 2019 Advances in Science and Engineering Technology International Conferences (ASET). IEEE, 2019.
[9] Abouelela, Mohamed, Power Electronics for Practical Implementation of PV MPPT, Modern Maximum Power Point Tracking Techniques for Photovoltaic Energy Systems, Springer, Cham, 2020. 65-105.
[10] Kennedy, James, and Russell Eberhart. Particle Swarm Optimization, Proceedings of ICNN’95-international conference on neural networks. Vol. 4. IEEE, 1995.
Source & Publisher Item Identifier: PRZEGLĄD ELEKTROTECHNICZNY, ISSN 0033-2097, R. 97 NR 10/2021. doi:10.15199/48.2021.10.17
