Published by Dariusz KURZ1, Ryszard NAWROWSKI2, Szczepan KAŁUŻA3, Politechnika Poznańska, Instytut Elektrotechniki i Elektroniki Przemysłowej (1)
ORCID: 1. 0000-0002-6737-0052; 2.0000-0003-0974-2935
Abstract. The paper presents the research on the influence of the connection configuration and the location of the PV cells shading on the output parameters of photovoltaic roof tiles. The problem of shading occurs in all photovoltaic installations, but in the case of solar tiles it can cause much greater power losses than in the case of traditional panels. The series, parallel and series-parallel configurations of photovoltaic roof tiles with different shading locations were tested. The values of roof tiles output parameters, current-voltage and power characteristics of the analyzed systems were presented.
Streszczenie. W pracy przedstawiono badania wpływu konfiguracji połączeń oraz lokalizacji zacienienia ogniw PV na parametry wyjściowe dachówek fotowoltaicznych. Problem zacienienia występuje we wszystkich instalacjach z fotowoltaicznymi, jednak w przypadku dachówek solarnych może on powodować znacznie większe straty mocy niż w przypadku tradycyjnych paneli. Przebadano konfiguracje szeregową, równoległą oraz szeregowo-równoległą dachówek fotowoltaicznym z różnymi miejscami wystąpienia zacienień. Przedstawiono wartości parametrów wyjściowych dachówek, charakterystyki prądowo-napięciowe oraz mocowe analizowanych układów. (Analiza zamiany parametrów elektrycznych dachówek fotowoltaicznych w zależności od miejsca zacienienia i konfiguracji połączeń).
Słowa kluczowe: dachówka fotowoltaiczna, zacienienie, punkt mocy maksymalnej, konfiguracja połączeń dachówek solarnych.
Keywords: photovoltaic roof tile, shading, maximum power point, configuration of photovoltaic roof tiles connection.
Introduction
Photovoltaic installations in Poland have been gaining popularity over the last few years. Types of photovoltaic cells (PV) used in panels change – in practice, polycrystalline cells have already been driven out of the market and replaced by monocrystalline cells with a higher photovoltaic conversion efficiency. Furthermore, also half-cell protected by three bypass diodes have become a standard nowadays. In addition to this, new technologies related to building-integrated photovoltaics (BIPV) have been gaining more and more popularity. These include photovoltaic roof tiles, skylights, windows, etc. During many years of operation of a photovoltaic installation, its output parameters change, however, there can also be temporary situations, which affect reductions in the value of generated power, such as, for instance, shadings of PV cells. The causes of PV cell shading on PV generators may be constant and periodical (as, e.g. structural elements of a building or landscape) or random (dirt, leaves, animals, birds and their droppings, etc.) The constant elements should be taken into account when designing installations and eliminated, however, the random shadings are unpredictable, therefore, various procedures which will minimise the related losses must be applied. In the case of traditional PV panels, the problem of shadings is widely described, analysed and studied in the literature. There are many publications regarding experimental studies [1-5], or mathematical and simulation analyses [6-9] discussing this problem.
In the case of BIPV elements, this problem may be more noticeable in view of their smaller area, lower values of electrical parameters and necessity of ensuring series-parallel connections in chains connected to a single inverter tracker input (MPPT).
In classic photovoltaic installations (especially prosumer ones), where traditional PV panels are used, a series connection to the input of the MPPT inverter is provided. The output parameters of the serial chain of panels match the input parameters of the inverter. The current generated by the panels is approx. 10-12 A, the inverter current protection is about 16 A at most. The PV chain voltage may be up to approx. 900 V, which is also within the range of operating voltages of the inverters. PV roof tiles analysed in this paper are characterised by lower values of currents and voltages, which necessitates the use of series-parallel connections in input chains to the inverters. The presence of PV cell shadings in mixed chains will cause different energy effects than in the case of serial chains, and this is not yet sufficiently explored in the literature and confirmed in experimental studies.
This publication presents results of tests of solar roof tiles operating in real conditions, connected in various configurations, with analysis of output electrical parameters caused by local shadings, located in different roof tile areas.
Subject of study
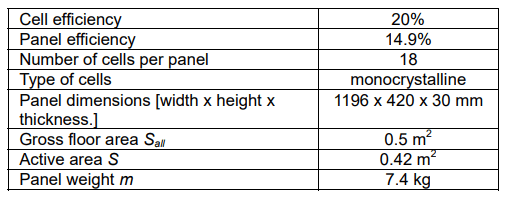
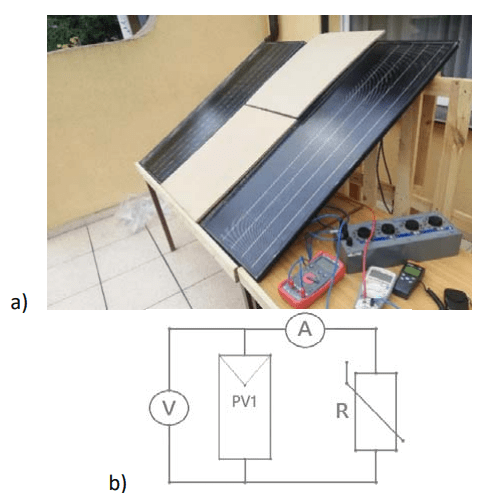
The study was performed using photovoltaic roof tiles of a Polish manufacturer, a company operating under the name Fotton. The view of the tile is presented in fig. 1 and its technical data is given in table 1.

Table 1. Technical data of FOTTON FTDS52 solar tile under STC conditions [10]
In order build an exemplary and most popular prosumer installation in Poland with a power of about 4.5 kW, it would be necessary to use 10 traditional PV panels with a power of 450 W, each connected into a single serial chain, whose output parameters would be about Im = 11 A and Um = 410 V. For the analysed solar roof tile, 86 tiles and two chains consisting of a row of 43 roof tiles would need to be used. Owing to this, a PV generator chain with approximate parameters of Im = 10.6 A and Um = 421 V would be obtained, that is, close to those of the panels. The inverter in both cases would operated with the same efficiency, and the other protective elements of the installation would be the same in both cases. The roof area covered with PV roof tiles would approx. be 34 m2 , and in the case of panels, just about 22 m2.
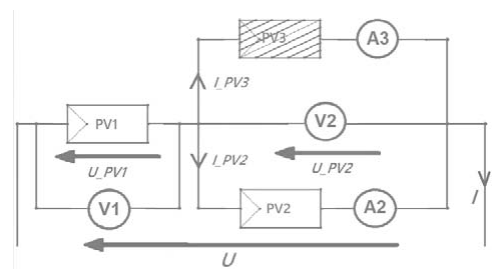
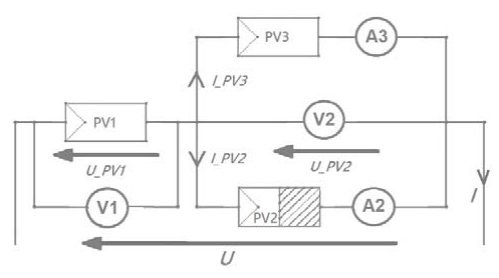
In order to check the impact of the configuration of connections and the locations of the PV roof tile shading, many measurements in different variants, on the test stand presented in figure 2a were carried out in accordance with the measurement diagram from figure 2b. During the measurements, environmental conditions were very stable, therefore, the accurate observation of relationships and the drawing of correct conclusions were possible.
Study of the impact of configuration of connections of unshaded PV roof tiles
The study of the impact of configuration of connections on electrical parameters of photovoltaic roof tiles was conducted within one day in July 2021. The value of radiation power density osciliated within 980 – 988 W/m2 during the measuring tests. The study covered a single PV roof tile and the connection of three roof tiles in a series, parallel and mixed configuration (one roof tile connected in series with tiles connected in parallel). Based on the obtained measuring data, current-voltage characteristics presented in figure 3 were plotted.
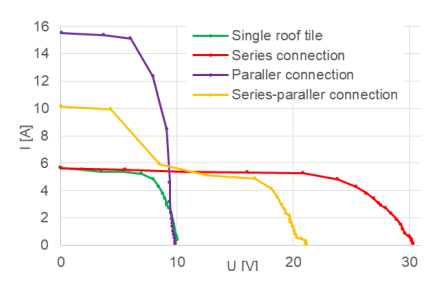
When analysing the comparison of characteristics I = f(U) in different configurations of connections (fig. 3), it is possible to notice that the weather conditions were stable and the characteristics do not deviate from the norm. The compatibility of existing relationships – the sums of currents and voltages depending on the configuration – were confirmed. Visible “stepped” shape of the curve for the mixed configuration is caused by the uneven number of roof tiles. The values of currents from two roof tiles connected in parallel were aggregated and the voltages from the first roof tile and the group of parallel roof tiles were also aggregated. The output parameters of PV roof tile configurations were determined in accordance with the following equations [8,11]:
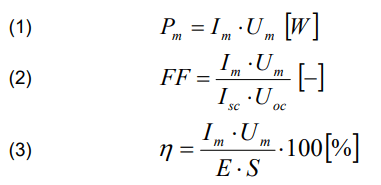
where: Pm – maximum power [W], Im – current at maximum power point [A], Isc – short-circuit current of a circuit [A], Um – voltage at maximum power point [V], Um – open circuit voltage [V], FF – fill factor [-], η – photovoltaic conversion efficiency [%], E – irradiance [W/m2], S – active surface of the PV roof tile [m2].
The value of the power generated by a single roof tile was 38 W, while the series, parallel and mixed configuration generated 109 W, 98 W and 81 W of electrical power respectively. It is possible to draw a conclusion that the type of configuration (series or parallel) had no significant effect on the value of generated power, which will, however, look completely different when the shading of PV cells of roof tiles occurs. The mixed configuration is characterised by a double increase in power in comparison with a single roof tile (instead of the triple increase), in view of the uneven number of (three) tiles. If this system consisted of two roof tiles in a parallel configuration and two in a series configuration, the value of generated power would be four times one. The detailed explanation of this situation was described when analysing the diagram from figure 10 and the characteristics plotted in figure 11.
Shading of a single PV roof tile
When investigating the impact of the shading on the operation of a single PV roof tile, one row (9 cells horizontally) and 4 columns of cells (4 columns vertically in 2 rows of cells) were obscured, as shown in figure 4. Measurements for these shading methods were performed, and then compared with the unshaded roof tile (fig. 5).
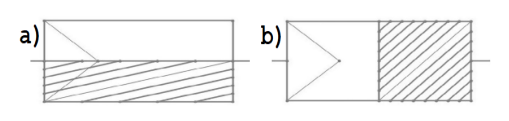
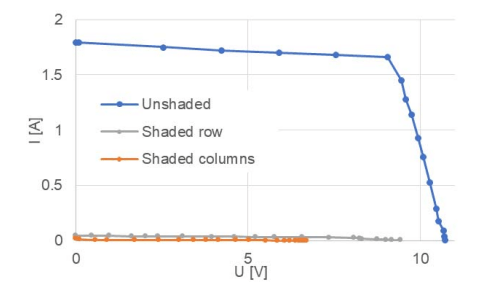
When comparing graphs I = f(U) of a single PV roof tile for different cases of shading from figure 5, it is possible to observe a very high decrease in short-circuit current Isc for panel variants both with shaded columns (0.02 A) and in the obscured row of cells (0.05 A). The roof tile practically does not produce current (and thus also power). For a case with shaded columns (fig. 4b) the open circuit voltage Uoc is lower in comparison to the situation with the shaded row (fig. 4a) and amounts to 6.7 V and 9.4 V respectively. On the other hand, the unshaded roof tile generated open circuit voltage equal to 10.7 V and short-circuit current equal to 1.79 A at irradiance of E = 591 W/m2 , which results in the generation of power equal to 15.02 W.
Shading in the series connection
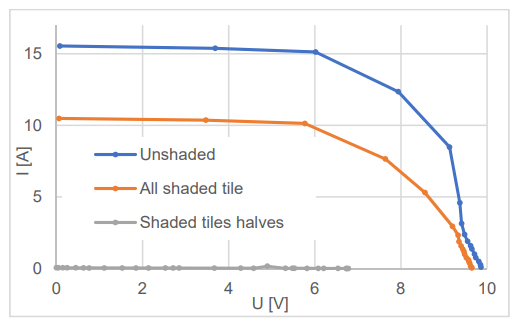
Other tests were carried out using a chain of three PV roof tiles connected in series with one whole shaded PV generator (fig. 6a) and with shaded halves of all roof tiles (fig. 6b). The obtained characteristics I = f(U) were compared with the characteristics of unshaded PV roof tiles (fig.7).
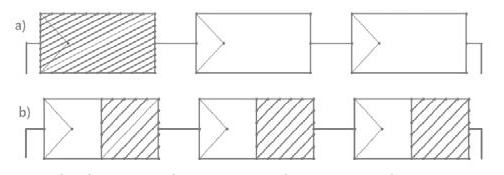

It is possible to notice that in the first case where one complete PV panel was shaded, the total voltage of the chain is the sum of voltages generated by two other PV generators (Uoc = 19.3 V instead of 30.3 V). The shaded roof tile does not generate current and was bypassed by a by-pass diode, owing to which the current in the configuration with the shading was 5.37 A, and in the case of the chain without the shading – 5.64 A. For all the three half-shaded PV roof tiles, it is possible to observe the lack of current generation (0.05 A) and the voltage is the sum of voltages of three shaded roof tiles (18.4 V), which is a confirmation of the data presented in fig. 5, where one roof tile generated voltage of 6.7 V. For a system with the obscured roof tile, the system generates the power of 68.78 W, while in the other case, only 0.1 W.
Shadings in the parallel connection
Similar forms of shading of PV roof tiles were used for their parallel connection (fig. 8) and the same comparison was plotted for current-voltage curves (fig. 9).
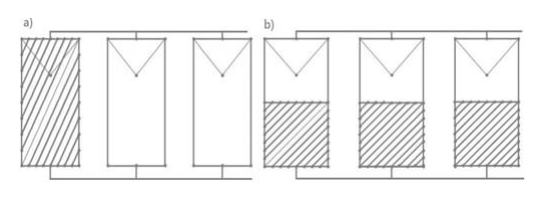
When analysing the graphs I = f(U) (fig. 9) of three PV roof tiles connected in parallel for different cases of shading, it is possible to observe a similar situation for the serial connection. When the panel is shaded completely (fig. 8a), the short-circuit current is obtained as the sum of currents generated by two other unshaded roof tiles, (10.48 A instead of 15.54 A) and the voltage of the open circuit equal to 9.65 V, which was reduced from 9.96 V by the shaded panel. A decrease in voltage on the bypass diode may range between 0.2 – 0.7 V, which was confirmed. With the shading of halves of all PV roof tiles, the open circuit voltage is equal to 6.78 V (just like in the case with figure 5) and the short-circuit current is 0.05 A. In the presented configurations, when the whole roof tile is obscured, the generated power is equal to 58.45 W, and when halves of roof tiles are shaded, it is 0.8 W.
Shadings in the series-parallel connection
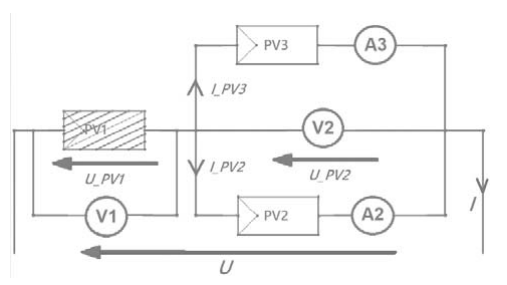
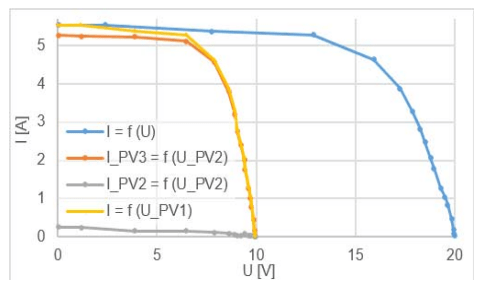
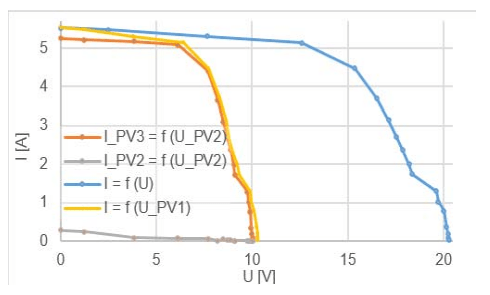
In order to investigate the impact of the shading location on output parameters of a series-parallel chain of PV roof tiles, measurements were carried out for the configuration without shadings as in figure 10, owing to which base current-voltage characteristics were obtained for the purpose of further analysis (fig. 11). Respective currents and voltages in the series and parallel chain of the configuration were subject to measurements for the purpose of accurate representation of the propagation of currents and voltages in the respective parts of the circuit.

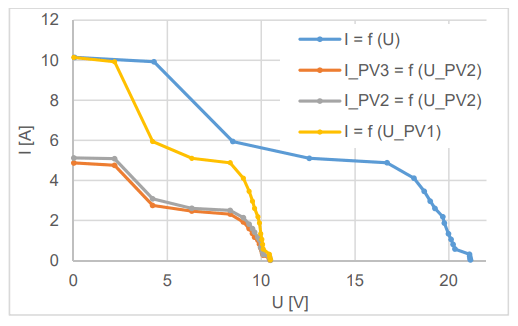
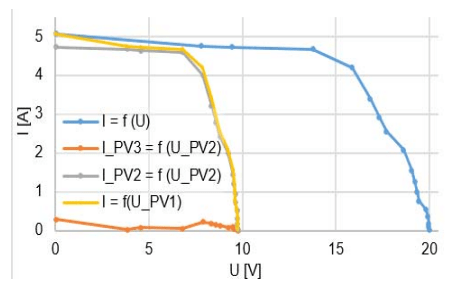
When analysing graphs I = f(U) of three unshaded PV roof tiles in a series-parallel connection, presented in figure 11, it is possible to notice that currents I_PV3 and I_PV2 are almost equal to each other, which means that the uniform propagation of current I takes place in the parallel chain. These roof tiles generate maximum short-circuit current at the given irradiance, which means that the resultant short-circuit current is equal to 10.14 A and flows through the PV1 roof tile connected in series. As the PV1 tile cannot operate at such a value of current (higher than the maximum current generated by it) a characteristic “curve” is noticeable as the voltage increases and its value is determined at the level of the short-circuit current of a single roof tile (about 5 A). This means that at the maximum power point, the PV1 tile determines the value of the current flowing in the circuit, dissipated to the two tiles from the parallel configuration (PV2 and PV3), which will be limited to about 50% of their power. Since there is no shading and all the tiles are uniformly illuminated, the voltages U_PV1 and U_PV2 are equal to each other (10.49 V and 10.67 V, respectively) and the total system voltage is their sum (21.15 V). The value of power generated at the maximum power point is equal to 81.55 W.
The following locations of shadings in the tested system were analysed:
• on half of two PV roof tiles in the parallel chain (fig. 12),
• on the whole roof tile from the parallel chain (fig. 14),
• on the entire roof tile connected in series to the group of two parallel ones (fig. 16),
• one row of cells of the roof tile from the parallel part of the connection (fig. 18),
• 4 columns from two rows of roof tiles, from the parallel part of the connection (fig. 20).
The following figures 12, 14, 16, 18 and 20 only present the variable fragment of the circuit from figure 10, also showing the place of occurrence of shadings for its accurate location. The remaining load-measuring part remained unchanged in each case.
The first shading case considered is the half-obscuration of the two PV roof tiles of the parallel chain (fig. 12).

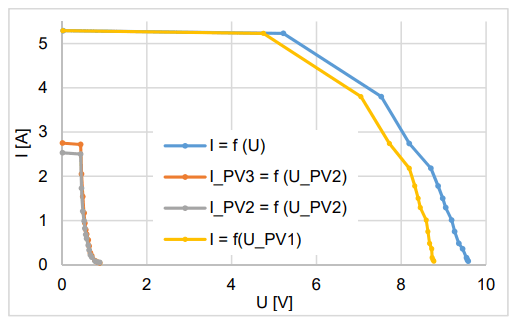
When analysing characteristics of the three PV roof tiles in a series-parallel connection for the variant in which halves of roof tiles in the parallel chain from figure 13 are shaded, it is possible to observe that the parameters of the circuit are determined only by the PV1 roof tile from the series (current, voltage and I-U characteristics are similar to a single roof tile, and are described in fig. 3). PV2 and PV3 tiles generate 2.53 A and 2.75 A respectively when short-circuited, but they are disconnected from the circuit (bypassed) by the by-pass diodes, so they do not introduce any changes in the circuit. Maximum generated power is 28.61 W.
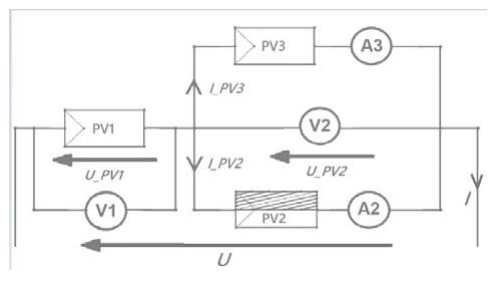
Next, the case for complete obscuration of one PV panel from the parallel branch was investigated (as shown in fig. 14).
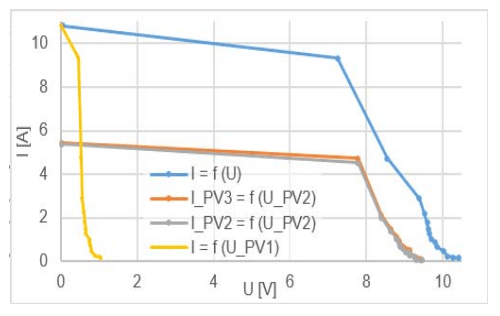
When analysing the characteristics of three PV tiles in a series-parallel connection, for the case of complete obscuration of one roof tile in the parallel chain from figure 15, it can be noted that:
• the PV3 roof tile does not work because of the complete obscuration – it practically does not generate any current (0.29 A) and is omitted by the by-pass diode,
• the PV1 and PV2 roof tiles may function normally and generate higher values of currents and voltages, as they are not limited by PV3,
• the resultant voltage is the sum of voltages from the PV1 and PV2 tiles.
The above-mentioned situation is more advantageous than that related to the system presented in fig. 12, as the system generates more than twice the power (66.61 W), even though the shade area is identical, but located in a different way. The shade located on the entire single roof tile (and not on two halves) caused its disconnection from the circuit, without affecting the others in a negative way, which may work with the nominal power under the given conditions.
The shading variant analysed next is the complete obscuration of one PV generator connected in series to a parallel group of roof tiles (fig. 16). When analysing I-U characteristics of the presented system (fig. 17) it can be noted that the value of short-circuit current Isc of the system is the sum of currents generated by PV2 and PV3 tiles. The obscured PV1 roof tile was bypassed by a by-pass diode, owing to which the roof tiles from the parallel system may generate maximum values of currents and are not limited at 50%, as was the case in the system from figure 10. However, the bypassed series roof tile does not generate voltage in practice (only the by-pass diode voltage is visible), so the total voltage of the system is the sum of voltages of parallel roof tiles and voltage on the by-pass diode of the PV1 tile. In the circuit, the maximum value of power generated is 67.55 W.
Then, the case of horizontal shading of the row of cells of a PV roof tile located in the parallel branch (fig. 18) was investigated.
When analysing the characteristics from figure 19, it is possible to notice a similar situation as that described in the configuration from figure 14. The shaded PV2 roof tile, in view of its obscuration was bypassed by a by-pass diode, so it does not limit the operation of the PV3 roof tile. Owing to this, the PV1 and PV2 may work with their maximum powers, and the output parameters of the system are: short circuit current – 5.54 A, open circuit voltage – 20 V and generated power – 73.87 W.
The last shading variant is the obscuration of a half of a PV roof tile from the parallel branch (4 columns in two rows, as presented in figure 20).
When analysing the characteristics of the studied system, presented in figure 21, it is again possible to observe a similar situation to the one described previously. The shaded PV2 roof tile is bypassed by a by-pass diode, therefore, it does constitute not a load for the remaining part of the system. The output parameters are: short-circuit current – 5.52 A, open circuit voltage – 20.28 V, power – 68.66 W.
Summary
The studies allowed for the gaining of knowledge concerning the influence of the shading location on the output parameters of the installation composed of photovoltaic roof tiles. Based on the measurement data, the values of parameters characterising the process of energy generation from the system of PV tiles were determined, and the obtained results were presented in Table 2. The table header contains the numbers of figures of systems for which the studies were performed.
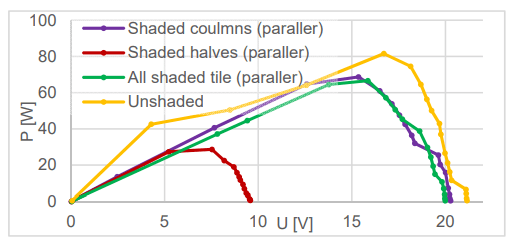
During the testing of the impact of the shading on the operation of three PV roof tiles in a series-parallel connection, also power-voltage characteristics were determined for different shading variants. When analysing the comparison of the characteristics P = f(U) from figure 22, it can be seen that the highest value of the generated maximum power Pm was achieved for the system in which no shading was present (for the system in figure 10, the obtained power was 81.54 W). On the other hand, the lowest value of generated power Pm = 28.61 W was obtained for the system in fig. 12, in which the halves of two PV roof tiles in the chain, where the generated power was reduced by as much as 65% were obscured. The reason for such a large decrease in the value of maximum power Pm can be observed along the characteristic curve I = f(U) from figure 13, where there was a simultaneous decrease in the value of the generated current and voltage of the system during the obscuration of the halves of the photovoltaic tiles, which were excluded from operation by the bypass diodes.
Table 2. List of values of parameters investigated in the analysed measuring systems
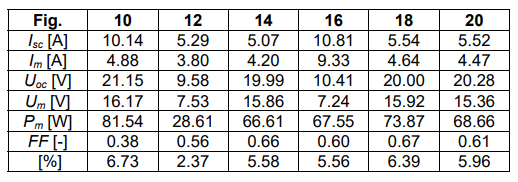
In the variants related to obscuration of the PV cell row or column, as well as to the total shading of the PV roof tile in the parallel branch, similar reductions in the maximum power Pm were observed in relation to the unshaded system. The output parameters of the systems presented in figures 14, 18 and 20 and the current-voltage characteristics (fig. 15, 19 and 21) carried out for them are very similar to each other, which is the best of the analysed situations, with the shading of the PV cells. The value of the generated power, in comparison with the system without shadings, was lower by about 9-17%. When analysing characteristics I = f(U) of individual cases from figures 15, 19 and 21, we can only observe a reduction in the value of short-circuit current Isc, at invariable open circuit voltage Uoc, in each of these cases, which is a good situation from the point of view of operation of a photovoltaic inverter. The value of power generated in these systems is similar to the one generated in the configuration from figure 16, however, a change in the value of currents and voltages is observed. This system is characterised by about twice the value of current and half the value of voltage in view of the operation of the parallel part of the system only, at complete shading, and thus, disconnection of the PV1 roof tile by the by-pass diode. The shading situation which causes the smallest losses of generated power is presented in fig. 16, when the horizontal row of PV cells was subject to obscuration. It was then that the open circuit voltage generated by the obscured roof tile was higher than in the case of obscuration of the columns. This translated into power losses in comparison with the system without shading by only 9%, and generation efficiency that was most similar to the operation of the system under unshaded conditions. The obtained fill factor FF of the unshaded system had a very low value, due to the odd number of roof tiles in the series part of the system.
To sum up, investors who decide to install the photovoltaic installation composed of solar roof tiles instead of traditional PV panels must reckon with a significant change in electrical parameters of the input chain to the inverter, as well as a change in conditions of its operation during the occurrence of local shading of PV cells. The apparent creation of a shadow with a given area on PV roof tiles may cause different losses of generated power due to its location (within one or more roof tiles) compared to photovoltaic panels.
REFERENCES
[1] Cardinale-Villalobos L., Meza C., Méndez-Porras A., MurilloSoto L.D., Quantitative Comparison of Infrared Thermography, Visual Inspection, and Electrical Analysis Techniques on Photovoltaic Modules: A Case Study, Energies 15 (2022), 1841. https://doi.org/10.3390/en15051841
[2] Al Mamun M.A., Hasanuzzaman M., Selvaraj J., Experimental investigation of the effect of partial shading on photovoltaic performance, IET Renew. Power Gener. 11 (2017), No. 7, 912-921, https://doi.org/10.1049/iet-rpg.2016.0902.
[3] Deline Ch., Meydbray J., Donovan M., Forrest J., Partial shade evaluation of distributed power electronics for photovoltaic systems, in: 38th IEEE Photovoltaic Specialists Conference (IEEE PVSC), 2012, Austin, Texas, 3-8.06.2012, 1627-1632, https://doi.org/10.1109/PVSC.2012.6317908
[4] Hamdi S., Saigaa D., Drif M., Modeling and simulation of photovoltaic array with different interconnection configurations under partial shading conditions for fill factor evaluation. International Renewable and Sustainable Energy Conference (IRSEC), 2014, 17-19 Oct. 2014, Ouarzazate, Morocco https://doi.org/10.1109/IRSEC.2014.7059896
[5] Jansson P.M., Whitten K., Schmalzel J.L., Photovoltaic module shading: smart grid impacts, in: Sensors Applications Symposium (SAS IEEE), 2011, San Antonio, Texas, 22- 24.02.2011, 323-328, https://doi.org/10.1109/SAS.2011.5739826
[6] Abdulkadir M., Yatim A.H.M., Yusuf S.T., An improved PSObased MPPT control Strategy for photovoltaic systems, Int. J. Photoenergy, 11 (2014), https://doi.org/10.1155/2014/818232.
[7] Nasiruddin I., Khatoon S., Jalil M.F., Bansal R.C., Shade diffusion of partial shaded PV array by using odd-even structure, Solar Energy, 181 (2019), 519-529, https://doi.org/10.1016/j.solener.2019.01.076
[8] Trzmiel G., Głuchy D., Kurz D., The impact of shading on the exploitation of photovoltaic installations, Renewable Energy, 153 (2020), 480-498, https://doi.org/10.1016/j.renene.2020.02.010
[9] Liqun L., Zhiyi S., Chunxia L., Wyjściowa charakterystyka matrycy fotowoltaicznej w warunkach częściowego zacienienia – zasada superpozycji napięć DC z wykorzystaniem pakietu Matlab, Przegląd Elektrotechniczny, 12a (2012), 284
[10] https://www.fotton.pl/produkt/dachowka-solarna-fotton/, access: 02.03.2022
[11] Szczerbowski R.: Instalacje fotowoltaiczne – aspekty techniczno-ekonomiczne, Przegląd Elektrotechniczny, 10 (2014), s. 31-36, https://doi:10.12915/pe.2014.10.08
Autorzy: dr inż. Dariusz Kurz, Politechnika Poznańska, Instytut Elektrotechniki i Elektroniki Przemysłowej, ul. Piotrowo 3a, 60-965 Poznań, E-mail: Dariusz.Kurz@put.poznan.pl; prof. dr hab. inż. Ryszard Nawrowski, Politechnika Poznańska, Instytut Elektrotechniki i Elektroniki Przemysłowej, ul. Piotrowo 3a, 60-965 Poznań, E-mail: Ryszard.Nawrowski@put.poznan.pl; inż. Szczepan Kałuża, Politechnika Poznańska, Instytut Elektrotechniki i Elektroniki Przemysłowej, ul. Piotrowo 3a, 60-965 Poznań, E-mail: Szczepan.Kaluza99@gmail.com.
Source & Publisher Item Identifier: PRZEGLĄD ELEKTROTECHNICZNY, ISSN 0033-2097, R. 98 NR 7/2022. doi:10.15199/48.2022.07.21
