Published by A. Testa member IEEE, D. Gallo student member IEEE, R. Langella member IEEE
Abstract: The harmonic and interharmonic analysis recommendations contained in the latest IEC standards on Power Quality are considered. The spectral leakage problems, due to synchronization errors of the analysed waveforms with the window widths adopted are analysed. Improvements of the signal processing recommended by IEC, based on the utilization of the classical Hanning window in place of the Rectangular window, are proposed and made compatible with the grouping technique introduced in the Standards. Sensitivity analyses on simple case studies together with experimental results show the sensitivity to synchronization errors of the signal processing recommended by IEC and the usefulness of the improvements proposed.
Index terms: Harmonic and Interharmonic Distortion, Power Systems, Spectral Leakage, Hanning Window, IEC standards.
I. NOMENCLATURE
The latest IEC standard drafts, 61000-4-7 and 61000-4-30 [1,2], contain methods of measurement and interpretation of results for Harmonic and Interharmonic distortion. Here, they are synthesized with reference to 50Hz systems and, then, referred to as “IEC technique”.
A. Recommended signal processing
− sampling frequency, fs: sufficiently high to allow for the analysis of frequency components up to 9 kHz;
− window width, TW: exactly 10 periods of the fundamental period, T1, corresponding approximately to 200ms;
− rectangular window, RW: no window weighting is allowed;
− Discrete Fourier Transform (DFT) with 5Hz of frequency resolution.
B. Definitions
− Harmonic frequency, fn: a frequency which is an integer multiple of the power supply frequency, f1.
− Harmonic order, n: the ratio of fn to f1.
− Spectral component, Ci: the rms value of the DFT output.
− Harmonic component, C10n: any Ci having a harmonic frequency.
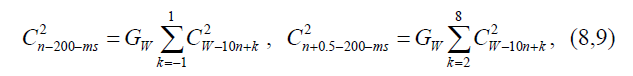
− Harmonic sub-group, HG, of amplitude Cn-200-ms: components Ci grouped, as shown in Fig.1, according to:

− Interharmonic frequency: a frequency which is not an integer multiple of the fundamental frequency.
− Interharmonic component: any Ci having an interharmonic frequency.
− Interharmonic sub-group, IG, of amplitude Cn+0.5-200-ms: components Ci grouped, as shown in Fig.1, according to:

− IG frequency, fIG: the center frequency of the harmonic frequencies between which the group is situated.
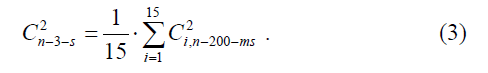
− very short time measurements Cn-3-s: values smoothed over 3-s intervals, according to:

II. INTRODUCTION
THERE is an increasing interest among electrical power engineers in widening the studies of the current and voltage waveform distortion to include interharmonics in addition to harmonics considered until now [3]-[5]. Interharmonics are generated by periodical time varying loads, by circuits characterized by multiple switching functions, etc. The effects, such as the malfunctioning of remote control systems, erroneous firing of thyristor apparatus, display or monitor image fluctuations or lighting system flicker, may be very remarkable. This is determining a trend of standards in fixing limits for interharmonics lower than limits for harmonics [3].
The presence of interharmonics introduces analysis and measurement difficulties related to the change of waveform periodicity, the low amplitude of interharmonics of interest, an increased sensitivity to desynchronization problems and the enlarged complexity in the result storage and presentation. Concerning measurements, the difficulties come, however, from a number of components of the measuring chain. Remarkable problems are related to the signal processing, that is a fundamental part of both measurements and numerical analyses; such problems turn out to be completely solved if the distorted waveforms could be analysed adopting time window widths equal to an integer multiple of the actual values of their periods. In practice, such values are often not easy to estimate and to adopt and, anyway, the window width may result very long and the number of samples too high.
The IEC standard drafts [1] and [2] introduce the specified signal processing recommendations and definitions in Sec. I.
The recommended signal processing is aimed to standardization, simplification and unification. It ensures a relatively high frequency resolution (5 Hz) without increasing too much the number of samples to be considered. Using the RW contributes, in principle, to maintain the highest frequency resolution.
The harmonic and interharmonic grouping constitutes one of the most remarkable concepts introduced: a high simplification is obtained reducing the knowledge about interharmonic details in terms of frequency localization and single component amplitude evaluation. Moreover, including also the two nearest interharmonic components in the harmonic sub-group aims at limiting, in a simple way, the most fearful spectral leakage effects on interharmonics in the nearest neighbour of harmonics.
The measurement and analysis experiences have shown that great difficulties arise in the interharmonic detection and measurement with acceptable levels of accuracy [5]-[7] due to the spectral leakage phenomenon [8]. The entity strictly depends on the spectral characteristics of the window adopted to weight the signals and, thus, an opportune choice can reduce the interference effects [9]. The IEC technique refers to the RW, that is to say to the simplest window, characterized by the narrowest main lobe (the best resolution among tones close in frequency), but the highest and most slowly decaying side lobes (the worst interference caused by a strong tone on a weaker tone non close in frequency).
This paper, starting from the consideration that the RW side lobe characteristics could have dramatic effects, proposes the use in the IEC technique framework of the Hanning Window (HW), which is characterized by a main lobe width only double compared to RW (acceptable resolution) and side lobes very low and quickly decaying (very limited interference conditions). The utilization of HW requires the harmonic and interharmonic group redefinition: an opportune “window grouping scale factor” is introduced.
In the following, the spectral leakage problems due to errors in synchronizing the time window to fundamental and harmonics and due to interharmonics non-synchronized with the DFT bins are analyzed. Sensitivity analyses give both qualitative ideas and quantitative results, which allow to calculate harmonic and interharmonic group errors for the different signal processing possibilities. Finally, experimental results on a modern high power loco are reported and analyzed.
III. SPECTRAL LEAKAGE AND IEC TECHNIQUE
In the analysis of real power system waveforms, spectral leakage problems are originated from two main causes:
i) the error in synchronizing fundamental and harmonics, that is the difference between the actual value and the value utilized to calculate TW for the signal processing,
ii) the presence of interharmonics non synchronized with DFT bins.
A. Error in synchronizing fundamental and harmonics
The fundamental frequency actual value, f1a, fluctuates around the system rated value, f1r, and a TW equal to 10/f1a seconds should be adopted. For reference performance instruments (class A), an uncertainty Δf = ± 10 mHz is allowed [2], and such a level of uncertainty can be assumed on the estimated value of TW that one could try to adopt also considering the finite frequency resolution of the sampling clock.
Figure 2a shows the effects of the application of the IEC technique with TW equal to 200.00 ms to a tone with a frequency of 50.01 Hz, 10/f1a=199.96 ms (the 50 Hz bin is not represented for the sake of clarity). The reported spectral leakage amplitudes represent the greatest absolute errors introduced in the interharmonic measurement, that is the case in which both the interfering and interfered components have the same or opposite phases.
It can be observed that: a) the leakage assumes values reaching the same order of the interharmonics of interest (1÷20/00); b) the harmonics take advantage of their greater distance (±50Hz rather than ±5Hz) and amplitude (some %); c) the grouping makes the spectral leakage effects worse, except for the HG containing the interfering tone.
It is important to underline that spectral leakage increases with the entity of the desynchronization of the fundamental and with the order of the interfering harmonic tone, as it will be shown in more detail in Sec.V (Figs 5and 6).
B. Presence of non-synchronized interharmonics
Interharmonics can be found at all frequencies and, moreover, since they change position the whole frequency range can be affected. This implies that, in general, an interharmonic is non-synchronized.
The effects of a tone localized at the frequency of 221.5Hz are reported in Fig.2b. It can be observed that: a) obviously, the actual interharmonic tone is not directly detected due to the picket fence effect (nearest bins are at 220 and 225 Hz); b) the grouping reconstructs from the leakage components an interharmonic amplitude not far from the actual amplitude; c) the leakage components outside the interfering IG are of some percentages of the interfering tone.
More critical conditions occur when desynchronized interharmonic tones fall near the border between two groups or they are close to each other, as it will be shown in detail in Section V (Figs 5 and 8).

IV. INTRODUCING THE HANNING WINDOW IN IEC TECHNIQUE
In order to limit leakage effects, as well known, different windows can be adopted instead of the Rectangular. The problem is that the adopted windows have to be made compatible with the IEC technique.
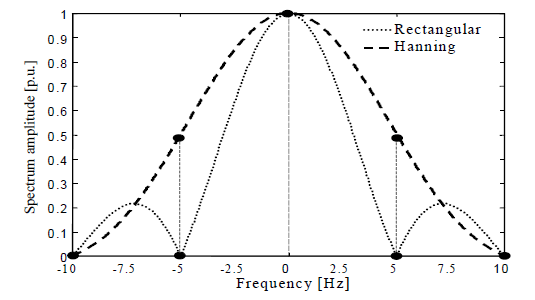
Hanning and Hamming windows seem particularly suitable because both are characterized by a main lobe width exactly double and side lobe width exactly equal compared to those of RW. For its better characteristics, in the following reference is made only to the Hanning Window (HW), whose spectrum (-10,+10Hz) together with that of RW is reported in Fig.3.
A windowed time signal, sW, is considered:
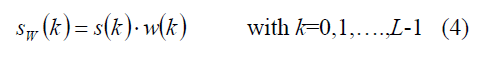
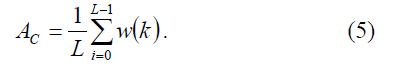
being w the window coefficients and L=TW • fs. To properly evaluate its spectral components, it is necessary to account for the window coherent gain, AC [9]:
In case of IEC component grouping, it is necessary to introduce a further weighting factor, which accounts for the effects introduced by the larger main lobe width. In fact, Fig. 3 shows, for HW, that a synchronized tone produces two side components (0.5p.u.), which combine with the central (1p.u.) according to (1) to give the HG amplitude. To account for this effect a “Grouping Gain” is introduced:

Desynchronized tones give rise to spectrum translation without relevant changes on AG as it will be shown in Sec. V.
Hence, the window grouping scale factor, GW, is simply obtainable referring to the DFT output of a 1 p.u. synchronized tone:
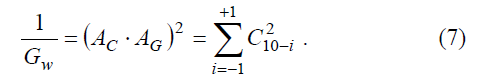
Finally, the expressions to be utilized for HG and IG amplitude calculation are:
in which CW are the DFT coefficients obtained for the windowed signal.
The improvements introduced by adopting HW come from the better side-lobes behavior, which is well defined by the highest side-lobe level and by the side lobe fall-off [9].
The values of these indexes are -13dB and -6dB/ott respectively for RW, while -32dB and -18dB/ott for HW. Quantitative effects of such improvements in presence of desynchronization can be easily appreciated in Fig.4, where the same cases of Fig. 2 have been repeated.
A complete comparison between RW and HW must be made taking in account also that the larger main lobe width implies a lower resolution among tones close in frequency. This aspect is developed in the next Section.

V. SENSITIVITY ANALYSIS
A sensitivity analysis of the group amplitude error to the position of a single tone and to the interdistance between two tones of the same group is developed. The aim is to test the effects of a desynchronized tone inside or outside the frequency range of a group and the interfering effects among interharmonic tones close in frequency.
A. Single tone case study
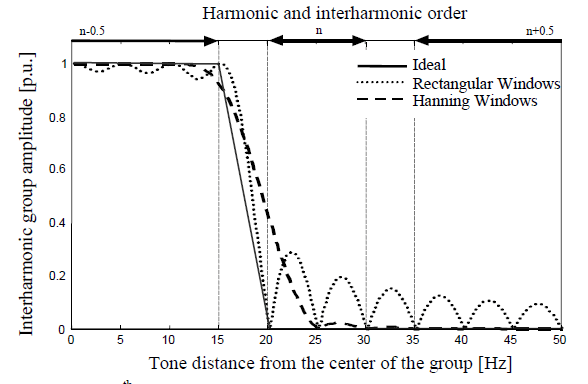
Figure 5 shows the (n-0.5)th IG amplitude due to a 1 p.u. tone versus its distance from the center of the group, using three different windows. They are the RW, the HW and an ideal window able to reduce linearly from one to zero the contribution of the tone in the 5 Hz range from the last bin of the (n-0.5)th IG until the first bin of the nth HG and to give one before and zero after this range.
From 0 to 15 Hz, the tone is within interharmonic group, hence it is possible to appreciate the accuracy of the IG amplitude estimation also in desynchronized position: the HW behaves better than the RW until it reaches the neighbor of the last bin of the group (15Hz).
From 20 to 50Hz the tone should contribute only to the nth HG (20-30Hz) and to the (n+0.5)th IG (35-50Hz). So, in this range Fig. 5 reports the spectral leakage introduced in the (n-0.5)th IG amplitude by the presence of a desynchronized tone in the near groups (n-th and (n+0.5)th). The RW leakage is always due to the side lobes. The HW leakage from 20 to 25Hz is mainly due to the main lobe and from 25 to 50Hz only to the side lobes. The HW, as expected, behaves better except in the extreme part (20-22Hz).
In the transition range 15-20Hz, the two curves corresponding to the RW and HW cross, giving the idea that the average leakage is the same; in both cases it is originated mainly from the main lobe.
Similar results have been obtained with reference to the HG.
In order to analyze the effects of the synchronization error of the fundamental frequency with respect to its actual value, a single 1 p.u. tone is centered in correspondence of a harmonic frequency.
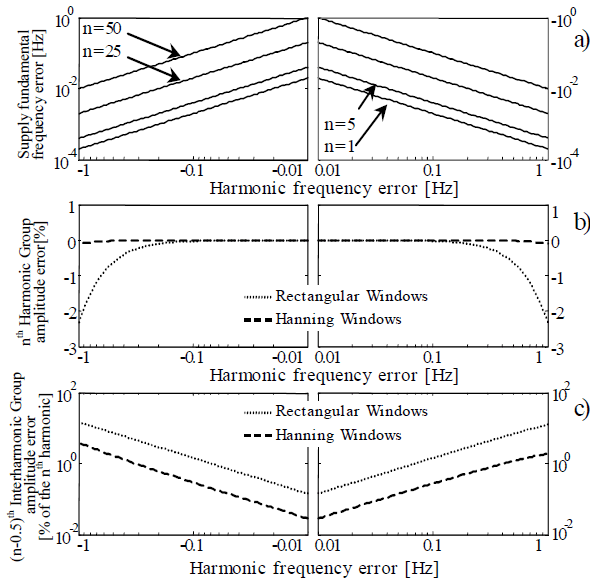
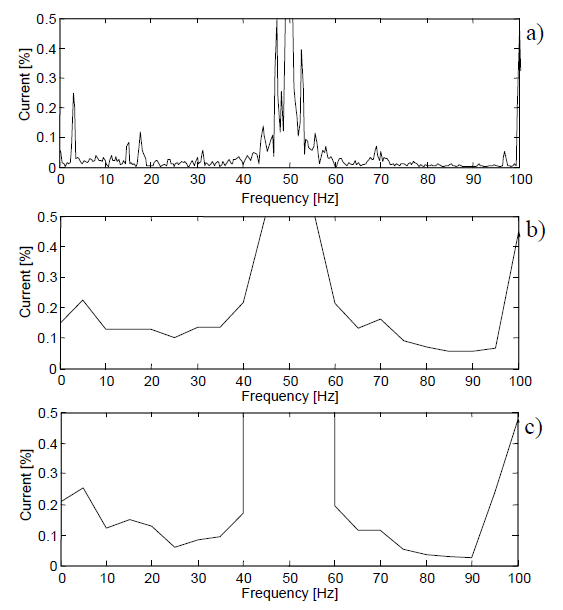
Figure 6 summarizes results of general validity in terms of HG and IG amplitude errors. In particular, reference is made to the harmonic synchronization error defined as:

f1a and f1e the power supply frequency actual and estimated values, respectively.
Figure 6a is made up of by two different quadrants. The left side quadrant reports on the vertical axis Δf1 for negative values and on the horizontal axis the corresponding negative harmonic synchronization errors, n↓Δf1; the right side quadrant does the same for positive errors.
Figure 6b reports the nth HG amplitude error versus harmonic synchronization error referring to RW and HW.
Finally, Fig.6c reports the (n-0.5)th IG amplitude error in terms of percentage of the interfering nth harmonic tone versus harmonic synchronization error in the same windowing conditions of Fig.6b, referring to the case in which the IG is empty (Cn-0.5-200-ms actual value equal to 0). Fig.6c can be also interpreted with reference to the (n+0.5)th IG once inverted the signs of the harmonic synchronization errors. The asymmetry of the error curves can be understood referring to Fig.5, range (20÷30Hz).
The utilization of Fig.6 is trivial: it is only necessary to start with the fundamental synchronization error on the vertical axis of a) and then draw a horizontal line till crossing the curves corresponding to the harmonic order to be analyzed. Then, starting from the crossing point, a vertical line has to be drown till crossing the curves corresponding to the windows in b) and c). From these crossing points, it is possible to read the corresponding errors on the HG and IG, on vertical axes.
Concerning the HG errors, it is useful to observe:
− for RW a) a high sensitivity, characterized by oscillations, with a maximum error value of 7.5%;
− for HW a) a low sensitivity and the absence of oscillations; b) error values of the same order AS those of the Rectangular only for the greatest frequency errors. Concerning the IG errors, once underlined they are in % of the interfering harmonics, it is useful to observe:
− for RW a) again an extremely high sensitivity and oscillations with a maximum error value of 29%;
− for HW a) a low sensitivity to the positive and, more in general, to little harmonic frequency errors and the presence of oscillations; b) error values of the same order of those of the RW only for the greatest negative frequency errors.

Fig.7 reports the zooms of Fig.6 for the frequency ranges [-1,-10-3] Hz and [+10-3,+1] Hz that are of prevalent interest also in presence of line synchronization tools (software or hardware). Fig.7c shows that HW reduces the most dangerous leakage errors, which are those produced by interfering harmonic tones on IGs, by about one order of quantity.
B. Couple of interharmonic tones case study
A signal composed by a couple of interharmonic tones at symmetrical positions from the centre of the group is considered:

Figure 8 shows the IG amplitude versus different values of Δf using the same windows of Fig.5.

From 0 to 5Hz the HW gives amplitude oscillations around the actual value, with one main local peak corresponding to 2.5Hz, that is to say in conditions of great interference between the two main lobes of the tone spectra. The behavior of RW is more stable with minor peaks.
From 5 to 10Hz the HW behaves practically as the ideal window, the RW has the same behavior shown in the range 0-5Hz. This is a consequence of the low falling off value of the side lobes of the RW.
A quantitative evaluation of general validity for the IG errors due to internal interharmonic interferences is not possible.
Anyway, such errors fortunately depend only on the interharmonic amplitudes and their values are related to particular and non-frequent conditions.
VI. EXPERIMENTAL RESULTS
In order to compare different signal processing techniques on field measurements, a reference technique must be adopted. The authors propose the use of a technique, called in the following Ideal IEC, based on the extension of IEC grouping to high resolution spectral analysis performed on TW=3s that is the whole interval of very short time measurements, as described in the appendix.
The experimental results refer to a research activity [7] on the new high-speed locomotive for European electrical railways, named ETR500. The measurements were conducted at the Test Room Facility of Ansaldo C.R.I.S., Naples (Italy), during the locomotive qualification tests. The locomotive uses a double conversion scheme that allows operating at 3/1.5kV in dc, and at 25kV(50Hz) in ac. This conversion scheme is able to generate interharmonics in addition to harmonics
The absorbed current spectra, here reported, refer to ac operation at 25kV and are expressed in % of the fundamental. The results are related to the following working conditions: half power (2.5MW), 225 Km/h speed and 40kN torque; the supply fundamental frequency measured with a very high precision technique resulted f1a≅f1e=50.02Hz.
Figures 9 and 10 show, in the ranges from 0 to 100Hz and from 500 to 1500Hz, respectively, the absorbed current spectra over 3 seconds obtained utilizing TW=3s and HW, TW=200.00 ms and RW and TW=200.00 ms and HW.
It can be observed that:
− concerning medium frequencies (Fig.10), it is evident that the use of HW into the IEC technique strongly reduces the spectral leakage which, on the contrary, characterizes the results obtained with RW;

− for low frequencies (Fig.9) the performances offered with TW=200ms are far from being satisfying and only the use of TW=3s and HW has given good results.
The low frequency difficulties are a consequence of the amplitude of the 50Hz desynchronized tone.
Figure 11 reports a comparison among the amplitudes of some interharmonic groups obtained with different techniques for experimental measurements of Figs 9 and 10. It is worth noting that the IEC-RW technique gives overestimated results reaching enormous overestimation for the 16.5th IG. the benefit of about one order of quantity introduced by HW remains confirmed (see also Fig.7).

VII. CONCLUSION
The paper has considered the harmonic and interharmonic analysis recommendations contained in the latest IEC standards on Power Quality. The spectral leakage problems due to synchronization errors of the analysed waveforms with the window widths adopted have been analysed.
Improvements of the signal processing recommended by IEC, based on the utilization of the classical Hanning window in place of the Rectangular window, have been proposed and made compatible with the grouping technique introduced in the Standards.
Sensitivity analyses on simple case studies together with experimental results have shown the sensitivity to synchronization errors of the signal processing recommended by IEC and the usefulness of the improvements considered.
The main outcomes of the paper are:
− the most severe spectral leakage problems are caused by fundamental frequency desynchronization, also for values of the same order that characterize the accuracy of IEC class A instruments and of normal synchronization tools;
− desynchronization of interharmonic tones seems able to produce only secondary effects, in specific and infrequent interference conditions caused by interharmonic tones very close in frequency;
− the errors on the interharmonic groups are very remarkable because of the difference between the amplitude of harmonic and interharmonic tones (one or more order of quantity) and because of the amplification effect introduced by the harmonic order;
− the aforementioned errors are reduced by one order of quantity by using HW in place of the RW for little fundamental frequency desynchronization;
− the low frequency measurement is by far the most difficult challenge due to the closeness to the fundamental frequency tone, and causes remarkable problems.
VIII. REFERENCES
[1] IEC standard 61000-4-30: Power Quality Measurement Methods, Testing and measurement techniques, Ed. 2000-CD.
[2] IEC standard 61000-4-7: General guide on harmonics and interharmonics measurements, for power supply systems and equipment connected thereto, Ed. 2000-CDV.
[3] IEEE interharmonic task force, “Interharmonic in Power System”, Cirgré 36.05/CIRED 2 CC02 Voltage Quality Working Group, to be published on Electra and IEEE Transaction on Power Delivery.
[4] R.Carbone, A.Testa, D.Menniti, R.E.Morrison, E.Delaney, “Harmonic and Interharmonic distortion in Current Source type Inverter drives”, IEEE Transactions on Power Delivery, vol.10, no. 3, July 1995, pp.1576-1583.
[5] Carbone R., Menniti D., Morrison R. E., Testa. A: “Harmonic and Intherarmonic Distortion Modelling in Multiconverter System”, IEEE Transactions on Power Delivery, Vol. l0, n. 3, July 1995, pp.1685-1692.
[6] A. Testa, D. Gallo, R. Langella et alii: “Report on Techniques to analyse harmonic distortion due to modern AC Rails”, Proceeding of the 4th Technical Scientific Report Ansaldo, Napoli, Italy, November 1999.
[7] P.Langlois & R.Bergeron “Interharmonic analysis by a frequency interpolation method”, Proceeding of the 2nd International Conference on Power Quality, Atlanta, USA, Sept. 1992, pp. E-26:1-7.
[8] A.V.Oppenheim, R.W.Schaffer, Discret time signal processing, Prentice-Hall International Inc., 1989.
[9] F.J.Harris, “On the use of window for Harmonic Analysis with the Discrete Fourier Transform”, proc. of the IEEE, vol. 66, No. I, January 1978.
IX. BIOGRAPHIES
Daniele Gallo was born in S. Maria C.V. (CE), Italy on August 4, 1974. He received the degree in Electronic Engineering from the Second University of Naples, in 1999. He is working towards the Ph.D. degree in Electrical Energy Conversion at the Second University of Naples, Aversa, Italy. Dr. Gallo is a student member of IEEE Power Engineering Society.
Roberto Langella was born in Naples, Italy, on March 20, 1972. He received the degree in Electrical Engineering from the University of Naples, in 1996, and the Ph.D. degree in Electrical Energy Conversion at the Second University of Naples, in 2000. Dr. Langella is currently assistant professor in Electrical Power Systems at Second University of Naples, Aversa, Italy. Dr. Langella is a member of IEEE Power Engineering Society.
Alfredo Testa was born in Naples, Italy, on March 10, 1950. He received the degree in Electrical Engineering from the University of Naples, in 1975. He is a Professor in Electrical Power Systems at the Second University of Naples, Aversa, Italy. He is engaged in researches on electrical power systems reliability and harmonic analysis. Dr. Testa is a member of IEEE Power Engineering Society and of AEI (the Italian Institute of Electrical Engineers).
X. APPENDIX
A. Grouping Extension
To compare the results of analyses adopting different TW, it is necessary to refer to generalized HG and IG definitions. In a continuous scenario, borders at distances of ±7.5Hz (±17.5Hz) from the center of the harmonic (interharmonic) groups are considered as assumed for (1) and (2) (see Fig.1).
Analyzing 3 seconds, the groups can be calculated as:

This work was supported by the Italian Ministry for University and Scientific and Technologic Research, under the grant “Cluster 12”.
G. Gallo, R. Langella and A. Testa are with Seconda Università di Napoli, Dipartimento di Ingegneria dell’Informazione, Via Roma, 29 – 81031 – Aversa (CE) Italy, Ph. +39 081 5010239, Fax ++39 081 5037042, daniele.gallo@ieee.org, roberto.langella@ieee.org, alfredo.testa@ieee.org.
Source & Publisher Item Identifier: IEEE Transactions on Power Delivery · February 2004.
DOI: 10.1109/TPWRD.2003.820437
