Published by Małgorzata ŁATKA, Marek NOWAK, Rzeszow University of Technology
Abstract. The article presents the results of a comparative analysis of the basic indicators characterizing the interruptions in the supply of electricity. On the basis of generally available reports of selected DSOs, a list of selected indicators was prepared over the years. A comparison of these data was made, for the largest energy distribution companies in Poland. Conclusions from this analysis may be used to determine the level of power supply reliability and energy security of the country.
Streszczenie. W artykule przedstawiono wyniki analizy porównawczej podstawowych wskaźników charakteryzujących przerwy w dostawach energii elektrycznej. Na podstawie ogólnie dostępnych raportów wybranych OSD opracowano zestawienia wybranych wskaźników na przestrzeni lat. Dokonano porównania tych danych, dla największych spółek dystrybucyjnych w Polsce. Wnioski z tej analizy mogą być wykorzystane do określenia poziomu niezawodności dostaw energii elektrycznej i bezpieczeństwa energetycznego kraju. (Analiza porównawcza wskaźników dotyczących przerw w dostawach energii elektrycznej dla odbiorców energii elektrycznej dla wybranych operatorów systemów dystrybucji)
Keywords: SAIDI, SAIFI, MAIFI, power supply breaks, comparative analysis
Słowa kluczowe: SAIDI, SAIFI, MAIFI, przerwy w zasilaniu, analiza porównawcza.
Introduction
Companies that are involved in the distribution of electricity are obliged to provide information to their customers, regulated by relevant regulations. Distributors, in the form of annual reports, provide information on the number of interruptions and their length, i.e. indicators of the duration of interruptions in the supply of electricity. Interruption duration indicators are SAIDI, SAIFI and MAIFI for example. These indicators show the average length of long breaks, the average number of breaks and the average number of short breaks per consumer. In addition to these three, there are a number of other indicators. The improvement of these indicators is in the interest of energy distributors and is the subject of research by many scientific teams. [1÷6]
In terms of the area of electricity distribution, the territory of Poland was divided among 5 large DSO Distribution System Operators. There are also small companies dealing with the distribution of electricity, serving a much smaller number of customers. They are also obliged to provide information on selected indicators.
The article presents the results of a comparative analysis of selected indicators characterizing the size of power supply interruptions for various distributors operating in Poland. The comparative analysis of indicators was carried out on the basis of generally available data on the Internet and on the basis of detailed information obtained directly from operators. A number of aspects have been taken into account, such as: the length and types of power lines, the amount of transmitted energy, the amount of investment funds, the multi-year time space, the division of indicators taking into account the types of interruptions. The results of the analysis were presented both in tabular and graphical form on charts, which constituted the basis for the formulation of final conclusions.
Energy security
One of the basic concepts inherent in energy quality is energy security. On the basis of the Energy Law Act, energy security can be defined as a state in which the economy is able to fulfill the demand (current and predicted) of consumers for energy (electricity, gas, fuels) in a technically and economically justified manner, taking into account environmental considerations. As can be seen from the above definition, the power system must be characterized primarily by the continuity of electricity supply, and the power company is obliged to provide it. These obligations result from Article 9 of the Energy Law Act, which contains the requirements that are imposed on the energy company, and these are:
• to generate electricity or to be prepared to generate it;
• having a power reserve;
• the ability of energy sources to produce energy in the amount resulting from the concluded agreements;
• informing the power system operators about the condition of the generation equipment.
The notion of continuity of electricity supply is also associated with a state in which such continuity is not ensured. Such a period is called a power outage. Consumers expect power cuts to be as short and rare as possible, while maintaining a low electricity price.
These issues are the subject of constant discussion, which is due, inter alia, to the fact that depending on the type of customer (whether they are utilities or industrial customers), the requirements for continuity of energy supply vary.
Electricity supply interruption indicators
The main electricity quality indicators associated with power outages are: SAIDI, SAIFI and MAIFI. These indicators are also provided in the annual reports prepared by electricity distribution companies.
SAIDI (System Average Interruption Duration Index) – indicator of the average system duration of a long interruption in electricity supply, expressed in minutes per customer

where: Ui – annual time of the i-th break, Ni – number of customers affected by the break, NT – the total number of customers.
SAIFI (System Average Interruption Frequency Index) – average frequency of long interruptions in energy supply. It does not include intervals of less than 3 minutes and shall be determined separately for planned and unplanned outages. It shall be given in the number of interruptions per customer:

where: λi – annual number of breaks planned or not planned, Ni – number of customers affected by the break, NT – the total number of customers.
MAIFI (Momentary Average Interruption Frequency Index) – average frequency of short interruptions in electricity supply. Calculated as the ratio of short interruptions to the number of consumers:

where: Ai – annual number of the short breaks, Ni – number of customers affected by the break, NT – the total number of customers.
Besides SAIFI, SAIDI, MAIFI, other indicators are used, such as ENS, AIT, ASAI, ASUI. All of them will be discussed below, as well as their calculation.
ENS (Energy Not Supplied) – is the value of energy not supplied to consumers as a result of interruptions:
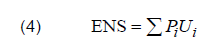
where: Pi – power not delivered, Ui – duration of i-th break.
AIT (Average Interruption Time) is a measure of the time during which energy is not delivered to consumers:
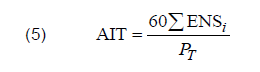
where: ENSi – amount of the energy not delivered in i-th case, PT – average power delivered to the customers.
ASAI (Average Service Availability Index) – is the average time of availability of electricity supplies:

where: Ui – annual break time of the i-th customer, Ni – number of customers.
ASUI (Average Service Unavailability Index) – it is the average time of unavailability of electricity supplies:
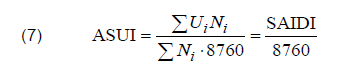
where: Ui – annual break time of the i-th customer, Ni – number of customers.
The values of these indicators should be as small as possible, as this would indicate that there are no interruptions of electricity supply, or that they are negligible.
In addition to the basic indicators given, more detailed versions are also given, for example, those that take into account the type of gaps (planned, unplanned, etc.) or refer to economic indicators (e.g. GDP) and determine the losses incurred in the economy. These are e.g:
• SAIDI BK – SAIDI for unplanned breaks without catastrophic breaks
• SAIDI P – SAIDI for planned breaks
• SAIDI K – SAIDI for unplanned breaks with catastrophic breaks
• SAIFI BK – SAIFI for unplanned breaks without catastrophic breaks
• SAIFI P – SAIFI for planned breaks
• SAIFI K – SAIFI for unplanned breaks with catastrophic breaks.
The electricity market in Poland
In Poland, there are five large distribution system operators whose number of customers ranges from 1 to approximately 5.5 million. The remaining DSOs provide services of a much smaller range. However, their market share is significant (about 25%). Therefore, it is important that both groups of DSOs supply electricity to their customers in an uninterrupted and continuous manner, which is confirmed by the lowest possible values of the discussed indicators. Table 1 presents data related to mentioned five DSOs and their customers. [7]
Table 1. Characteristics of large DSOs in Poland

SAIDI, SAIFI and MAIFI indicators for selected DSOs
Table 2 contains aggregate SAIDI data for both planned and unplanned (including catastrophic) disruptions for the 5 largest DSOs in Poland in 2012÷2018, which are graphically shown in Figure 1.
Table 2. SAIDI for the 5 largest DSOs in Poland over the period 2012÷2018 [7÷12]
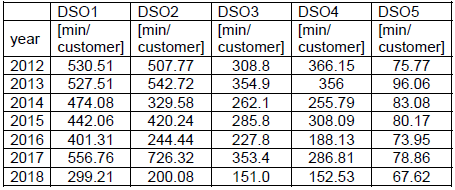
The analysis of SAIDI data (Fig. 1) shows that for 4 operators (DSO1 to DSO4) the trend is decreasing, while for DSO5, the ratio remains constant, at the lowest level compared to other DSOs. While in the years 2012-2016, a steady decrease can be observed in DSOs1, DSOs2, DSOs3 and DSOs4, despite the downward trend, there are also increases in some years. The exception for almost all operators is 2017, when each of them (except for DSO5) recorded a significant increase in SAIDI. The year 2017 was full of rapid weather phenomena in Poland (e.g. Ksawery Orkney) [12]. Since the general SAIDI index (including planned and unplanned interruptions, including catastrophic ones) was taken into account, the atmospheric factor undoubtedly contributed significantly to the increase in this index.

This is confirmed by the analysis of the SAIDI for planned interruptions (fig. 2). In 2018, all operators recorded the lowest SAIDI values for the period under consideration.

Another indicator analyzed is SAIFI for planned and unplanned (including catastrophic) interruptions. Table 3 contains aggregated operator data and Figure 3 illustrates this.
Table 3. SAIFI for the 5 largest DSOs in Poland over the period 2012÷2018 [7÷12]

Unlike SAIDI, SAIFI maintains a rather constant value with minor changes. It is difficult to determine the trend of changes in this indicator for the period 2012÷2018. Similarly to SAIDI, the indicator increased in 2017, but it was the maximum value in the audited period, only for DSOs1. It can be concluded that the number of interruptions varies slightly, but their length (SAIDI index) decreases, e.g. due to the use of new technologies during repairs and work under voltage, if possible.
The smallest values of SAIDI and SAIFI coefficients have a DSO5. It results from the fact that the operator operates in a much smaller area than the others and due to the specificity of this place (large city), cable lines have a much larger share in the infrastructure (nearly 87%). Due to the fact that the cable lines are effectively separated from the prevailing weather conditions, the operator is able to maintain the coefficients at such a low level.

Capital expenditures influence on SAIDI and SAIFI
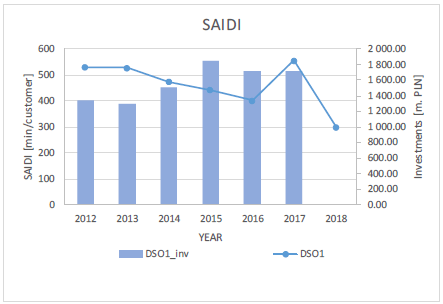
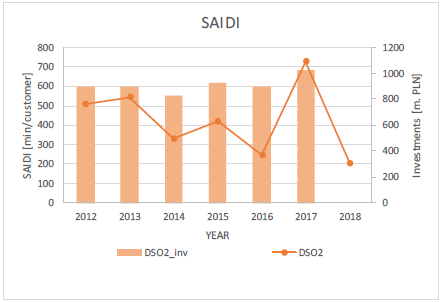
Figures 8÷12 show the value of SAIDI index in relation to investment outlays of selected distribution system operators.
Distribution System Operators have been maintaining a rather stable level of investment since 2012, with the exception of DSO3, which decreased investments twice in 2013. It is difficult to find, however, a visible impact on the SAIDI indicator of the funds allocated for network modernization. However, it can be concluded that fixed capital expenditures are conducive to the decrease of this ratio.


Summary
Electricity supply continuity indicators have an important role in the economy today. They make it possible to assess the quality of the service provided to the electricity consumer – securing the continuity of power supply. Their analysis makes it possible to determine whether the activities of distributors over the years have resulted in an improvement in supply conditions and to what extent it depends on the type of distributor.
In addition to indicators, DSOs also make available the amount of capital expenditures incurred. However, it is difficult to find any unambiguous positive impact on the indicators. Perhaps this is because the DSO, in order to reduce the unfavourable statistics, performs a lot of renovation or modernization works, but they are qualitatively questionable, which makes the durability of these investments much lower. SAIDI is also significantly affected by unplanned interruptions related to weather conditions and other damage.
A big disadvantage of the presented indicators is the exclusion of short breaks during their calculation, which from the point of view of the recipient are the most troublesome. Such short breaks often occur “one after the other”, which is particularly bad for large energy consumers, such as production plants.
REFERENCES
[1] Parol M., „Analiza poziomu niezawodności zasilania odbiorców w elektroenergetycznych sieciach dystrybucyjnych”, Przegląd Elektrotechniczny Nr 3/2017, pp. 1 – 6
[2] Olejnik B., Łowczowski K., „Techniczne metody poprawy współczynników SAIDI oraz SAIFI stosowane w sieci dystrybucyjnej”, Poznan University of Technology Academic Journals. Electrical Engineering Nr 86, 2016 pp. 165-176
[3] Halinka A., Niedopytalski M.,Rzepka P., Sowa P. and Szablicki M., “Expert evaluation method of the SAIDI normative reliability index,” 2015 Modern Electric Power Systems (MEPS), Wroclaw, 2015, pp. 1-4..
[4] E. van Schalkwyk, “The value of an incremental (mitigated) SAIDI minute,” 2010 20th Australasian Universities Power Engineering Conference, Christchurch, 2010, pp. 1-3.
[5] M. Kruithof, J. Hodemaekers and R. Van Dijk, “Quantitative risk assessment; A key to cost-effective SAIFI and SAIDI reduction,” CIRED 2005 – 18th International Conference and Exhibition on Electricity Distribution, Turin, Italy, 2005, pp. 1-5.
[6] V. Mariappan, A. B. S. M. Rayees and M. AlDahmi, “Earthing system analysis to improve protection system performance in distribution networks,” 12th IET International Conference on Developments in Power System Protection (DPSP 2014), Copenhagen, 2014, pp. 1-6.
[7] PTPiREE, “Energetyka. Dystrybucja i Przesył” http://ptpiree.pl/documents/2019/raport_ptpiree_2018.pdf
[8] https://pgedystrybucja.pl/
[9] https://www.tauron-dystrybucja.pl/
[10] https://www.energa-operator.pl/
[11] https://www.operator.enea.pl/
[12] https://www.innogy.pl/
[13] https://tvnmeteo.tvn24.pl/informacje-pogoda/polska,28/2017-year-w-pogodzie-zapamietamy-go-na-dlugo,249675,1,0.html
Authors: Małgorzata Łatka, PhD, Eng., Rzeszow University of Technology, Faculty of Electrical and Computer Engineering, W. Pola 2, 35-959 Rzeszów, E-mail: mlatka@prz.edu.pl; Marek Nowak MSc, Eng., Rzeszow University of Technology, Faculty of Electrical and Computer Engineering, W. Pola 2, 35-959 Rzeszów, E-mail: mnowak@prz.edu.pl;
Source & Publisher Item Identifier: PRZEGLĄD ELEKTROTECHNICZNY, ISSN 0033-2097, R. 96 NR 1/2020. doi:10.15199/48.2020.01.08
