Published by Oleksandr MIROSHNYK1, Andrzej SZAFRANIEC2, Kharkiv Petro Vasylenko National Technical University of Agriculture (1), Kazimierz Pulaski University of Technology and Humanities in Radom, Faculty of Transport, Electrical Engineering and Computer Science (2)
Abstract. Operation modes of 0.4/0.23 kV power supply systems are modelled using Monte Carlo method by means of Electronics Workbench software and statistical processing of simulation results and testing of the Pearson distribution law hypothesis using Mathcad are carried out. An analysis of existing power supply systems has been conducted and an alternative, economically feasible version of a power supply system is proposed, where consumers are supplied from low power transformers mounted on supports.
Streszczenie. Tryby pracy systemów zasilania 0,4/0,23 kV są modelowane stosując metodę Monte Carlo za pomocą programu Electronics Workbench, i przeprowadzane jest statystyczne przetwarzanie wyników symulacji i testowanie hipotezy prawa dystrybucji Pearsona za pomocą programu Mathcad. Przeprowadzono analizę istniejących systemów zasilania i zaproponowano alternatywną, ekonomiczną wersję systemu energetycznego, w którym odbiorcy są zasilani z transformatorów małej mocy zamontowanych na wspornikach. (Badanie trybów energooszczędnych w sieciach dystrybucyjnych 10/0,4 kV).
Keywords: current and voltage asymmetry, energy-saving power supply system, graphs of load, loss of electrical power, network of 0.4/0.23 kV.
Słowa kluczowe: asymetria prądu i napięcia, energooszczędny układ zasilania, diagram obciążenia, strata energii elektrycznej, sieć 0,4/0,23 kV.
Introduction
Improvement of the electric energy quality is a current problem in rural electrical networks with a voltage of 0.4/0.23 kV, inextricably linked with reduction of additional electric power losses which are caused by asymmetric phase load. Analysis of operating modes of rural networks with a voltage of 0.4/0.23 kV [1-3] showed that the current imbalance was due to the household load. This load is for the most part unevenly distributed over the phases of single-phase electric receivers which, as a rule, have random power consumption. Knowledge of current asymmetry in a network makes it possible to clarify levels of energy losses and, if possible, apply measures to reduce them [4, 5]. Modern computer software allows for modelling of unbalanced network modes and calculation of additional power losses, which are the result of asymmetric modes.
The aim of this study is to develop energy-saving modes of distribution networks in order to improve quality of electrical energy and reduce additional losses. Experimental Load changes of single-phase household consumers of electric energy are of a random nature and it is very difficult to accurately determine in advance their value at any time. It is possible only with a certain probability.
Even if single-phase consumers with the same power and equal total daily power consumption are distributed evenly, then due to the probabilistic nature of power consumption for any time in a three-phase supply network, one should always expect asymmetry of phase currents, and, as a consequence, of voltages.
In the asymmetric mode, the technical and economic performance of a network deteriorates sharply: energy losses increase, voltage deviations from nominal values and current flowing in the zero conductor cause appearance of significant potentials across electrical equipment enclosures connected to a zero wire, which leads to the danger of electric shock. Service life of asynchronous electric motors connected to such a network is dramatically reduced. In addition, a number of negative electromagnetic phenomena are observed both in the network and in the load. Thus, losses of active energy resulting from an uneven load of phases in 0.4/0.23 kV lines and consumer 6- 10/0.4 kV transformers increase by more than a third comparing with losses that would occur under a uniform load [4, 5].
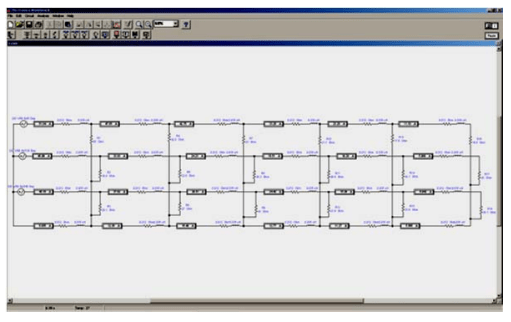
Consider a section of a three-phase four-wire overhead 0.4/0.23 kV line with a length of 210 m (six supports). One single-phase consumer is connected to each of the three phases at each support. The network is powered by a transformer whose secondary windings are connected in a “star with neutral wire” scheme. The circuit of the network is modelled in Electronics Workbench [6]. It represents three single-phase voltage sources connected in the “star with neutral wire” scheme, the initial phases of the sinusoid are equal to 0, 120, 240 degrees, respectively, resistance of aluminum wires of the overhead line sections between the points of consumer connection (for air lines it is the distance between supports) is represented by a row of series-connected impedances (R = 0.012 Ω, X = 0.011 Ω for AC35 wire).
The consumers are connected to the phase and zero wires, the consumers’ load resistances have the following values alternating in phases in different sequences on different supports: 20 Ω, 30 Ω, 40 Ω. The consumers are connected to the line in such a way that at the transformer substation 10/0.4 kV, the 0.4/0.23 kV line represents a symmetrical load.
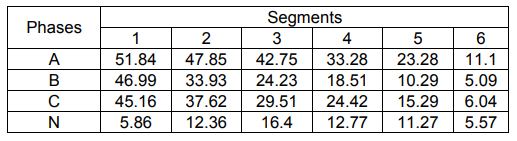
Considering that changes in the load of household consumers are random, subject to the normal distribution law of random variables, we will perform a statistical modelling of the network section scheme using the Monte Carlo method. An example of one test is shown in Figure 1, the current data are given in Table. 1.
Table 1 – Currents on network sections
Basing on 25 tests, we will perform statistical processing of modeling results and verification of hypothesis of the distribution law according to the Pearson criterion. To do this, we use the Mathcad program [7].
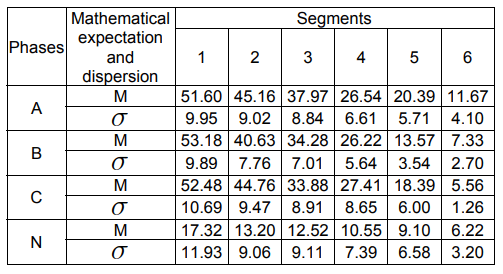
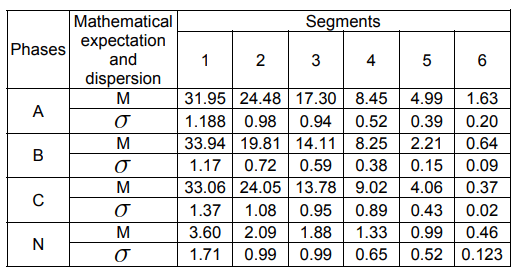
As a result of the statistical processing of the data, we obtain the following values of the mathematical expectation M and the current dispersion s (Table 2) and the electric power losses (Table 3) for the line sections of the 0.4/0.23 kV.
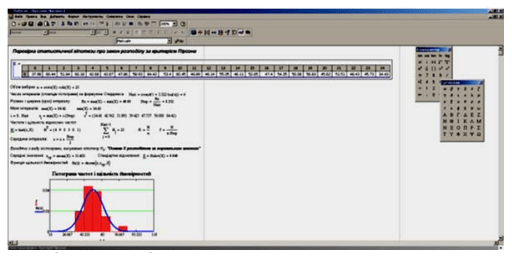
Thus, the performed studies show that the change in the load currents on the network segments and the electric energy losses in an asymmetrically loaded network of 0.4/0.23 kV are subject to the normal distribution law.
Table 2 – Mathematical expectation and dispersion of current across network segments
With increasing numbers of consumers, the length of the line and the magnitude of the currents flowing along the line increases, which leads to increasing in electric power losses. Therefore, there is a necessary to apply appropriate measures to reduce energy losses. Today, there are many devices for balancing the network, but all of them, because of their high cost and low reliability and inefficiency for long lines feeding the communal – household load, have not been widely used in networks 0.4/0.23 kV. Therefore, with the complete reconstruction of existing transmission lines or during constructing new transmission lines, it is necessary to shift to other power supply systems.
Table 3 – Mathematical expectation and dispersion of electric power losses across network segments
Electricity supply schemes and electrical networks configuration were formed in the middle of the last century, taking into account minimization of capital assets. This has led to their rapid physical deterioration.
Most electrical networks today require a complete replacement, since they have lost reliability, are physically obsolete, and do not meet the requirements of energy saving and safety. Therefore, it becomes necessary to use a system of maximum decentralization in reconstruction of existing or construction of new networks, which will significantly reduce losses and costs of investment.
Using Electronics Workbench [6] software, we will simulate operation of an existing traditional power supply system (Figure 3). Parameters of a three-phase four-wire overhead 0.4/0.23 kV line are the same as for the calculations shown in Figure 1. Its load resistances have the following values: 20 Ω, 30 Ω, 40 Ω. Initial phases of the sinusoid voltage are equal to 0, 120, 240 degrees, respectively. Consumers are connected between a phase conductor and the neutral conductor (3 consumers at the point of attachment, with different sizes in each phase).
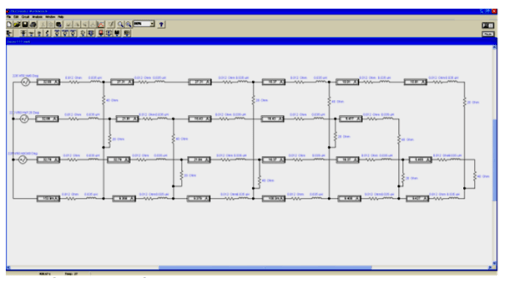
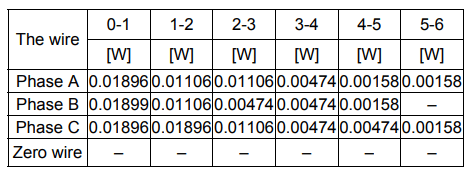
In the above diagram (Figure 3), a full phase segment of a 210 m long line is simulated (six supports, one-phase consumers are connected to each). Table 4 shows the power losses across each segment in the phase and zero wires.
Table 4 – Distribution of losses across wires in segments 0-1 to 5-6

Total losses in the network will be 105 watts.
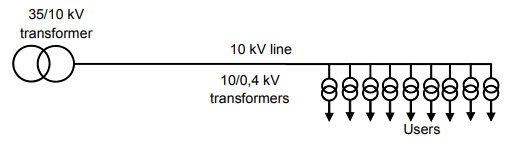
Now let us consider a network with the same loads, but with a voltage of 10 kV, in which 10/0.4 kV transformers are located directly on the supports [8]. A scheme in Figure 4 also models a full-phase segment of the 210 m long line. Table 5 shows power losses in each section of the network.
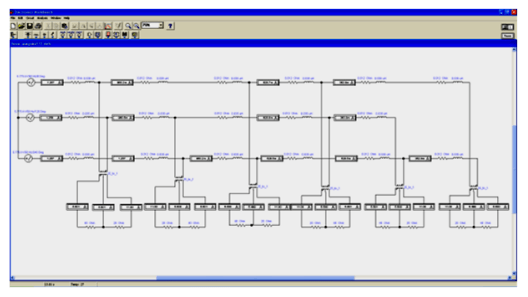
Table 5 – Distribution of losses across wires of sections 0-1 to 5-6
Total losses in the network will be 0.15 watts.
Comparison of the losses shows that, in the proposed network, they are 700 times lower (without taking into account losses in the transformers) than in the traditional power supply system. In addition, the number of wires in the proposed power supply system, is reduced by a quarter because three wires are needed instead of four.
Statistical studies show [9] that it is possible to adopt a network with one 10/0.4 kV transformer and an outgoing cable that has a household loading with length of 700 m as the mathematical expectation.
Let’s compare costs of these networks. Table 6 presents the cost of building a transformer substation and the cost of building 1 km of the line. The construction costs for substations and power transmission lines [10] are given in the Table. 6. The basic cost of a line consists of the cost of supports, wires, fittings, territory (the land cost allocated for a support or a substation), and labour. It is also necessary to take into account the cost of landscaping – 3%, design work – 8%, other work – 3.5%, inflation – 2%.
Table 6 – Indicators of the construction costs of substations and transmission lines
Let us consider the cost of building a power supply system for consumers supplied from a 0.4/0.23 kV network (Figure 5).

Let us define the cost of building such a power supply system. For the purposes of calculation, a 10km long 10 kV line and a 700m long 0.4 kV line (for 40 consumers) are taken into consideration.
The total cost of such a power supply system is €263 000. Let us now consider the cost of building a power system for recipients who are supplied from the proposed system shown in Figure 6.
Let’s assume a 10.7 km long 10 kV line (for 40 consumers). As a result, the cost of such a power supply system is € 261 000.
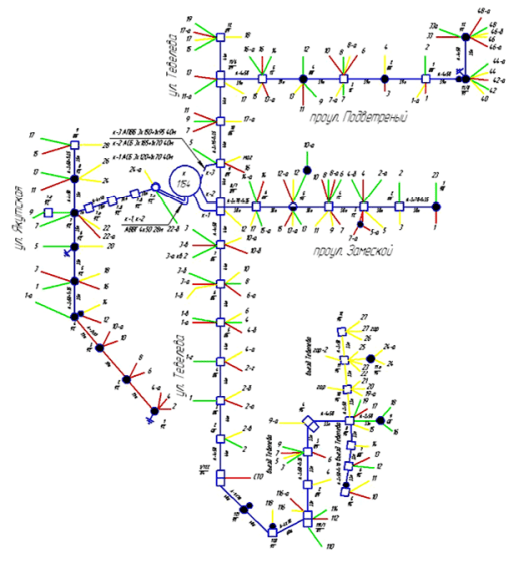
As a concrete example, we consider a real 0.4/0.23 kV power supply system of (Figure 7). To determine the level of current asymmetry, we simulate the operation of this power supply system in Multisim (Figure 8).
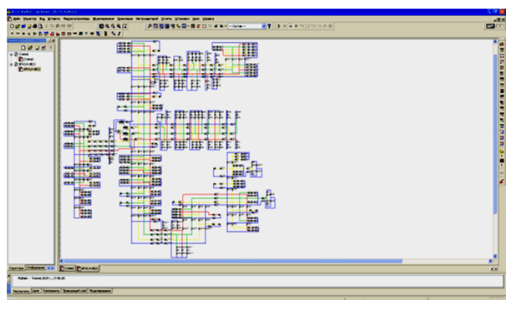

As a result of the simulation, the following phase currents in the head of the line: ІА = 83.3 А, ІВ = 59.5 А, ІС = 80.4 and the current in the zero wire ІN = 22.1 А are produced. The total losses in the network are 783.93 W.
Now we simulate the operation of an energy-saving power supply system with the same loads (Figure 9).
As a result of the simulation, the following phase currents in of the line: ІА = 3.31 А, ІВ = 3.67 А, ІС = 3.23 А are generated. The total losses in the wires of the power supply system are 2.03 W.
A comparative analysis of the power supply systems shows that consumers who use the proposed power supply system (from small power transformers installed on supports) have energy quality parameters that fully meet the required standards.
Conclusion
1. Our studies showed that variation of the load currents across the segments and losses of electric energy in an asymmetrically loaded 0.4/0.23 kV network are subject to the normal distribution law. As numbers of consumers rise, the length of the line and the magnitude of the currents along the line increase, which leads to greater power losses. Therefore, there is a need to apply appropriate measures to reduce energy losses.
2. The studies have shown that consumers of traditional power supply systems have an unsatisfactory quality of electrical energy (exceeding the coefficients of non-sinusoidal, zero and reverse sequences several times), high levels of voltage losses (unacceptable voltage deviations in remote consumers).
In addition, the energy losses across the wires of the proposed power supply system are much lower than in the traditional power supply system. Investment in both the projects is equally economical. Therefore, with a complete reconstruction of existing or construction of new transmission lines, it is necessary to shift to the proposed power supply system, which allows to significantly reduce electricity losses in the network, while ensuring higher energy quality indicators.
REFERENCES
[1] Bollen M., Definitions of Voltage Unbalance, IEEE Power Engineering Review, (2002), n.1, 49-50
[2] Faiz J., Ebrahimpour H., Precise Derating of Three-Phase Induction Motors with Unbalanced Voltages, Energy Conversion and Management, 48 (2007), 2579-2586
[3] Komada P., Trunova I., Miroshnyk O., Savchenko O., Shchur T., The incentive scheme for maintaining or improving power supply quality, Przegląd Elektrotechniczny, (2019), nr.5, 79-82
[4] Naumov I., Reducing losses and improvement of the quality of electric energy in rural distribution networks 0,38 kV by means of balancing devices, Dissertation of the Doctor of Technical Sciences, (2002), 05.20.02, Irkutsk, 387
[5] Tavakoli B., Kashefi, A., Three-Phase Unbalance of Distribution Systems: Complementary Analysis and Experimental Case Study, International Journal of Electrical Power & Energy Systems, 33 (2011), 817-826
[6] Miroshnyk O.O., Tymchuk S.O., Uniform distribution of loads in the electric system 0.38/0.22 KV using genetic algorithms, Technical Electrodynamics, Issue 4 (2013), 67-73
[7] Ochkov V., MathCAD 14 for students, engineers and designers, BHV-Petersburg, (2007), 368
[8] Faiz J., Ebrahimpour H., Influence of Unbalanced Voltage Supple on Efficiency of Three Phase Squirrel Cage Induction Motor and Economic Analysis. IEEE Transactions on Energy Conversion, 47 (2006), 289-302
[9] Tymchuk S., Miroshnyk O., Calculation of energy losses in relation to its quality in fuzzy form in rural distribution networks, Eastern-European Journal of Enterprise Technologies, 1(8) (2015), 4-10
[10] Kholiddinov, Ilkombek, Khosiljonovich, Electric Power Quality Analysis 6-10/0.4 kV Distribution Network, Energy and Power Engineering, (2016), Vol.8 n.6, 263-269
[11] Miroshnyk O., Łukasik Z., Szafraniec A., Lezhniuk P., Kovalyshyn S., Shchur T., Reducing the
dissymmetry of load currents in electrical networks 0,4/0,23 kV using artificial neural networks, Przegląd Elektrotechniczny, 95 (2019), nr 11, 245-249
[12] Szafraniec A., Mathematical modelling of transient electromagnetic processes in a power network, IEEE Xplore, (2019), 232-236
[13] Driesen J., Belmans R., Distributed generation in future grids: Will “Energy Islands” become a reality, Electrical Power Quality and Utilisation Magazine, (2005), Vol.1, (1), 11-14
[14] Almasalma H., Claeys S., Deconinck G., Mikhaylov K., Haapola J., Pouttu A., Experimental
Validation of Peer-to-Peer Distributed Voltage Control System, Energies, (2018), (11), 1304-1325
[15] Efkarpidis N, De Rybel T, Driesen J., Technical assessment of centralized and localized voltage control
strategies in low voltage networks, Sustainable Energy, Grids and Networks, (2016), (8), 85-97
[16] Hoornaert F., D’hulst R., Vingerhoets P., Vanthournout K., Driesen J., LV distribution network voltage control mechanism: Analysis of large-scale field-test, Sustainable Energy, Grids and Networks, (2016), (6), 7-13
Authors: prof. dr hab. inż. Oleksandr Miroshnyk, Kharkiv Petro Vasylenko National Technical University of Agriculture, Alchevskyh, 44, Kharkiv, 61002 Ukraine, E-mail: omiroshnyk@ukr.net, dr inż. Andrzej Szafraniec UTH Radom, Faculty of Transport, Electrical Engineering and Computer Science, ul. Malczewskiego 29, 26-600 Radom, E-mail: a.szafraniec@uthrad.pl
Source & Publisher Item Identifier: PRZEGLĄD ELEKTROTECHNICZNY, ISSN 0033-2097, R. 96 NR 4/2020. doi:10.15199/48.2020.04.36
