Published by Dariusz SAJEWICZ1, Augustyn WÓJCIK2, Piotr ZEGADLO3,
Bialystok University of Technology (1), Warsaw University of Technology (2), Kozminski University (3)
ORCID: 1.0000-0002-3488-5674; 2.0000-0003-0597-1634; 3.0000-0002-0219-297X
Abstract. The aim of this paper is to demonstrate the effectiveness of newly developed fault detection methods based on a simple statistical approach encompassing linear discriminant analysis and signal processing. Fault prediction relates to the detection of: the type of operation of the medium voltage network, leakage (damaged insulator in the line string) and a measure of the distance of ground fault in an unbranched line, in a branched line and on its branches. The conducted research confirms the high efficiency of detection faults in all areas concerned.
Streszczenie. Celem pracy jest wykazanie skuteczności nowo opracowanych metod detekcji uszkodzeń opartych na prostym podejściu statystycznym obejmującym liniową analizę dyskryminacyjną i przetwarzanie sygnałów. Przeprowadzone badania potwierdzają wysoką skuteczność wykrywania uszkodzeń we wszystkich rozpatrywanych obszarach. (Wykrywanie zdarzeń awaryjnych w sieciach SN na podstawie analizy danych z rejestratorów zakłóceń.
Keywords: fault detection; linear discriminant analysis; high resistance fault; medium voltage network.
Słowa kluczowe: wykrywanie uszkodzeń; liniowa analiza dyskryminacyjna; uszkodzenie wysokorezystancyjne; sieć średniego napięcia.
Introduction
Today’s power systems are becoming increasingly unmanned and, at the same time, saturated with control and monitoring systems, with the consequent aim of increasing reliability, availability, lifespan and meeting other power quality indicators. This is a key power system design concept linked to risk management. Currently, the goal of distribution companies is to minimize contingencies and outages in power grids and at the same time improve power continuity indices such as the System Average Interruption Duration Index (SAIDI) or the System Average Interruption Frequency Index (SAIFI).
Some failures are predictable before they occur, so responding at this stage makes it possible to reduce power outages. To this end, power equipment should be equipped with an intelligent metering tool that will play an important role in making decisions about grid operation and maintenance.
The country’s power industry, both industrial and commercial, requires the introduction of modern High Voltage / Medium Voltage (HV/MV) substations and the modernization of existing ones, since most of the equipment currently operating in the networks should be immediately withdrawn from the power system due to outdated systems and the lack of advanced measurement tools. Currently, the HV/MV substations are equipped with protections that operate on the basis of current and voltage measurements.
The protections are currently installed in HV/MV substations and they work with current measurements of currents and voltages and on this basis they generate the signal to switch off (open), but only in case of emergency. Some currently available devices enable recording of only this type of events, which is often insufficient for the analysis of the situation that occurred before the protections were triggered. Both the operation of protections and the analysis of causes are currently performed after the occurrence of the event.
The research work presented within the paper is aimed at increasing the range of recorded data, their current analysis and prediction of failure events in medium voltage networks. Fault prediction relates to the detection of: the type of operation of the medium voltage network, leakage (damaged insulator in the line) and a measure of the distance of ground fault in an unbranched line, in a branched line and on its branches. This will increase the reliability of substation operation, shorten the no-voltage interruptions, and in the case of a fault occurrence will allow a quick and precise analysis of the causes and location of the fault occurrence.
Literature review
Fault diagnosis in medium voltage grids is difficult due to their extensive nature, inefficiently earthed neutral point and numerous branches. In the literature, there are various approaches to this kind of subject, starting from taking into account the type of network – isolated, compensated and earthed [1], detect arc faults [2,3] and high-resistance faults [4,5]. Data for modeling are often extracted from mathematical models of networks using PSCAD/EMTDC [3] or MATLAB [1] software. A variety of statistical methods can be effectively used for fault detection – including relatively simple approaches such as logistic regression or linear discriminant analysis [6] to more complex methods based on modeling the phasor angles across the buses as a Markov random field (MRF) [7]. Then the effectiveness of the developed method is simulated or laboratory tests are performed for further validation.
This paper aims to demonstrate the high effectiveness of newly developed fault detection methods based on a simple statistical approach encompassing linear discriminant analysis and appropriate signal processing. The methods are applied to the waveforms obtained from fault recorders and a laboratory model of a medium voltage grid including an overhead line and two cables and a cable branch in the overhead line. In this study, three algorithms were developed: network type detection, high-resistance fault detection and ground fault distance detection from HV/MV stations.
Medium voltage line model
Disturbances in the operation of the protected object occur quite rarely, therefore it is difficult to obtain examples characterizing the operation of the object under fault conditions. Preparation of appropriate training data using simulation systems or laboratory models may be helpful then.
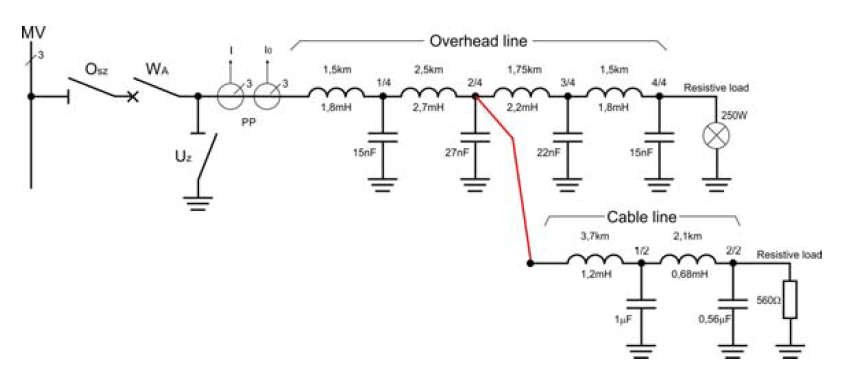
The protected object (Fig.1), a 15kV MV line, was represented by an electrical model in the form of four segments with focused parameters: reactance and line capacitance.
The calculation data were obtained from the line construction data. The values of individual parameters of the line model were determined taking into account: type, cross-section of working conductors, type of slopes (distance between conductors and between conductors and ground) and type of ground. The parameters were determined and a model of MV line was built containing four overhead sections with lengths of 1.5, 2.5, 1.75 and 1.5km. The preload of active power at the end of the simulated line was three 250W bulbs associated in a star. The test stand was equipped with a field controller with a disturbance recorder with a sampling frequency of 1.6kHz (Fig.2).

The construction of a laboratory model of MV line allowed to obtain the waveforms from the disturbance recorder reproducing the operation of a medium-voltage line in an isolated network, compensated and grounded by a resistor with a better resolution of registration. The test stand has generated about 300 high-resistive registrations of ground faults eliminated by means of the ground fault and admittance protection.

The next stage of work was further extension of the line model by adding a branch (cable section) in order to recognize its influence on the possibility of fault detection (Fig.3). The branch line was incorporated into the MV line model at a distance of 4km from the HV/MV power stations. Approximately 6km of cable line was modelled with symmetrically loaded resistive load in the form of three 560Ω resistors connected in a star at the end. The branch line was divided into two sections with lengths of 3.7km and 2.1km. The next step was to generate another ca. 300 registrations of ground faults in the branched network, eliminated by means of earth fault protection, where the line faults of resistive character were simulated.
Signal Processing Method
The purpose of the signal processing method is to determine the properties of recorded currents and voltages for further use in fault detection. Metrics used for fault identification should meet two criteria. Firstly, they have to be as similar as possible for many observations of the same type of faults. Secondly, it is expected that such metrics will have different values for different types of faults. As a result of using the signal processing method, a signature is obtained. Signature is a vector of characteristic quantities (numbers) describing the properties of signals important for recognizing the type of damage. The measurement data processing algorithm (Fig. 4) consists of four steps. Firstly, recorded signals are divided into time windows. This step is necessary to precisely separate parts of the signal occurring before and during the failure. Then, auxiliary measurement quantities are calculated: admittance and phase shift. The last step is calculation of metrics characterizing the fault. The result of the processing method is the fault’s signature. Details about each step of signal processing method are discussed in the following sections.

Time Windows
The fault recording is triggered by activation of the ground fault circuit protection (P_I0>1). There are three segments visible in obtained waveforms: before the fault, during the fault and after the protection is triggered. In order to accurately characterize the fault, signal metrics should be determined within the aforementioned signal segments. Therefore, for further processing, signals are portioned into 2 time windows:
• before damage (BF), lasting around 200ms,
• during damage (IN), lasting around 250ms.
The boundary between the windows BF and IN is determined by the moment in which the digital signal P_I0> 1 achieves the value of 1. The end of window IN is determined by the moments when the triggering of the ground fault protection (Z_I0>1) achieves the value of 1. Time windows are shifted relative to the mentioned digital signals to omit transients at the start and the end of the damage. Fig. 5 shows recorded waveforms with marked time windows.

Admittance
In order to calculate this quantity, the RMS of current and voltage values are determined. Admittance is calculated as the ratio of current to voltage for each considered time moment.
Phase shift
The phase shift of current and voltage signals is determined in several steps. Firstly, Fourier Transform F{•} of the current and voltage signals for each time moment n is determined according to (1) and (2):
(1) I(n) = F {i( n…n + N50)}
(2) U(n) = F {u( n…n + N50)}
Spectrum is calculated in N50 samples long window, where N50 is one period of fundamental harmonic (50Hz). In the next step, differences between voltage phase spectrum and current phase spectrum are calculated according to (3):
(3) Δφ(n) = arg{U(n)} – arg{I(n)}
Metrics were calculated using phase shift for fundamental component of 50 Hz.
Metrics calculation
Metrics are calculated using the auxiliary measurement quantities in one time window. The following five parameters are determined:
• Y0_RMS_AVG_IN – the average admittance during the damage occurrence (IN),
• FI0_50HZ_AVG_BF – the average phase shift of the current relative to the voltage for zero sequence component in the time window before damage (BF),
• FI_50HZ_AVG_MAX_IN – the average phase shift of the current relative to the voltage for the phase (L1, L2 or L3) for which the highest average admittance was obtained, during the damage occurrence (IN),
• FI_50HZ_AVG_SUM_IN – the average sum of phase shifts for all phases (L1, L2 and L3) during the damage occurrence (IN),
• FI0_50HZ_MEDIAN_IN – the median phase shift of the current relative to the voltage for zero sequence component during the damage occurrence (IN).
Fault Detection Procedure Leakage
The first step in the proposed fault detection procedure entails the detection of leakage in the grid, which is not severe enough to trigger safety measures. In the presence of such a fault, the values of certain other analyzed metrics may be noisier and more difficult to interpret. Moreover, the possibility of detecting leakage is valuable in itself for the sake of the line’s reliability.
Regardless of the grid type and length, in case of leakage, significantly higher values of the FI0_50HZ_AVG_BF are observed in the sample (Fig. 6.). This allows for flawless detection of this type of fault, as shown in Table I.
Table 1. Detecting leakage with the FI0_50HZ_AVG_BF


Network type
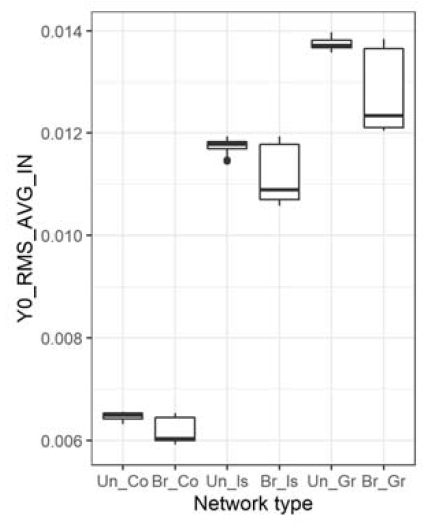
Next, identification of the network type is performed. In applications when the type is known, this step may be redundant. However, it may be necessary for fully automated examination of data stemming from a variety of different sources. Metric Y0_RMS_AVG_IN uniquely identifies the network type for a given line length, as shown in Table II, although some of the largest metric values for unbranched isolated network are close to the smallest values for branched grounded network (Fig. 7.). Moreover, in case of branched lines, the presence of leakage pushes the metric values up slightly.
Table 2. Detecting network type with the use of the Y0_RMS_AVG_IN METRIC

Ground fault location
Having checked for leakage and with the network type known, we are able to identify incident location in case of a ground fault when using our main 5 metrics. To this end, multi-class linear discriminant analysis (LDA) is applied.
Table III. presents the confusion matrix for the LDA classification output aimed at locating ground faults in the unbranched line. The performance is virtually flawless, with accuracy standing at 98.6%. The errors appear only for neighboring locations.
Table 3. Confusion matrix for the LDA model of fault location (Unbranch line)

Locating ground faults in the branched line proves to be a more difficult task (Table IV.). Faults located on the main line near the fork (2/4 of the main line) are occasionally confused with faults located in the branch. The branch also makes it harder to detect faults behind the fork in the line – hence the relatively large number of mistakes for the faults located in locations 3/4 and 4/4. Still, the classifier achieves a satisfactory accuracy of 85.6%, with errors again generally appearing for neighboring locations.
Table 4. Confusion matrix for the LDA model of fault locations (Branch line)

Conclusion
The research was conducted on data from a disturbance recorder on a laboratory test stand. Our results indicate that detection of high-resistance faults and location of ground faults in MV lines can be performed with high accuracy using a relatively simple set of statistical tools. Appropriate signal processing prior to statistical modelling is the key to this methodology. This is especially true for real-life applications outside a laboratory, where the data is noisier and the lines themselves exhibit diverse structural characteristics.
Acknowledgments The paper is the result of research work carried out by Elektrometal Energetyka S.A. as part of the project “Construction of integrated systems supporting and optimizing the work and safety of MV switchgear” PROJECT CO-FINANCED BY THE EUROPEAN UNION FROM THE MEANS OF THE EUROPEAN REGIONAL DEVELOPMENT FUND UNDER THE PRIORITY Axis I “The use of research and development activities in the economy” OF THE REGIONAL OPERATIONAL PROGRAMME OF THE MAZOWIECKIE VOIVODSHIP 2014-2020″.
REFERENCES
1. Eduardo F. Ferreiraa, J. Dionísio Barrosb, ”Faults Monitoring System in the Electric Power Grid of Medium Voltage”, Procedia Computer Science, vol. 130, pp. 696-703, 2018.
2. S. Hamid Mortazavi, Zahra Moravej, S. Mohammad Shahrtash, “A Searching Based Method for Locating High Impedance Arcing Fault in Distribution Networks”, Power Delivery IEEE Transactions on, vol. 34, no. 2, pp. 438-447, 2019.
3. Wenhai Zhang, Yindi Jing, Xianyong Xiao, ”Model-Based General Arcing Fault Detection in Medium-Voltage Distribution Lines” IEEE Transactions on Power Delivery vol. 31, no. 3, pp. 2231 – 2241, 2016.
4. Mingjie Wei, Weisheng Liu, Hengxu Zhang, Fang Shi, Weijiang Chen, “Distortion-Based Detection of High Impedance Fault in Distribution Systems”, Power Delivery IEEE Transactions on, vol. 36, no. 3, pp. 1603-1618, 2021.
5. Masa, A. V.; Werben, S.; Maun, J.C. Incorporation of Data- Mining in Protection Technology for High Impedance Fault Detection. // IEEE Power and Energy Society General Meeting, San Diego, California, July 22-26, 2012.
6. Y. Cai and M. Chow, “Exploratory analysis of massive data for distribution fault diagnosis in smart grids,” 2009 IEEE Power & Energy Society General Meeting, 2009, pp. 1-6, doi: 10.1109/PES.2009.5275689.
7. Miao He, Junshan Zhang, ”A Dependency Graph Approach for Fault Detection and Localization Towards Secure Smart Grid” IEEE Transactions on Smart Grid, vol. 2, no. 2, pp. 342 – 351, 2011.
Authors: dr inż. Dariusz Sajewicz, Bialystok University of Technology, Faculty of Electrical Engineering, Białystok, Poland, Email: d.sajewicz@pb.edu.pl; mgr inż. Augustyn Wójcik, Institute of Radioelectronics and Multimedia Technologies, Warsaw University of Technology Warsaw, Poland, E-mail: a.wojcik@ire.pw.edu.pl; dr Piotr Zegadło, Kozminski University, Warsaw, Poland, E-mail: pzegadlo@kozminski.edu.pl
Source & Publisher Item Identifier: PRZEGLĄD ELEKTROTECHNICZNY, ISSN 0033-2097, R. 98 NR 3/2022. doi:10.15199/48.2022.03.30
