Published by Grzegorz WĘGRZYN1, Robert SZCZYGIEŁ,AGH2, University of Science and Technology. ORCID: 1. 0000-0002-4132-4939; 2. 0000-0001-6342–0107
Abstract. This paper presents a concept of noised signal voltage measurement using noise distribution. The goal of this project was to work out a new solution for low noise, hybrid pixel detectors that work in single photon counting mode. The objective of the developed solution is to increase the energy resolution of the detector. This technique was originally developed for a hybrid detector but can be successfully applied to any circuit. The method described is to fit the distribution curve to the measured noise spectrum, and thus to accurately calculate the signal voltage.
Streszczenie. Referat przedstawia koncepcję metody pomiaru napięcia sygnału zaszumionego wykorzystującą pomiar widma szumu. Celem tej pracy było opracowanie nowego rozwiązania dla niskoszumnych, pikselowych hybrydowych detektorów promieniowania X, pracujących w trybie zliczania pojedynczych fotonów, które pozwoli na uzyskanie wyższej rozdzielczości energetycznych. Metoda ta może być również z powodzeniem wykorzystywana w innych aplikacjach. Opisywana technika bazuje na dopasowaniu krzywej rozkładu normalnego do zmierzonego szumu, a tym samym precyzyjne wyznaczenia wartości mierzonego napięcia. (Pomiar napięcia z wykorzystaniem szumu)
Keywords: voltage measurement, noise, pixel detectors
Słowa kluczowe: pomiar napięcia, szum, detektory pikselowe.
Introduction
The article presents a concept of measuring the voltage of a noisy signal using the noise distribution. The main goal of the project was to work out a new solution to increase the energy resolution in hybrid pixel detectors that work in single-photon counting mode. In this paper, we describe the basic idea of the proposed method based on the measurement of the noise distribution and further signal voltage computing. We show how the noise can be used to determine the signal amplitude. Next, we present an example system schematic with appropriate requirements and limitations for pixel detectors. Then we discuss the verification methodology and show the simulation results. The main limitation of the proposed solution – the dynamic range – is also discussed in this paper.
Hybrid Pixel Detectors
Hybrid pixel detectors, firstly implemented in [1], were originally used in high-energy physics experiments for tracking and measuring the energy of particles that hit the detector. Nowadays, after 30 years of development, they are implemented in many other areas of science and industry, like astronomy, medicine, or material engineering, where are successfully used as imaging and measurement systems. Described detectors are systems composed of two main parts: a pixelated semiconductor detector layer (often called simply a “sensor”) and an integrated circuit with a separate read-out channel for each pixel (Fig. 1a). Looking deeper, we will see that the signal processing chain consists of: an amplifier (commonly implemented in charge-sensitive architecture), a block of shapers (filters), and analog-to-digital converters (discriminators, in the simplest case) as shown in Fig. 1b.
One of the main parameters describing hybrid pixel detectors is the energy resolution. It describes the ability to differentiate two events with similar energy. The parameter that most influences the energy resolution is the noise of the readout system, usually expressed as equivalent-noise-charge (ENC). There are many possible solutions for improving ENC in hybrid pixel detectors. The first type is strictly related to design and layout techniques. For example, the preamplifier design, its architecture, capacitance matching to the detector, and a feedback circuit are essential for the system noise level [2][3]. Other’s techniques focus on implementing additional filters and shapers to the signal processing chain, improving signal-to-noise ratio (SNR) [2][3][4].
Currently, voltage measurement of the amplified (and optionally filtered) signal in hybrid pixel detectors is done by analog-to-digital converters (on- or off-chip) or using a user defined energy window. These windows are implemented as a set of comparators with different threshold levels [5], each one connected to a different counter. The results of counted events are subtracted and as a result, we get the number of events from some specified range/window.
Theory
The proposed technique can be formulated as a measurement of the noise distribution and fitting the distribution curve to the collected data. This definition can be split into two parts. The first one, measurement of the noise distribution, is the object of interest of this work, and the second one is about fitting the distribution curve. The curve fitting can be easily implemented in many ways outside the chip, so it won’t be discussed in detail in this work.
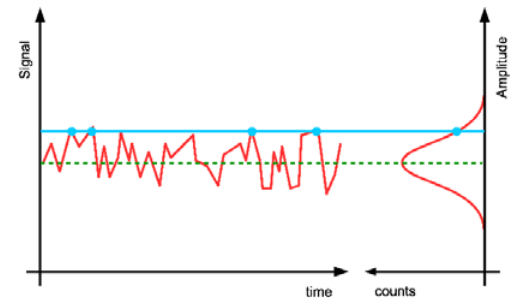
Assuming an ideal constant signal with superimposed noise, the probability distribution can be treated as Gaussian distribution [6] as shown in Fig. 2. In the proposed technique, the measurement of the noise distribution is performed by counting the exceedance of the threshold (Fig. \ref{fig:noise_distribution} – blue lines and dots) for several threshold levels. Measurement can be conducted in two basic concepts: the first one – parallel – assumes an equal number of comparators, each set at different thresholds, the second one – serial – when a single comparator is switching between the threshold levels. There is also possible a combination of these two methods, depending on the system requirements for power, area, and speed.
In the next step, the system fits the distribution curve to the collected data. As it was mentioned before, we are assuming the Gaussian distribution of the noise:
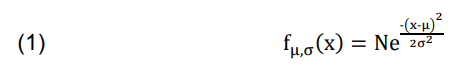
with 3 unknown variables: the scaling factor N, the mean value µ, and the standard deviation σ. The accuracy of fitting depends on the number of measuring points (at least 3, because of 3 unknown variables), its position on the fitted curve, and the measurement time. The signal value that we are looking for is the mean of the obtained distribution.
Exemplary System Implementation
Regarding the hybrid pixel detector application requirements, limitations, and driven by a desire for implementation of the considered method, the following system was proposed.
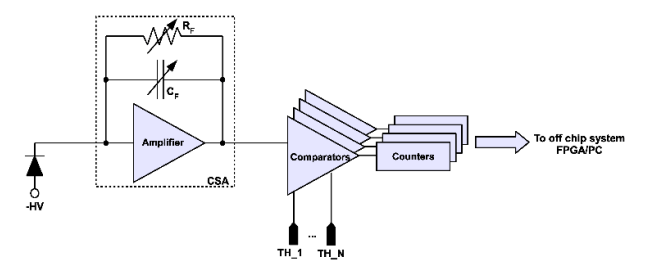
The input stage is implemented as a charge-sensitive amplifier (CSA), working in charge integration mode. It means that the amplifier produces voltage steps at the output as the response to the input current pulses from the detector. The flat output signal requirement is important because of the proper noise distribution recording. In the case when the output signal contains a trailing edge, comparators with fixed threshold levels will raise events incorrectly due to the not stationary nature of the signal. The second issue that can occur while the feedback capacitance of CSA is not discharged is the saturation of the amplifier. Each particle that hits the detector is generating some charge that is integrated in the feedback capacitor. If several events will be added, then the voltage on the feedback capacitor will be too high and the amplifier will leave the operation point. To avoid this, the feedback capacitor should be discharged instantly after the measurement is done. Therefore, an additional CSA resetting circuit should be provided.
The next block is a set of comparators that will execute the measurement of the noise distribution. The selection of the number of comparators and their threshold levels depends on the selected measurement technique (parallel, series or mixed methods shortly described earlier) as well as on the desired (and possible to achieve) resolution and expected dynamic range. Chosen comparators should be fast enough to record all, often extremely sharp, transitions of the noise to provide proper distribution reconstruction.
The signal processing chain ends with a bank of counters that will count and store the comparators’ events. The process of fitting the distribution curve can be executed outside the detector chip, for example, in FPGA or PC. An exemplary system schematic is shown in Fig. 3.
Verification
Because the described method is not yet implemented in a real circuit, we conducted simulations using an ideal model for confirmation of its usefulness. The model, written in Python language, assumes that:
1. the CSA amplifier works in charge integration mode, which means that we will see voltage steps at its out-put,
2. the comparators are ideal with infinite speed and without metastability,
3. there are no pileup events.
The testbench allows permuting through all key parameters: signal amplitude, noise RMS value, measurement time, number of comparators, and threshold level distribution. In the conducted simulations, we focused on determining the influence of the mentioned parameters on the pro-posed method. It is worth pointing out that the noise vector was generated using a real, implemented in CMOS 40 nm process, CSA circuit with resistive feedback using industry-standard simulator. The generated vector was then imported into our model and added to the ideal signal. Thanks to that, our simulations cover the real noise spectrum, possibly to achieve in real circuits.
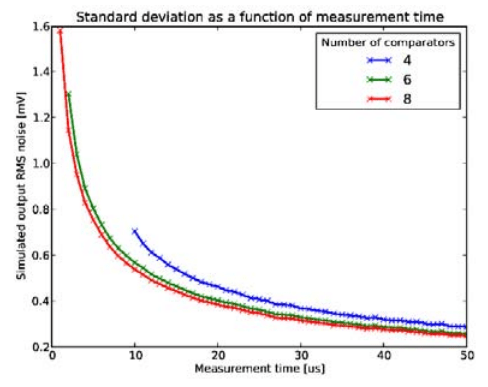
For a precisely fitted distribution curve, we need to record as many events as possible in each measuring point to provide enough statistical data. Therefore, we want to maximize the measurement time. This need is in contradiction with the other important parameter of hybrid pixel detectors: the count rate. It describes the maximum intensity of events that can be processed without accuracy loss and other un-wanted effects. The count rate is strictly related to the speed and the dead time of the signal processing chain. Low noise detectors operate in a range from 100 to 100k Hz, which al-lows setting the time for collecting statistical data in the range from 10 μs to 1ms. In Fig. 4, we show the effectiveness of the described method as a function of the measurement time, where time is swept in the range from 1 μs to 50 μs. As we can see in the figure, the number of comparators has no big impact on the measurement when considering the ideal comparator model. It will be more important in the real circuit simulations when comparator mismatches will occur.
One of the limitations of the described technique is the dynamic range. The measurement range is defined as the distance between the lowest and the highest threshold level. The main limitations stem from area requirements and the need to keep the low spacing between the threshold levels. In hybrid pixel detectors, we want to achieve high spatial resolution, so the pixel area should be as small as possible. This limits the number of comparators implemented in a single pixel. The second ingredient, low spacing between the threshold levels, is related to the CSA output signal noise RMS. Thresholds must be distributed close enough to provide enough points for the reconstruction of the distribution curve (Fig. 5a) but if we bring the thresholds closer, then we lose the dynamic range. Interestingly, the dynamic range can be slightly extended by increasing the circuit noise (Fig. 5b).

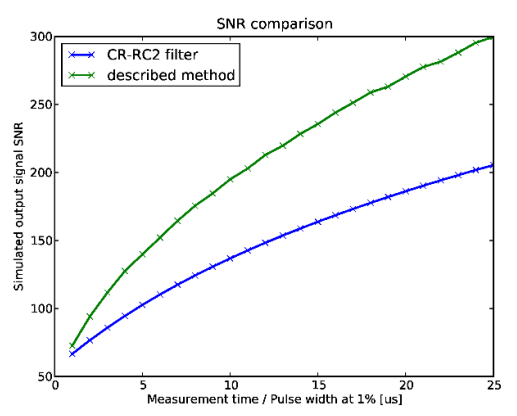
One of the most common methods for improving the energy resolution in hybrid pixel detectors is the CR-RC2 filter. The comparison of the SNR parameter of the proposed method with the CR-RC2 ideal model can be found in Fig. 6. Based on the picture, we can conclude that the proposed method achieves better performance for measurement time higher than 1 µs. The followed comparison was conducted with parameters: the CSA output signal amplitude and the signal noise RMS equals 100 mV and 10 mV respectively, and 4 comparators with 10 mV threshold levels spacing.
Conclusion
The discussed method offers a new approach for accurate voltage measurement. The method uses the signal noise distribution measured by counting the number of crossings of a set of reference voltage levels. The method theoretically allows increasing the SNR up to 30 times in the considered measurement time range 1 µs – 25 µs, which is up to 30% better than widely used CR-RC2 filters.
The main limitation of this technique, the dynamic range, was discussed. In the context of hybrid pixel detectors, this solution can be considered as a method for increasing energy resolution as the hardware requirements are small enough to fit the circuit in the 50-100 µm pixel pitch. Further work will focus on implementing the circuit in a real circuit and on searching for a solution for increasing the dynamic range.
Acknowledgments. The presented work has been supported by the Ministry of Science and Education, Poland under contract no.0138/DIA/2020/49.
REFERENCES
[1] Anghinolfi, F., et. al., A 1006 Element Hybrid Silicon Pixel Detector With Strobed Binary Output, IEEE Transactions on Nuclear Science, 39(4), pp. 654–661, 1992.
[2] Gatti, E., Manfredi, P. F., Processing the signals from solid-state detectors in elementary-particle physics, La Rivista Del Nuovo Cimento, 9(1), pp. 1–146, 1986.
[3] Rivetti, A., CMOS: Front-end electronics for radiation sensors, CRC Press, 2015.
[4] White, M. H., et. al., Characterization of Surface Channel CCD Image Arrays at Low Light Levels, IEEE Journal of Solid-State Circuits, 9(1), pp. 1–12, 1974.
[5] Ballabriga, R., et. al., Review of hybrid pixel detector readout ASICs for spectroscopic X-ray imaging, Journal of Instrumentation, Vol. 11, Issue 1, 2016.
[6] S. O. Rice, Mathematical analysis of random noise, The Bell System Technical Journal, Vol. 24, No. 1, pp. 46-156, 1945.
Source & Publisher Item Identifier: PRZEGLĄD ELEKTROTECHNICZNY, ISSN 0033-2097, R. 97 NR 10/2021. doi:10.15199/48.2021.10.34
