Published by António LEBRE, Fernando BASTIÃO Nuno MELO, Luísa JORGE Pedro VELOSO, António BLANCO, EDP Distribuição – Portugal. Emails: antoniojose.lebrecardoso@edp.pt, nuno.melo@edp.pt, pedro.veloso@edp.pt, fernando.bastiao@edp.pt, luisa.jorge@edp.pt, antonio.blanco@edp.pt
ABSTRACT There is an increase in the quantity and in the variety of challenges faced by distribution network operators, concerning to Power Quality (PQ). EDP Distribuição, in Portugal, has been developing a comprehensive PQ monitoring program in order to meet all these challenges. This paper presents the state-of-art of the EDP’s PQ monitoring platform as well as the methodology associated to the monitoring program. Some PQ monitoring results for HV/MV and MV/LV substations are also presented, as well as improvement actions in the distribution network and support to the sensitive customers.
INTRODUCTION
EDP Distribuição (EDP D) is a company of the EDP Group Energias de Portugal. In Portugal, EDP D operates approximately 83000 km of High Voltage (HV) and Medium Voltage (MV) lines and cables, 400 HV/MV and MV/MV substations and 62000 transformers used to step down voltage to Low Voltage (LV) users, with a total power capacity around 18700 MVA (figures referred to the end of 2009), being the size of the LV distribution grid around 136000 km. By the end of 2009, EDP D had about 6,1 million of distribution network customers.
Due to extensive rural areas in the country, approximately 80% of HV and MV network is overhead type. This creates severe constraints on the Quality of Service (QoS) in periods of adverse weather conditions, especially during storms and their subsequent consequences.
As an operator of the Portuguese distribution network, fully committed to providing a high level of QoS, EDP D has been systematically monitoring its grids, in particular those of MV and LV levels, since 2001.
The associated PQ monitoring campaigns have been done according to the NP EN 50160 recommended standards and also according to a national QoS Regulation Code, which sets the different indicators and the correspondent minimum quality levels the Distribution Operator must guarantee to all its customers in the different voltage levels.
EDP’S PQ MONITORING PROGRAM
EDP D has been developing a comprehensive PQ monitoring program in order to meet all the actual challenges. This program allows to characterize the PQ in the distribution network and at the customers’ entrance, and improve the operation and maintenance of the distribution network, support customers and report PQ to regulators.
PQ Monitoring Platform and Methodology
To achieve the goal of providing data required to perform all the analysis, a methodology has been implemented, comprising the installation of PQ recorders, communication infrastructures (collecting data), storage systems and analysis software. The basic topology of the PQ monitoring platform is shown in the Figure 1.

The program is mainly based on 3 months PQ monitoring campaigns in HV/MV and MV/LV substations. These campaigns are performed to assure the requirements of the Portuguese QoS Regulation Code. Recently, EDP D has adopted a strategy of PQ continuous monitoring in all new HV/MV substations. In addition, PQ monitoring at some complaining customers is also carried out.
Systematic Monitoring Campaigns in Substations
Voltage measurements are performed in MV busbars of HV/MV substations, using about 26 portable PQ recorders per quarter. For MV/LV secondary substations there are performed measurements of voltage and current in about 42 LV busbars, per quarter, also with portable PQ recorders.
Continuous Monitoring in HV/MV Substations
According to the EDP D’ strategy to improve the PQ, since 2007 fixed PQ recorders with DFR features have been installed in all new HV/MV substations and in those submitted to a major refurbishment. So far, devices from Siemens (Simeas R) and Qualitrol (BEN 6000), with remote communications by Ethernet, modem and serial port, have been installed. Currently, the new acquisitions are only class A devices according to the IEC 61000-4-30 standard.
Customers Monitoring
Some customers are supported by point PQ monitoring in order to perform an accurate characterization of the PQ supplied and help identify improvement actions. Examples of these customers are sensitive industries and LV microgenerators. Typically, a portable class A PQ recorder is installed for monitoring during a month.
PQ Data Collection and Processing
For systematic monitoring campaigns in substations and customers monitoring, data are collected locally every month, and inserted in an SQL database. For continuous monitoring, the data are collected and stored automatically in the SQL database by scheduled actions.
After each quarter, PQ data of the systematic campaigns are processed in order to issue PQ overview reports to the Portuguese regulator. These reports are performed using a dedicated web based application (QWebReport). All PQ data are also submitted to analysis in order to support operation and maintenance.
PQ MONITORING RESULTS
PQ monitoring results from the HV/MV and MV/LV substations analyzed in the systematic campaigns during the quadriennium 2006-2009 are briefly presented.
HV/MV Substations
During the quadriennium, all the HV/MV substations were analyzed. In the Table 1 are presented PQ results (continuous phenomena) from the 539 MV busbars, in a total of 5819 monitoring weeks. These results are about the percentage of weeks in accordance to the NP EN 50160.
Table 1.

The most part of flicker severity “not in accordance”, both in HV/MV and MV/LV substations, is associated to the occurrence of voltage dips.

In the Figure 2 is shown an overview of the voltage dips recorded in the same MV busbars. The voltage dips characterization was performed as defined in the Annex IV of the Portuguese QoS Regulation Code.
MV/LV Substations
During the quadriennium, at least 2 MV/LV substations per municipality were analyzed. In the Table 2 are presented PQ results (continuous phenomena) from the 580 LV busbars, in a total of 5792 monitoring weeks. These results are about the percentage of weeks in accordance to the NP EN 50160.
Table 2.

IMPROVEMENT ACTIONS
Distribution Network
Voltage Variations The main PQ parameter “not in accordance” was voltage variations monitored at LV busbar of MV/LV substations. For the most part, there are situations associated to slight exceeded 110% of nominal value, in a short time. In some cases, situations were identified with origin in voltage regulation in upstream HV/MV substation or proximity of MV distributed generation.
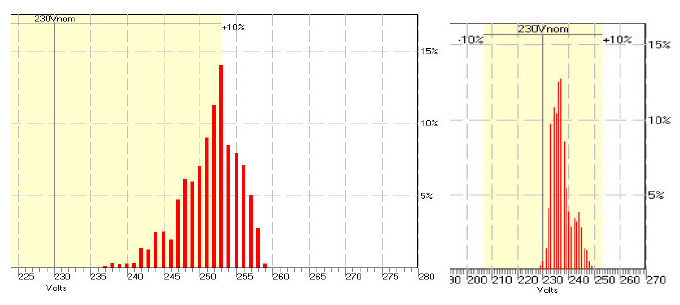
Finally, some changes were performed on MV/LV transformer tap changers. For the case study presented in Figure 3, one notices that there were some recorded values slightly above the standard threshold.
After network analysis, the strategy to correct the rms voltage values was to decrease one point from tap changers, as shown in the same Figure. In sequence of the analysis, in some neighbouring MV/LV transformers the same change was made.
Flicker
The second case study is about the voltage flicker recorded in two MV busbars of a HV/MV substation. The substation topology is characterized by two transformers, one busbar for each transformer.
As shown in the Figure 4, the values of voltage flicker in busbar #2 significantly exceeded the limits defined in NP EN 50160.

In MV busbar #2 some customers were identified as potentially PQ polluters, including foundry (arc furnace), metal processing, recycling of scrap and stone industries.
The flicker level decreases with the increasing network short-circuit power. Therefore, a strategy to mitigate the voltage flicker, immediately and without any investment, was changing the busbar topology, namely, connecting the MV busbars. However, the advantages and disadvantages of this reconfiguration have been carefully studied.
This way we achieved an increase of 58% in short-circuit power in both MV busbars and approximately 16% in a foundry industry.
An additional monitoring in the HV/MV substation validated the procedures in order to mitigate voltage flicker throughout network, to regulatory values.
Harmonics
As a result of these systematic campaigns, EDP D has identified some problems in the distribution network, which deserve careful attention, namely those related to the 5th voltage harmonics levels at particular points along the MV and LV grids.
Resonance Harmonic:
The resonant harmonic hr, based on fundamental frequency impedances, is defined as follows [1]:
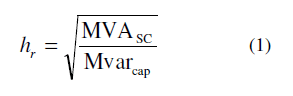
where hr = resonance harmonic
MVASC = system short-circuit MVA
Mvarcap = Mvar rating of capacitor bank
The resonant harmonic for the MV busbars of all HV/MV substations is calculated from the equation (1).
When the resonant harmonic is approximately close to the 5th harmonic voltage, studies are developed to prevent high voltage distortion based on the identification of potential resonance conditions in most probable network configurations.
In order to deal with the identified problems, to understand their main causes and, as much as possible, to foresee their solution, EDP D has been developing harmonic power-flow analysis models as well as harmonic state estimation models. These have been integrated into DPlan, an analysis and optimization program which evaluates and foresees future trends on harmonics phenomena in the grid, as well as their impact in PQ [2].
Once the non-linear loads have been estimated and the network has been characterized (for the selected frequencies), it is possible to simulate the harmonic behaviour of the system under topology and parameters changes. For example, it is possible to simulate the effect of switching-on capacitor banks, changing tap positions of transformers, connecting busbars and/or reconfiguring the HV or the MV network.
In a case study, the filter function “Harmonic voltage distortion” from a MV network was applied. It was concluded that the increase in the 5th harmonic in MV busbar #1 happens when the capacitor bank (CB) 1, connected to busbar #1, is switched on and the CB 2, connected to busbar #2, is switched off, coinciding still higher values of 5th harmonic with the periods in which the load is lower (off-peak hours). For another busbar, the conclusion is similar.

The impedance curve depicted in the Figure 5 shows the resonance behaviour for the 5th harmonic.
The harmonic distortion problem was being caused by resonance created by the substation capacitor banks in the MV busbar. This resonance was magnifying the 5th harmonic component in the currents from all the customers on this system, causing high voltage distortion levels.
Optimizing the schedule of both CB, also associated to the management of reactive power in the network, reduces the 5th harmonic voltage to regulatory values.
Events
EDP D has been working on the reduction of the fault incidence on overhead networks in order to decrease the number and duration of voltage dips and short interruptions. Therefore, some actions have been considered, like preventive and predictive maintenance strategies, adjustment of the insulation level to the specific local conditions of the network and implementation of new overhead technologies, such as covered conductors. At the operation level, some actions have been also considered, like optimization of the protection systems, supply of sensitive customers by shorter circuits, from busbars with lower fault incidence or higher voltage levels, and increasing HV network robustness.
Sensitive Customers
Potentially sensitive customers are invited by EDP D to report PQ disturbances during the systematic monitoring campaigns. Mostly, they report production disturbances facing to voltage dips. The sensitivity is variable, but an important number of them are sensitive to voltage dips of short magnitude and/or short duration. Continuous processes supported by PLC, ASD and other electronic devices are very sensitive to voltage dips and long downtime periods can be experienced. There are typical difficulties to adopt immunization solutions and reengineering strategies to improve the process reliability at the customer level.
Based on the available information, root causes and effects of reported disturbances are analyzed. This allows to check the sensitivity of customers, as well as to launch the research for improving actions at distribution network and customers levels.
With the technical support of EDP D, the following improvement actions are some examples of successful cases: immunization of glass production machines; installation of static and dynamic UPS in moulds, dairy and ceramics industries; immunization of fan systems driven by ASD in cement and chemical industries; optimization of the distribution network and immunization of command and control systems in the chemical industry; consultancy in the adoption of several immunization solutions in the automotive components industry; implementation of alternative supplying circuits with fast transfer switches.
MAIN CHALLENGES
In terms of PQ, the challenges are mainly related to the customer sensitivity to voltage dips, increasing penetration of Micro-Generation (MG), trends of regulation to request higher PQ levels, as well as management of large amounts of monitoring devices and PQ data.
Since 2007, there has been a noticeable increase of MG in Portugal, leading to an installed base of around 10000 MG units in the end of 2010. This amounts to around 30 MW of installed MG power. This increasing number of microgenerators injecting power in the LV grid is bound to cause a significant impact on the main grid PQ parameters. EDP D has performed some monitoring studies including a few MG units and the MV/LV substations to which they are attached, relating the results to their location and the types of load they feed. The first conclusions point to non-degradation of the grid operating conditions within the current legal power limitations, in the vicinity of MV/LV substations (~200 meters) but, however, some parameters may change with different conditions. Given the interest they raised, these studies will be continued with monitoring campaigns of larger dimension, in duration, scope and periodicity.
On the other hand, in order to implement continuous PQ monitoring at the distribution network scale, some developments are expected in the solutions available to PQ data transfer, storage and management. An important requirement is the adoption of standards, like PQDIF format, to integrate data from devices provided by several vendors.
CONCLUSIONS
Despite the current challenges, it has been possible to develop a comprehensive PQ monitoring program, including several monitoring weeks in more than one thousand MV and LV busbars. Furthermore, it is expected an increasing of the measuring points with recent developments in the EDP’s PQ Monitoring Platform, namely with the continuous monitoring strategy in HV/MV substations. Based on the PQ monitoring results, EDP D has been adopting several measures aiming to develop its actions in the distribution network, such as, mitigation of harmonic distortion, mainly the 5th harmonic, attenuation of flicker induced by industrial loads, reduction of faults in overhead networks in order to decrease the incidence of voltage dips and short interruptions, as well as adjustment of voltage levels in some LV busbars. The PQ monitoring campaigns are also giving support to sensitive customers who wish to adopt immunization solutions and improve their production reliability.
Power Quality is becoming an important reference factor to distribution network operators concerning its contribution to the global QoS.
Acknowledgments The authors thank the availability and collaboration from the colleagues Teresa Couceiro and Flávio Cação.
REFERENCES
[1] R. Dugan et al., 2003, Electrical Power Systems Quality, McGraw-Hill, USA, 167-224.
[2] C. Santos et al., 2009, “Voltage distortion in largescale MV and HV distribution networks: harmonic analysis and simulation”, 20th International Conference on Electricity Distribution – CIRED.
Source: CIRED 21st International Conference on Electricity Distribution Frankfurt, 6-9 June 2011. Paper No 1021. URL: http://www.cired.net/publications/cired2011/part1/papers/CIRED2011_1021_final.pdf
