Published by Maciej MRÓZ1, Zbigniew HANZELKA, Krzysztof CHMIELOWIEC2, TAURON Dystrybucja S.A.(1), AGH – University of Science and Technology (2)
Abstract. One of the electromagnetic disturbances generated by distributed power sources, e.g. wind turbines, are voltage fluctuations. An imprecise prediction of the disturbance level may be the reason for erroneous decisions made at the stage of issuing technical conditions of connection. In the authors’ opinion, the most common causes for errors can be: the lack of sufficiently precise tools for assessing the level of flicker attenuation, high uncertainty of prediction of the disturbance level after connection, and too low disturbance emission limits.
Streszczenie. Jednym z zaburzeń elektromagnetycznych emitowanych przez rozproszone źródła energii np. przez turbiny wiatrowe, są wahania napięcia. Brak precyzji w przewidywaniu poziomu tego zaburzenia po przyłączeniu źródła może być przyczyną błędnej decyzji na etapie wydawania warunków technicznych przyłączenia. Wśród wielu przyczyn błędu można wyróżnić zdaniem autorów brak wystarczająco precyzyjnych narzędzi dla oceny poziomu tłumienia wahań w sieci zasilającej, dużą niepewność prognozy poziomu zaburzenia po przyłączeniu źródła oraz przyjmowane zbyt niskie graniczne wartości miar liczbowych zaburzenia. Wahania napięć w sieciach z rozproszonymi źródłami energii
Keywords: flicker, propagation, transfer coefficient
Słowa kluczowe: wahania napięcia, propagacja, współczynnik przejścia
Introduction
Among many features of the smart grid technology at least two, related to the distributed generation, should be mentioned: the grid flexibility, understood as its capability for connection of a new power source and acceptance of a new and proven idea or technology, and the ability to supply sensitive loads or installations without degradation of their functionality. One of the electromagnetic disturbances generated by distributed power sources that in many cases can be an obstacle to their connection to the network are voltage fluctuations.
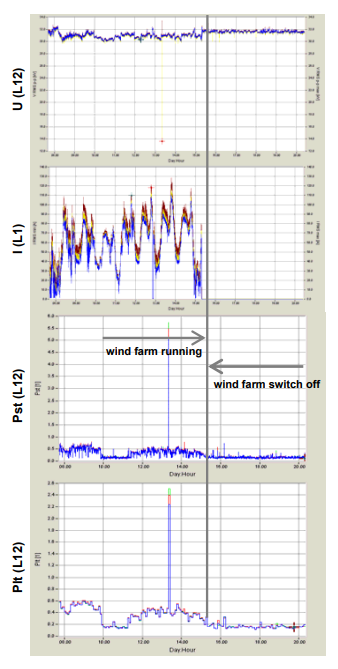
Power sources with power considerable large with respect to the short-circuit capacity at the point of connection may be sources of disturbances due to switching operations, e.g. starting or switching off, or continuous operation with variable output power. If power variations are slow they usually do not cause flicker. For instance, in the case of photovoltaic power sources, changes in solar irradiation as so slow that they do not cause flicker, whereas wind turbines, due to the nature of their operation, may cause flicker. Example of the impact of wind turbines on flicker level is presented in the figure 1.
The possibility of precise prediction of the flicker level at the considered point of the network is of major importance at the stage of connecting new power source, e.g. a wind turbine or a wind farm. The lack of the precision in predicting may be the reason for erroneous decision concerning: acceptance of connection of a new source despite the actual, or possible future, high level of voltage fluctuation, or refusal of connection or limitation of a new source power.
Among many causes of erroneous prediction, the following should be mentioned:
a) difficulties in precise evaluation of the flicker attenuation effect in the existing network [3,4,8,11]. Measurements of voltage fluctuation are made at EHV/HV levels whereas their visual effects occur at LV. So the attenuation effect is essential.
b) the methods employed to estimate the disturbance level at the stage of connecting new sources are burdened with uncertainty [5]
c) in many cases there is a poor correlation between high flicker level and users’ complaints [1]. Rapid voltage changes or dip events that are not taken into account in planning procedures have a substantial share in the disturbance level [7].
d) modern energy-saving light sources have a lower sensitivity to voltage changes than traditional incandescent bulbs [1,2,6].
Factors (c) and (d) justify the thesis that present flicker levels limits are excessively stringent [1]. The above theses are further illustrated by simulation and experimental investigation.
Attenuation of voltage fluctuations
Voltage fluctuations generated at a given point of a network propagate across the power system disturbing even distant loads. The quantity that characterizes the system capability of disturbance propagation is the so called flicker transfer coefficient (TPst), which for two distant points – A and B, of the supply network can be defined as:
where: Pst(A)– flicker severity index at point (A), Pst(B)– flicker severity index at point (B).
A power system and loads connected to it have a capability to attenuate voltage fluctuations. This fact should be taken into consideration; otherwise it can be a source of costly errors. In literature are often expressed opinions that, in practice, voltage fluctuations are attenuated when they propagate towards a lower voltage network. It has been confirmed by multiple measurements (e.g. [1, 8]) that fluctuations generated in HV and EHV networks often become significantly reduced in MV and LV networks. So far there are no precise analytical methods to estimate transfer coefficients between networks at different voltage levels. Thus for estimated calculation are usually taken empirically determined values of transfer coefficients [5]: from EHV network to HV network ≈0.8; from HV network to MV network ≈0.9 (hence form EHV network to MV network ≈0.72); from MV network to LV network ≈1. Table 1 provides example values of transfer coefficients for given voltage levels. Estimation of flicker transfer coefficient with respect to statistical measures (Cumulative Probability CP95 and CP99) is possible only in the case of strong correlation between voltage fluctuations measured at points at different voltage levels.
Table 1. Example transfer coefficients [9]
The decision on voltage fluctuation planning levels for different voltages requires knowledge of transfer coefficients between given voltage levels. Moreover, flicker attenuation can also be of particular significance in the case of determining the voltage fluctuation emission limit for a given power source. According to the summation law [5,8] the global flicker level at the medium voltage busbars connected by the transformer to a high voltage network where the voltage fluctuation source is located, can be evaluated for the example exponent value m=3 from relation:
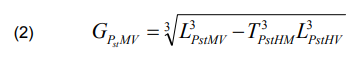
where: GPstMV – the global flicker level for medium voltage, LPstMV – the flicker planning level for medium voltage, TPstHM – the flicker attenuation coefficient between the high and medium voltage system, LPstHV – the actual flicker level at high voltage.
Assuming the voltage fluctuation planning level LPstMV=1.0 and LPstHV=0.8 in a medium voltage and high voltage network, respectively, and assuming the flicker transfer coefficient between the HV and MV network TPstHM=1, the total voltage fluctuation emission level in the MV network will be 0.6. Assuming the voltage fluctuation level 0.8 yields the total voltage fluctuation level 0.78 [8]. Not taking into account the flicker transfer coefficient between different voltage levels may lead to formulation of excessively stringent limits for connection of a fluctuating power source, e.g. a wind farm. Howerver, in the absence of certain knowledge, the effect of propagation of voltage flicker in the power system requires more real measurments and simulation studies.
Voltage fluctuations propagation between different voltage levels was investigated using a test network with nominal voltage 24.9 kV, connected through a HV/MV transformer to the 69 kV network. The test network model, based on IEEE 34 Test Feeder, is shown in figure 2.
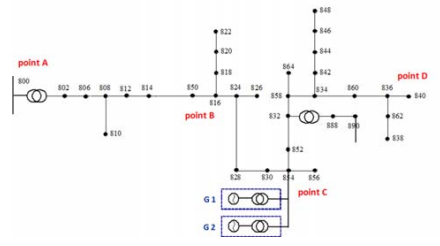
The main source of voltage fluctuation utilized in the presented simulation are two wind turbines, 900 kW each, driven by variable mechanical torque from simulated wind speed. The variability of both: the voltage fluctuation level and its frequency, are achieved by changing the spectrum of turbines electromagnetic torque that simulate the variability of wind conditions. The voltage fluctuations are measured by means of a virtual flickermeter model. The measurement duration was 10 minutes for each transfer coefficient Pst value. Simulations were carried out in the ATPDraw environment.
Propagation of voltage fluctuations in the network with passive loads
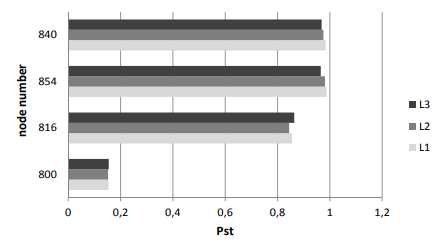
Propagation of voltage fluctuation was simulated in a network containing solely the fluctuation sources (wind turbines) shown in figure 2. Short term flicker severity values obtained from the virtual flickermeter at selected points of the network model are shown in figure 2. The results indicate approximately constant voltage fluctuation level in the whole MV network. Differences between the indices values result from the magnitude of impedance between given measurement points.
The test network has been loaded at different voltage levels (MV and LV) with passive balanced and unbalanced loads of total power ca. 3000 kW and average power factor 0.9. The computed flicker severity indices values at selected points of the network model are shown in Table 2.
Table 2. Flicker severity indices in network model
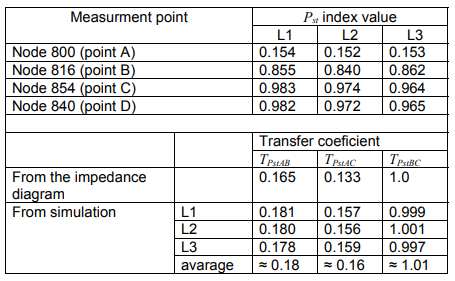
It is evident that due to the system large short-circuit capacity and the HV/MV transformer reactance, the voltage fluctuation level in the HV network (node 800) is relatively low compared to the voltage fluctuation level in the MV network. High flicker severity indices have been obtained at the network nodes closest to the voltage fluctuation source. The obtained results (voltage fluctuation level at node 890) confirm that there is practically no attenuation during the disturbance transfer from the medium to the low voltage network with dominant share of passive loads.
Transfer coefficients TPst between the given nodes are determined from the network impedance per-phase equivalent circuit, including connected loads. These values were compared with transfer coefficient values determined from the simulation, employing the network model and flickermeter model. Differences between transfer coefficient values determined from the per-phase impedance diagram and those determined from simulations are not exceeding 13%.
Equation (3) provides a simplified formula for determining the change in the transfer coefficient between the high and low voltage level depending on the HV/MV transformer percentage loading [11]:
where: PstMV – flicker severity index Pst at the MV transformer secondary side, PstHV – flicker severity index Pst at the HV transformer primary side, TPst(a) – assumed transfer coefficient for a transformer under no-load conditions.
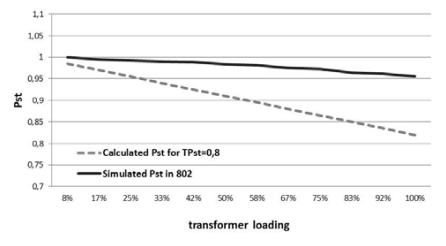
The dependence of the voltage fluctuation transfer coefficient versus the network loading level was simulated for the network in figure 2. The simulation results are presented in figure 4, which also shows the change in the transfer coefficient determined from relation (3) for the assumed value of TPst(a) = 0.8. The main inconvenience of the formula (3) is that the TPst(a) value needs to be assumed, which is not an easy task.
The linear relationship between the network (transformer) loading level and the voltage fluctuations degree has been confirmed. Nevertheless, assuming the voltage fluctuation transfer coefficient 0,8 between HV and MV for a network with exclusively passive loads can be a source of significant errors.
Propagation of voltage fluctuation in the network with passive and rotating loads
Both the actual measurements and theoretical analyses indicate that voltage fluctuations are attenuated during transfer between different voltage levels. As has been demonstrated in [14] the attenuation level depends mainly on the “dynamic”, not only on the static equivalent impedance of connected loads, chiefly rotating loads, i.e. electric motors directly connected to the network. The impact of rotating loads on the voltage fluctuation level was analysed in the configuration from figure 2. The source of fluctuation was, as formerly, two wind turbines and an additional fluctuation source in the HV network (Pst=0.85 at the node 800), added in order to increase the disturbance level. The network was loaded with passive loads (of total power about 3000 kW and power factor 0.9) and a varying number of motors with different rated powers, loaded with torques of various magnitude and type (constant or variable with the rotational speed square), connected at different nodes of the network.
The influence of the motor power on flicker attenuation
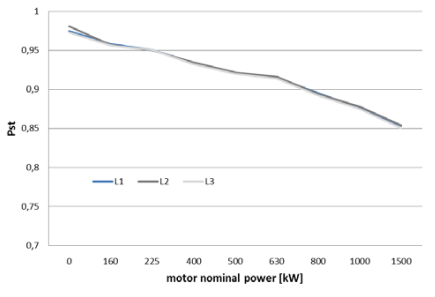
An induction motor of variable power, loaded with nominal torque was connected at node 816. The attenuation effect of the connected motor on the voltage fluctuation level is evident, and it increases with the motor power. Figure 5 illustrates changes in the severity index Pst at node 816 versus changes in the induction motor power within the interval 160 kW to 1500 kW, connected at the same point.
The share of rotating load in the network total loading increases with the motor rated power and therefore the effect of disturbance attenuation becomes stronger. Motors of lower rated powers can store smaller amounts of both: the mechanical and electromagnetic energy and, consequently, their capability to reduce the supply voltage fluctuation is limited.
The influence of motor location on the voltage fluctuation attenuation
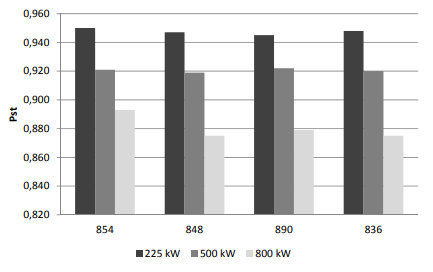
Another investigated case was the influence of motor location on the voltage fluctuation level in the analysed network. For this purpose the simulation was carried out for induction motors with rated powers of 225, 500 and 800 kW under nominal load, connected at various points. The motors were successively connected at points: 848, 836 and 890. Flicker severity indices determined from the simulation are shown in figure 6 (average from values in three phases).
An alteration of the motor location only to a small extent influences the voltage fluctuation level. The observed effect will grow with the increase in the impedance values of the network sections between the selected points of connection, for which the parameters characterising voltage fluctuation have been determined.
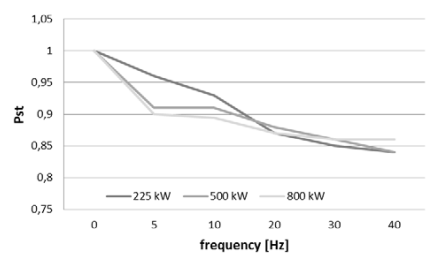
The effect of the modulation frequency on the flicker attenuation level
The dependence of the flicker severity reduction versus the dominant voltage modulation frequency was also analysied – figure 7. For induction motors with different rated power, difference in the level of flicker severity reduction was observed in the low frequency range – up to 10 Hz. Reduction is less dependent on motors power rated, for higher modulatuion frequncy range.
Insecurity of voltage fluctuation prediction
A general empirical combination relationship for short-term flicker severity caused by several sources of emissions has the form formula (4):
where: Pstj is the magnitude of flicker severity from various, independently operated, disturbance sources; exponent m is taken from 1 to 4, depending on the disturbance source characteristic.
In order to evaluate the correctness of prediction based on the relationship (4) were carried out simulations for the network in figure 2.
The influence of the wind turbine driving torque on the voltage fluctuation level
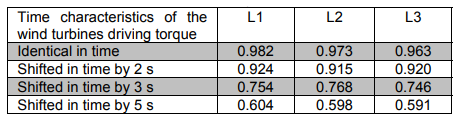
The simulation was carried out in two versions. First, the flicker severity indices were determined for the case of both wind turbines driven with same driving torque with time-characteristic shown in figure 8. In the second case the turbines’ driving torque time-characteristics were shifted in time. The results are provided in Table 3.
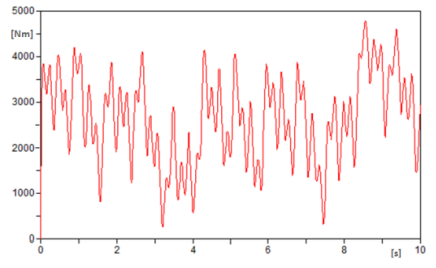
Figure 9 shows the flicker severity indices computed from the relationship (4) for different values of the exponent m. Also flicker severity indices obtained in the simulation for different, shifted in time, time characteristics of the wind turbines driving torque are shown (table 3). As can be seen, the relationship (4) is a highly imperfect tool for prediction of the voltage fluctuation level.
Table 3. The flicker severity factor P

Influence of the frequency of voltage fluctuations emitted from different sources on the total disturbance level
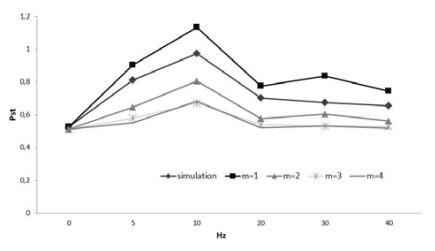
The turbines in figure 2 were substituted by two hypothetical disturbance sources that modulate the voltage (i.e. its fundamental component 50 Hz) at the point of connection with the same modulation depth Vm/Vp=5% the relationship:
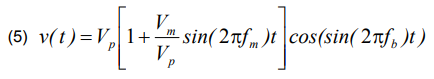
where: Vp – amplitude of the fundamental component, the modulated signal, Vm – amplitude of the modulating component, fb – the modulated signal fundamental frequency, fm – modulation frequency, Vm/Vp – modulation factor.
tor. The modulation frequency fm1 of one source was constant and equal 10 Hz whereas the other source modulation frequency fm2 was varied within the range of 0.5 Hz to 40 Hz. During the simulation this frequency was varied within a chosen interval. Flicker severity indices determined by simulation for given frequencies were compared to those found from the relationship (4) for different values of the exponent m. The results are shown in figure 10.
Once again it is evident that the relationship (4) is not enough perfect tool for prediction of voltage fluctuations. Depending on the exponent m value taken for calculations, the obtained total voltage fluctuation level was either overestimated or underestimated with respect to the simulation results taken as the reference.
Propagation of voltage fluctuations from a network with higher nominal voltage towards the network with lower nominal voltage
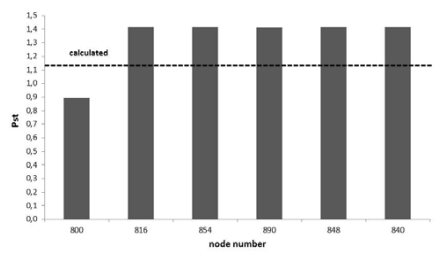
The voltage at the HV side, at point 800 was modulated by the sinusoidal signal with frequency fm=10 Hz and modulation depth 5%, that yields flicker severity level Pst=0.85 at the node 800. Loads with constant equivalent impedance were connected to the medium voltage network.
Short term flicker values Pst at the network selected points, shown in figure 11, confirm a very weak attenuation effect when only constant power loads were connected.
Additionally to constant impedance loads also induction motors with different rated powers loaded with constant nominal torque, were connected. The obtained flicker severity index values confirm former observations that only small part of the voltage fluctuations generated at the MV network propagate to a HV network (point 800 – figure 11). Also flicker severity indices obtained in the simulation shows that voltage fluctuations from different sources do not sum algebraically and cannot be simply added together, especially in cases where the source of fluctuations is connected to different voltage networks. The simulation
results are higher that obtained from the summation law (dotted line – figure 11).
Rapid voltage changes as a source of fluctuation
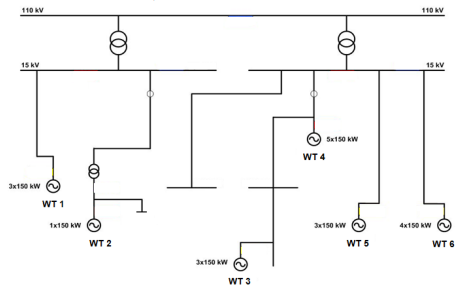
It happens that refusal of connection of a new power source, or limitation of a new installation power, results from the fact that measurements reveal to high level of voltage fluctuation in the existing network. Sometimes it is not caused by operation of distributed power sources but the effect of a large number of rapid voltage changes, voltage dips or swells. It is illustrated by the practical example below [7]. To test the effect of operating wind turbines on a supply network, the series of measurements at their connection points were carried out. The measurements were made at the nodes of a medium voltage network supplied from 110/15 kV GPZ. The scheme of the analysed network is shown in figure 12.
Over ten wind turbines were connected to the analysed medium voltage network either in groups as small farms or individually. The total installed power of wind sources at the investigated area is 2.85 MW. Short-circuit capacity at 110 kV level at GPZ is 1,480 MVA.
The considered network is an overhead network and supply also the other consumers. Fig. 13 shows diagrams of the short term flicker severity factor Pst recorded on 15 kV busbars at the supply point. It is evident that the limits are significantly exceeded.
To find out a source of disturbances, the correlation between phase current of a farm, supply voltage and short term flicker severity factor Pst was investigated. It was found that large values of factors characterizing voltage fluctuations are caused by voltage changes and are not correlated with current changes. Figure 14 shows the correlation of wind farm phase current and the short term flicker severity factor Pst. Poor correlation of values confirms again that wind farms have no effect on a voltage fluctuation level in the analyzed network.
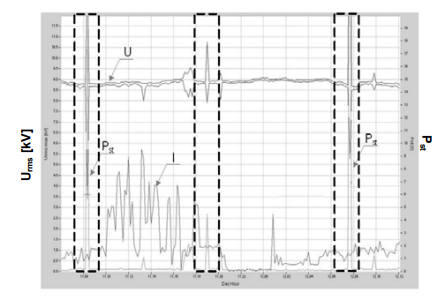
Considering the above indicated relations between the events on a voltage change characteristic and the factors characterizing voltage fluctuations, it was decided, in accordance with the standard EN 61000-4-30, to exclude the measured values of voltage fluctuation indicators recorded during voltage dips/swells. It was noticed that extreme voltages and large voltage fluctuation indicators occur simultaneously.
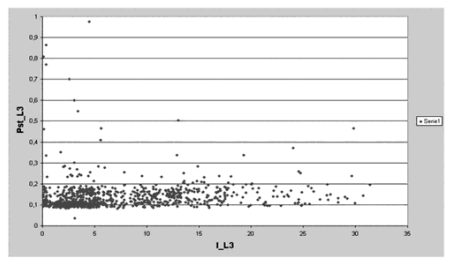
Table 4. The flicker severity factor Plt in analysed network

The samples Plt that contain the values Pst were excluded from statistical analysis. Such procedure of analysis was applied to particular measuring positions. As a result, the voltage fluctuations at connection points of wind farms to supply network were significantly reduced. The recorded and the assessed (after elimination of flagged samples) values of the long term flicker severity factor (Plt) are assembled in Table 4.
It is evident that the acceptance of the given procedure for excluding definite values of indicators characterizing voltage fluctuations reduced a voltage fluctuation level at particular points of supply network to allowable values. It is easily noticed that the number of events during particular measuring weeks was almost identical. That means that the events identified at various measuring positions were not connected with a limited area but with the whole analysed network.
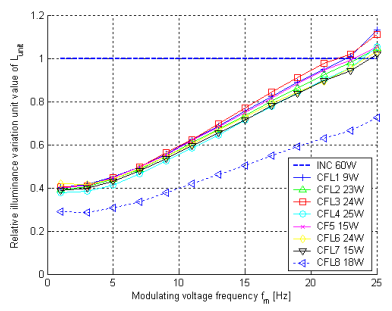
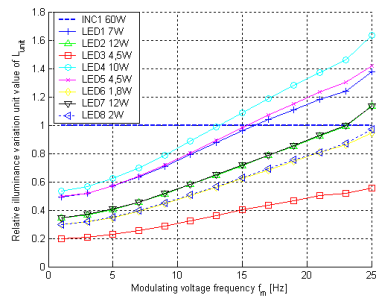
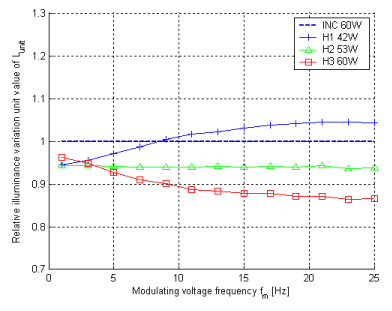
Voltage fluctuation effect on energy-efficient light sources
The lack of correlation between the flicker level, demonstrated by measurements, and customers’ complaints can also be explained by a lower sensitivity of energy-saving light sources to voltage changes. In almost all light sources, i.e. incandescent bulbs, fluorescent lamps, LEDs and CFLs, an increase in the modulation depth at constant frequency (0.5-25 Hz) increases the luminous flux variability (however to a different extent), whereas the same modulation depth at an increasing frequency does not always result in the luminous flux reduction. Incandescent light sources are almost linear loads, whereas the voltage-current characteristics of high-pressure discharge lamps and energy-efficient light sources are nonlinear. The voltage across a discharge lamp is an electronic converter output voltage and, therefore, it does not vary in accordance with the supply voltage changes.
Conclusions
The simulation results and measurements presented in this paper have confirmed:
1) Imperfection of tools commonly employed for prediction of flicker level resulting from connection of a fluctuating load. A large number of factors influencing the disturbance level is the cause that the only credible method for flicker level prediction is simulation. The forecast confidence depends fundamentally on the model accuracy degree.
2) In many cases the actual (measured) high level of voltage fluctuation results from voltage events, i.e. rapid voltage changes, voltage dips or swells that are not accounted for in simulation. That level does not influences directly costomers’ compalints. It seems that limit levels of the considered disturbance can be lowered, provided that attenuation has been accounted for and simulations will demonstrate that voltage fluctuation limit in LV networks is not exceeded. This will allow the network operator to approve multiple distributed power sources, as well as fluctuating loads that otherwise, according to binding regulations, would have no chance for connection. according to binding regulations, would have no chance for connection.
3) A further argument for liberalization of the existing regulations is the fact that frequency characteristics of energy efficient light sources are different from those of incandescent light sources.
This work was performed under the finance support of CIPOWER Project (KIC InnoEnergy).
REFERENCES
[1] Chmielowiec K., Flicker effect of different types of light sources, EPQU Conference 2011, Lisbon.
[2] De Jaeger E, Measurement and evaluation of the flicker emission level from a particular fluctuating load, Prepared for CIGRE/CIRED Joint Task Force C4.109, October 2007.
[3] Guide to quality of electrical supply for industrial installations. Part 5: Flicker, UIEPQ 1999
[4] Gutierrez J.J, Ruiz J., Azkarate I., Saiz P. Analysis of the sensitivity to flicker of the modern lamps, Group of Signal and Communications, University of the Basque Country, Report to WG2 of SC77A/IEC, London, September. 19, 2011.
[5] Hanzelka Z., Mroz M., Pawelek R., Piątek K Quality parameters of 15 kV supply voltage after connection of wind farms – case study, 12th International Conference on Harmonics & Quality of Power : 1–5 October 2006 Cascais, Portugal.
[6 IEC 1000-3-7: Electromagnetic compatibility (EMC) – Part 3: Limits – Section 7: Assessment of emission limits for fluctuating loads in MV and HV power systems – basic EMC publication.
[7] Povh D., Weinhold M. Improvement of power quality by power electronic equipment. CIGRE Session 2000, 13(14)36-06.
[8] Power quality indices and objectives, CIGRE WG C4.07, Oct. 2004.
[9] Tennakoon S., Perera S., Improvement of power quality by power electronic equipment. CIGRE Session 2000, 13(14)36-06.
[10] Yang X.: Kratz M., Improvement of power quality by power electronic equipment. CIGRE Session 2000, 13(14)36-06.
[11] Reviev of Flicker Objectives for LV, MV and HV System. CIGRE/CIRED WG C4.108
[12] Rogóż M., Quality assessment system for the electricity supply contract and determine the technical conditions of connection, Phd Thesis, AGH, Kraków 2007
[13] Lubosny Z., Wind Turbine Operation in Electric Power Systems; Springer-Verlag Berlin, 2010
[14] Tennakoon S Flicker propagation in radial and interconnected power system, Phd Thesis, University of Wollongong, 2008
[15] Halpin M., Cai R., De Jager E., Papic I., Perera S., Yang X., A revive of flicker objectives related to complaints measurements, and analysis techniques, 20th International Conference on Electricity Distribution CIRED 2009, Prague, Czech Republic.
Authors: mgr inż. Maciej Mróz, TAURON Dystrybucja S.A., ul. Jasnogrska 11, 31-358 Kraków, prof. dr hab. inż. Zbigniew Hanzelka, AGH – Akademia Górniczo – Hutnicza, Katedra Energoelektroniki i Automatyki Systemów Przetwarzania Energii , al. Mickiewicza 30, 30-059 Kraków, E-mail: hanzel@agh.edu.pl; mgr inż. Krzysztof Chmielowiec, Katedra Energoelektroniki i Automatyki Systemów Przetwarzania Energii , al. Mickiewicza 30, 30-059 Kraków, E-mail: kchmielo@agh.edu.pl.
Source & Publisher Item Identifier: PRZEGLĄD ELEKTROTECHNICZNY, ISSN 0033-2097, R. 90 NR 5/2014 228. doi:10.12915/pe.2014.05.50
