Published by Szymon BARCZENTEWICZ, Krzysztof DUDA, Andrzej BIEŃ, AGH University of Science and Technology
Abstract. This paper presents the results of measurement experiment conducted in the operating steel plant. Frequency analysis of measured signals revealed an interesting phenomenon, as it happened that after switching off the electric arc furnace, the frequency of the supplying voltage and current increased slightly instead of decreasing, as we would normally expect. This abnormal frequency behaviour was identified by phasor analysis and also confirmed by the DTFT (Discrete Time Fourier Transform) analysis, and the MatrixPencil analysis.
Streszczenie. Artykuł prezentuje wyniki eksperymentu wykonanego w hucie stali. Analiza częstotliwości ujawniła ciekawe zjawisko, w którym po wyłączeniu pieca łukowego częstotliwości napięcia i prądu w wewnętrznej części huty zmniejszyła się zamiast zwiększyć, jak można by się spodziewać. To nieoczekiwane zjawisko zostało zarejestrowane z pomocą PMU i potwierdzone przez transformację Fouriera dla sygnałów dyskretnych oraz analizę MatrixPencil. (Monitorowanie częstotliwości napięcia zasilającego piec łukowy z wykorzystaniem analizy fazorowej)
Keywords: Electric Arc Furnace, frequency analysis, phasor analysis.
Słowa kluczowe: Piec łukowy, analiza częstotliwości, synchrofazor
Introduction
The electric arc furnaces (EAF) produce currents and voltages at the point of common coupling (PCC) with spectra reach in different types of disturbances. Those disturbances can cause power quality problems at PCC. Recently, researchers dealing with EAF are focused on harmonics and interharmonics analysis and methods of their mitigation [3,4]. This work is focused on the monitoring of frequency. The most popular nonparametric methods used for frequency calculation are based on the Fourier transform (FT). In this paper phasor based analysis is applied. There is a numerous group of phasor estimation methods. In this application FIR filters compliant with synchrophasor standard is used [3]. Phasor analysis is a well-established technology in transmission systems. Initially Phasor Measurement Units (PMUs) where considered as an expensive and highly specialized equipment, but lately, PMU tends to be less expensive and more popular. Moreover, DPMUs (PMUs for distribution systems) and phasor based frequency monitoring instrumentation were introduced. Authors propose a novel application of phasor analysis for the EAF frequency monitoring. Performed measurements revealed an interesting phenomena: after switching off the EAF the frequency of the supplying voltage and current increases slightly instead of decreasing, as we would normally expect. Recorded phenomenon was also confirmed by the Discrete Time Fourier Transform (DTFT) analysis [9], and the MatrixPencil analysis [10].
Phasor definition
Synchrophasors are measured with PMUs located across the network. Phasor data are collected in real-time and are accurately time-tagged. Synchrophasor is a phasor representation of sinusoidal signal. For the following continuous time sinusoidal signal
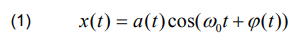
where: ω0=2πf0 is a nominal pulsation in rad/s, f0 is a nominal frequency in Hz, a(t) is time-vairing amplitude and φ(t) is a time-varying phase in radians, the phasor is defined as [7]

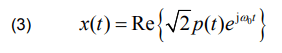
Equations (1) and (2) are related by
For the nominal frequency f0 = 50 Hz system, the phasor should be estimated 10, 25 or 50 times per second.
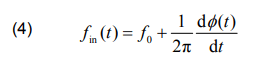
The instantaneous frequency fin of (1) is the 1st order time derivative of cosine argument in (1):
If fin ≠ f0, the phasor rotates on the complex plane.
The discrete-time x[n] corresponding to continuous time counterpart (1) is obtained by anti-aliasing analog LP filtering and sampling by an ADC converter
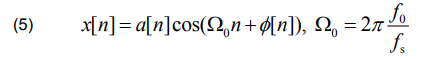
where Ω0 is normalized frequency (pulsation) in radians of the discrete-time signal, and n=-N,…,0,…,N is the sample index.
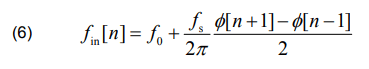
The instantaneous frequency of signal (1) is estimated as
FIR filters based on flat-top windows
Flat-top (FT) windows have an unique feature of simultaneous perfectly flat or equiripple spectral main lobe and fast decaying of the sidelobes. FT windows are cosine windows defined as [3]
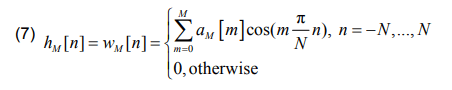
where M is the window order and aM[m] are the coefficients of an M-order window. The window (9) has L=2N+1 samples. . It is shown in [3] that phasor estimation based on the FT window is compliant with the IEEE C37.118.1 in the M class.
Steel mill power supply
Steel plant is supplied with 400 kV voltage through 250 MVA voltage transformer. Plant consists of two pairs of arc furnaces and ladle furnaces. Both pairs are 500 meters apart and have separate power supply lines. Apparent power of first pair is 115 MVA and 75 MVA for arc furnace and ladle furnace respectively. Second pair is 25 MVA for both arc furnace and ladle furnace. Power supply network schematic is presented in figure 1.

High power arc furnace is powered through two 75 MVA voltage transformers from 110 kV bus. Working in parallel transformers are the same type and production but it is expected that they are loaded differently. Measurements where conducted in three different points for high power arc furnace. Measurement point 1 and measurement point 2 ware installed on 110 kV side and Measurement point 3 on 30 kV side. The selection of these measurement points was dictated by the willingness to evaluate the impact of arc furnace A on PCC and attenuation of disturbances by transformers Tr1 and Tr2.
Measurement system
Measurement system is based on real time system with Field Programmable Gate Array (FPGA) module cRIO9024. It is designed for monitoring and control purposes. It allows to install eight different measurement, digital or control modules. Existing on site voltage and current transformers where used as a source of measured signals. The used configuration included three current measurement and three voltage measurement modules. Measurement signals are. Resolution of ADCs where 24 bits and maximal sampling frequency was 50 kS/s. Sampling was conducted with 12.5 kS/s frequency.
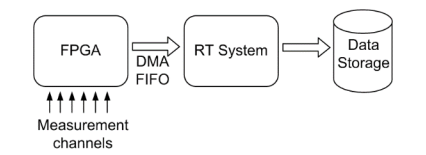
At each point, measurements of instantaneous values of three voltages and three currents were made. All performed measurements where conducted synchronously, according to one of the modules oscillator clock. Data after acquisition where send through FIFO queue with direct memory access (DMA) to real time system. Data was saved in a parallel thread on embedded data storage or on external Flash drive. Fig. 2 shows simplified block diagram of used data acquisition system.
Results
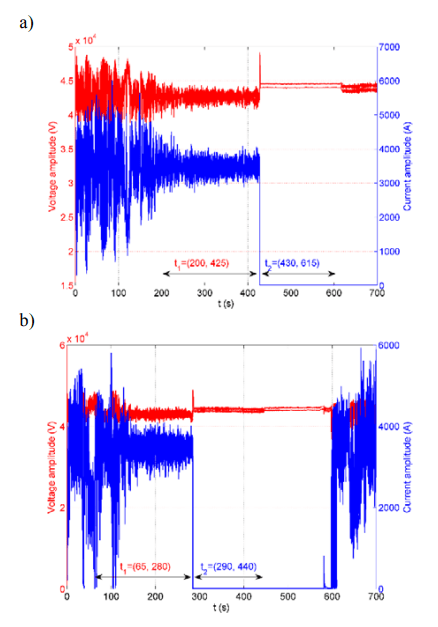
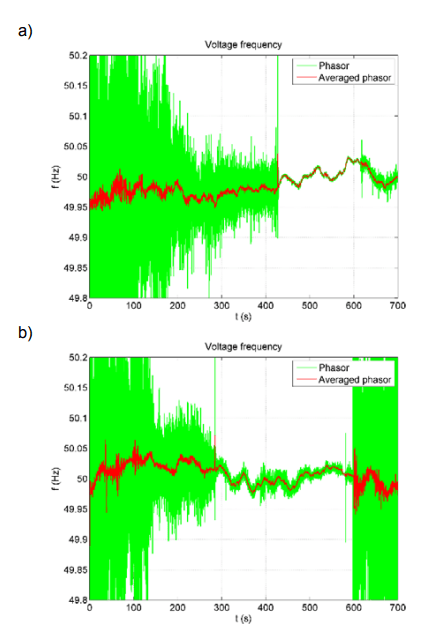
Before computing phasors, signals were downsampled to the sampling frequency 800 Hz, and the phasors were computed, in respect to 50 Hz nominal frequency, as recommended in [1] with the flat-top window M=5, D0=2, DN=2, L=207 [2]. Fig. 3 shows the envelope of three phase voltages and currents obtained from phasors. In both cases, Fig. 3a,b, significant drop of current and slight increase of voltage is observed after switch off. In Fig. 3 time intervals t1 and t2, before and after electric arc furnace switching, are marked. Fig 4 shows instantaneous frequency computed by phasor and also the instantaneous frequency averaged with Finite Impulse Response (FIR) filter having flat impulse response. The arithmetic average was computed from 301 values. In Figs. 4 it is seen that the frequency change is different for case “a)” and “b)” although in both cases the electric arc furnace is switched off. In case “b)” the frequency unexpectedly decreases.
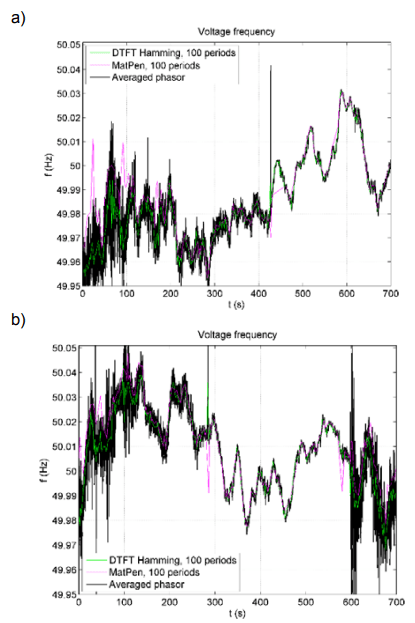
The results obtained by phasors are verified and confirmed with original, i.e. not downsampled, data with the DTFT (Discrete Time Fourier Transform) [5], the Matrix pencil algorithm [6-8], and the Interpolated Discrete Fourier Transform (IpDFT) [9]. Fig. 5 compares averaged instantaneous frequency computed by phasor with the Matrix pencil algorithm used as described in [7, 8] and the DTFT, both applied to signal in non-overlapping time windows of length equal to 100 periods of nominal frequency, i.e. 2 s. For the DTFT Hamming window was used and frequency step equal 0.001 Hz was set. The results of all three methods are in good agreement confirming observed phenomenon.

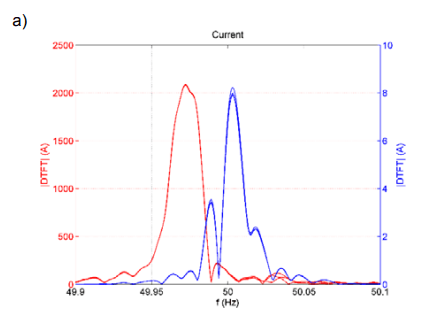

Especially, abnormal frequency behavior in Fig. 7b is easy to be observed. Figs. 7ab show the DTFT of three phase voltage and current computed in time intervals t1 and t2 (see Fig. 3). The frequency of signals in intervals t1 and t2 was estimated by the three points IpDFT with the Hann window presented in [9], i.e. for α=2. The mean frequency in all measurement points for time intervals t1 and t2 is 49.973 Hz and 50.004 Hz for the case “a” and 50.023 Hz and 49.992 Hz for the case “b)”.
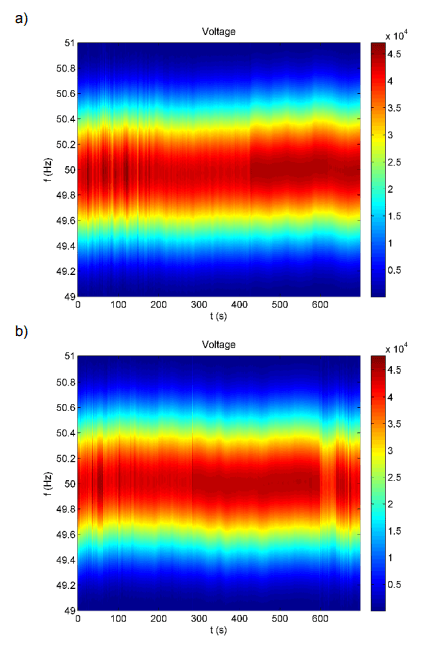
Fig. 8 depicts time-frequency voltage plots computed by DTFT with Hamming window with length 2s without overlapping with frequency step equal to 0.001 Hz.
Conclusion
The paper presents the results of spectral analysis of voltage and current signals supplying working arc furnace in industrial plant. It turned out that phasor measurements, based on computationally efficient FIR filter, can be used for spectral analysis in industrial plants, as confirmed by other more sophisticated and more computationally demanding frequency analysis methods.
REFERENCES
[1] Uz-Logoglu E., Salor O., Ermis M.: Online Characterization of Interharmonics and Harmonics of AC Electric Arc Furnaces by Multiple Synchrounous Reference Frame Analysis, IEEE Transactions on Industry Applications, vol. 52 no. 3, 2016, s. 2673–2683.
[2] Vatankulu Y. E., Şentürk Z., Salor O.: Harmonics and Interharmonics Analysis of Electrical Arc Furnaces Based on Spectral Model Optimization With High-Resolution Windowing, IEEE Transactions on Industry Applications, vol. 52 no. 3, 2016, s. 2673–2683.
[3] Duda K., Zieliński T. P.: FIR filters compliant with the IEEE standard for M class PMU, Metrology and Measurement Systems, vol. 23 no. 4, pp. 623–636, 2016
[4] Synchrophasor Measurements for Power Systems, IEEE Standard C37.118.1, Dec. 2011.
[5] Synchrophasor Measurements for Power Systems-Amendment 1: Modification of Selected Performance Requirements, IEEE Standard C37.118.1a, Apr. 2014.
[6] Duda K., Zieliński T. P., Barczentewicz Sz., Perfectly flat-top and equiripple flat-top cosine Windows, IEEE Transactions on Instrumentation and Measurement, vol. 65 iss. 7, 2016, s. 1558–1567.
[7] Hua Y., Sarkar T.K.: Matrix pencil method for estimating parameters of exponentially damped/undamped sinusoid in noise, IEEE Trans. Acoustics. Speech Signal Processing, vol. 38, no 5, s. 814–824,.
[8] Oppenheim A. V., Schafer R. W., Buck J. R.: Discrete-Time Signal Processing, 2nd ed. Englewood Cliffs, NJ, USA: Prentice-Hall, 1999.
[9] Zieliński T. P., Duda K.: Frequency and damping estimation methods – an overview, Metrology and Measurement Systems, vol. 18, no. 4, 2011, s. 505–528.
[10] Duda K., Zieliński T. P.: Efficacy of the frequency and damping estimation of a real-value sinusoid, IEEE Instrumentation & Measurement Magazine, vol. 16, iss. 2, 2013, s. 48–58.
Authors: dr inż. Szymon Barczentewicz, AGH University of Science and Technology, E-mail: barczent@agh.edu.pl, al. Mickiewicza 30, 30-059 Kraków; dr hab. inż. Krzysztof Duda prof. AGH, AGH University of Science and Technology, al. Mickiewicza 30, 30-059 Kraków, E-mail: kduda@agh.edu.pl; dr hab. inż. Andrzej Bień prof AGH, AGH University of Science and Technology, al. Mickiewicza 30, 30-059 Kraków, E-mail: abien@agh.edu.pl;
Source & Publisher Item Identifier: PRZEGLĄD ELEKTROTECHNICZNY, ISSN 0033-2097, R. 96 NR 5/2020. doi:10.15199/48.2020.05.10
