Published by Munther Naif Thiab1, nmunther2@gmail.com, Kaleid waleed abid2, kaleidwaleedabid@gmail.com, Muhideen Abbas Hasan3, muhyabass@gmail.com,
1, College of Engineering, University of Anbar, Iraq.
2, Renewable Energy Research Center / University of Anbar. Iraq.
3, Al-Dour Technical Institute, Northern Technical University, Iraq.
Abstract: Voltage and current harmonics arise in the presence of nonlinear loads in the major supply. Moreover, the presence of harmonics is associated with several problems such as cables overheating, induction motor vibration and overheating, as well as augmented losses in the transformers. This study analyzes the particular effects of harmonics on a 1-KVA transformer. The harmonics signal was generated on the transformer by using a frequency oscillator, while the total harmonic distortion, crest factor, and K-factor were investigated using a power analyzer (Fluke-435). The results are analyzed and compared for different orders of harmonics. The results are analyzed and compared for different orders of harmonics, especially with regard to the total harmonic distortion (THD) and k-factor, present standards like IEEE 519 provide a technique to limit the ability of an existing power transformer matter to non-linear load flows based on conservative assumptions.
Keywords: Harmonics, k-factor; Power analyzer (Fluke-435); Total harmonics distortion; non-linear an unbalanced load.
1. Introduction
Over the years, harmonic current and voltage distortions have been studied and mitigated by power system engineers [1, 2]. Given the increasing number of devices that contribute to the generation of harmonics such as diodes, power transistors, and rectifiers, we conjecture that power electronic loads will be vital components of power at all stages. This is due to their influence on controllability and effectiveness of power loads, which is evident from the observable increase in the level of harmonics and power network distortions [3].
Transformers are regarded as critical components in power systems. In single-phase transformers, the measurement of the iron and copper losses is significant, specifically for transformers that feed nonlinear loads. Power losses due to increased harmonic distortions and abnormal increases in the transformer temperature can be attributed to core stray magnetic losses, losses in the windings, and eddy currents. Thus, harmonics can have a detrimental effect on the power factor of capacitors when fitted and hence, resonance must be avoided in the supply inductance. Moreover, in the presence of harmonics, there is an approximate increase in the eddy current with the square of the current and as such, eddy current presents the most concern among the sources of current losses in transformers. This necessitates the determination of the harmonic spectrum of load currents prior to the estimation of excess losses [2, 4].
In the power systems, the use of nonlinear loads can often lead to reduction in the service life of a transformer because of the possible influence of increased heat losses. Therefore, certain conditions ought to be met before analyzing the performance of a transformer, such as a knowledge of the load mix, the total harmonic distortion (THD), and the details of the content of the load current harmonics. Two factors that contribute to the additional heating observed in a transformer, these are the design principles of the transformer and the load current harmonics [2].
The conversion of a 3-phase supply into 1 or 2 single-phase supplies is usually done using special transformers such as Scott and Le-Blanc transformers or V–V transformers. These are the transformers commonly used in electric locomotive traction systems. Previous studies have investigated the annulment of harmonics in such transformers. In [5, 6], researchers showed that when 2 harmonic-generating loads are connected to single-phase transformers on each side, the generated harmonics by the loads tend to annul each other at the transformers’ primary sides. The study further opined that the degree of annulment is determined by the type of transformer and the order of the harmonic[7].
In [8], researchers reduced harmonics in series-connected converters by introducing an averaging inductor in a series-connected converter to simplify the process of pulse multiplication. The novelty of this method was realized in a 3-thyristor switching circuit scheme that can support the operation of a 12-pulse double bridge at 36 pulses. Simulation studies validated the theoretical work, with the exception of a few modifications that are required to apply the proposed method for higher pulse operation.
As regards transient and harmonic analysis in electrical networks, companion harmonic circuit models (CHCMs), which deploy an exact periodic steady state initialization method, have been proposed [9]. The suggested CHCMs are based on the application of the trapezoidal integration principle to the differential equations of electric elements in the presence of dynamic harmonics. The CHCM technique was applied in a simple network with transformer saturation-generated harmonics. The CHCMs offered a direct way of estimating the harmonics’ steady state and transient response in an electrical system.
In this work, we study the effect of harmonics on a 1-KVA transformer to investigate the relationship between the order of the harmonics and the effect on the operating efficiency of the transformer.
2. Forms of Harmonics
The effect of harmonics is usually manifested in the form of irregular current or voltage (current harmonics) or voltage (voltage harmonics) waveforms. Bridge rectifier circuits usually produce current harmonics which it affects the electrical equipment that supplies harmonic current to either the conductors or the transformers. Third order harmonics have received significant research attention, which have led to the development of electrical systems that feed single phase loads which allow the neutral conductor to draw excessive current[13]. On the other hand, components of electrical devices are vulnerable to voltage harmonics that arise when current harmonics succeed in creating sags in the voltage supply. When current is drawn by a device, a voltage drop is generated that is required for the current to flow. An example of such phenomenon is the dip in voltage observed when switching-on a table saw or a hair dryer, which is manifested by the sudden dimming of lightbulbs [14]. The magnitude of the sag is influenced by multiple factors including the impedance of the transformer and the diameter of the wire. It is widely accepted that voltage harmonics are caused by current harmonics; however, the intensity of voltage harmonics depends on the ‘stiffness of the systems’ impedance during electrical distribution’. The relationship between current distortion and voltage distortion can be elucidated through the example of the common light bulb. The current THD of the low-cost light bulb may be about 75%, which implies that harmonic current accounts for 75% of the total current drawn by the bulb. The effect of light bulbs on other home devices is low because it creates a relatively small sag in the voltage supply to the house despite the fact that the current drawn by it comprises 75% harmonics. This effect can be better observed using a voltage analyzer, where the THD voltage is observed to be below 1% [15].
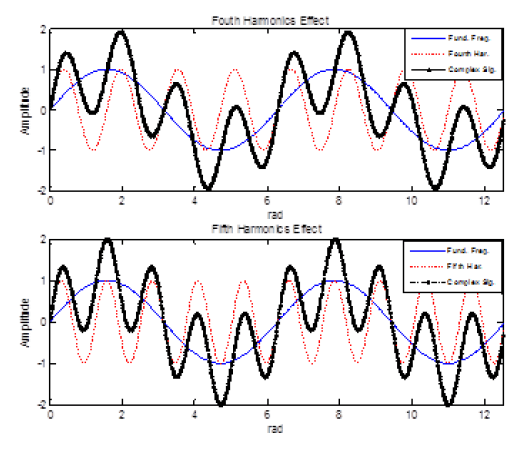
Figure 1 illustrates the effect of harmonics on the shape of the waveform. The upper row (left and right) shows the fundamental frequency, which comprises two circle waves ( 4πf0 ). The third subplot in this figure (left side of second row) represents the second harmonics (2f0), while the right side represents the third harmonics (3f0). The effect of these harmonics on the main waveform is shown in the last subplots (subplot 5 and 6). From these subplots, it can be seen that the third harmonics has a relatively larger effect on the shape of the signal waveform. Thus, third harmonics contributes more significantly to the fluctuation than second harmonics. Figure (2) illustrates the effect of fourth and fifth harmonics on the waveform. It can be observed that the odd harmonics still have a greater effect on the complex waveform shape. Therefore, odd harmonics (5, 7, 9, etc.) have a more pronounced effect on the shape of the waveform than even harmonics (2, 4, 6, etc.).

3. Harmonics reduction
In general, the effect of harmonics can be mitigated by selecting equipment with low THD currents, thereby reducing the effective THD voltage. However, in the case that the use of equipment with low THD current is prohibitive, alternative options exists such as the addition of line chokes or isolation transformers to reduce the harmonic currents. Moreover, current distortions, which have a pronounced effect on the voltage waveform, can be reduced by using a tuned capacitor. In addition, the system load distribution can be redesigned such that the total system impedance is reduced [15, 16]. Several solutions have been proposed for reducing the effects of harmonics, and are as follows
1) Reduction of current harmonics
• Through the addition of line chokes to the harmonics producing equipment.
• Through the addition of an isolation transformer to the harmonics producing equipment.
• Through the use of a 12- pulse or 18-pulse rectifying circuit instead of 6-pulse rectifying circuit.
2) Reduction of voltage harmonics
• Through the addition of a tuned capacitor bank to the source of current harmonics.
• Through optimization of transformer size and impedance.
3) Through the use of cost-effective and energy-efficient phase-shifting transformers, which are highly reliable passive devices that can control harmonics regardless of the load level served
Effect of harmonics on transformer losses In general, transformers are designed to have minimum losses in both sinusoidal currents and rated voltage. However, in recent years, the load current is no longer sinusoidal because of the increase in the number of nonlinear loads. Thus, the presence of the nonsinusoidal currents leads to in extra losses and increase in transformer temperature [7]. There are several ways of estimating harmonic load content, such as the use of the crest-factor, percent of THD, and the K-Factor, which can be used to determine the extra heat generated by nonsinusoidal loads. The crest factor(CF) expresses the ratio of the waveform peak value to the true RMS value [6, 8], and is represented as follows.

where Imax = peak value of the current waveform;
Irms = true value of the current RMS.
Percentage THD expresses the ratio the root-mean-square (RMS) of harmonic currents to the corresponding RMS value of the fundamental frequency [10-12].
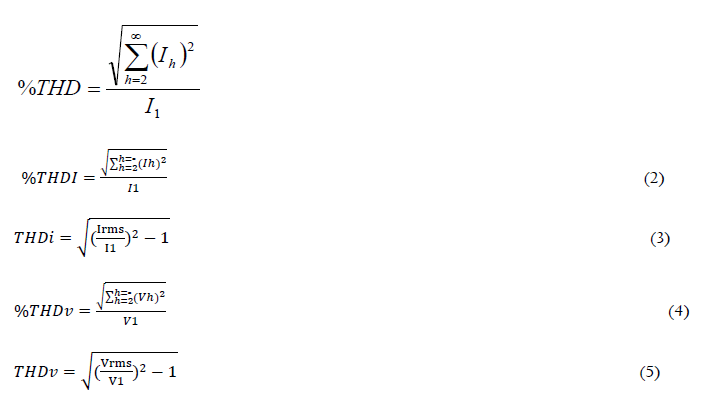
The last relation in equations (2,3,4,5) are for the determination of the extra harmonic currents and voltages to the total RMS values.
The K-factor, which is defined as the sum of squares of the harmonic current per unit multiplied by the square of the harmonic value, is also a widely used method.
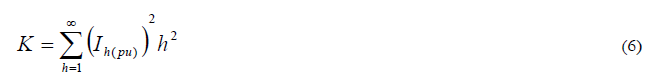
Here, Ih(pu) indicates the harmonic current per unit based on the magnitude of the fundamental current, and h represents the harmonic number [11,17].
The Non-linear loads which source harmonics are DC-AC inverters, magnetic devices, and rotating machines. Many motors that are used in industrial applications are composed of magnetic materials and are controlled by a changing flux and magnetic field. This increasing a back electromotive force (EMF) and conventional contributes to a form of THD known as voltage distortion (THDv) The inclusive load loss be able to be scheduled as [11, 18].
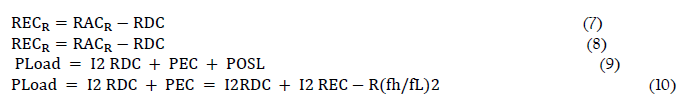
Where, REC-R is the equivalent resistance corresponding to the eddy-current loss, RDC is Winding DC resistance, PDC is the winding eddy-current loss, and fh is The Individual harmonic.
Small DC modules (up to the peak (rms) of the transformer excitation current at rated voltage (Vrms) are predictable to have no outcome on the load carrying capability of a transformer specified by this optional practice. Higher DC components may unfavorably affect transformer proficiency and should be avoided [19]-[20]. In observation, it is significant to use the existent harmonic current values sooner than for calculated values theoretically [20].
5. EXPERIMENTAL SETUP
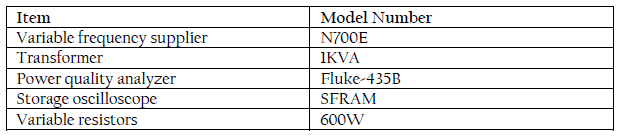
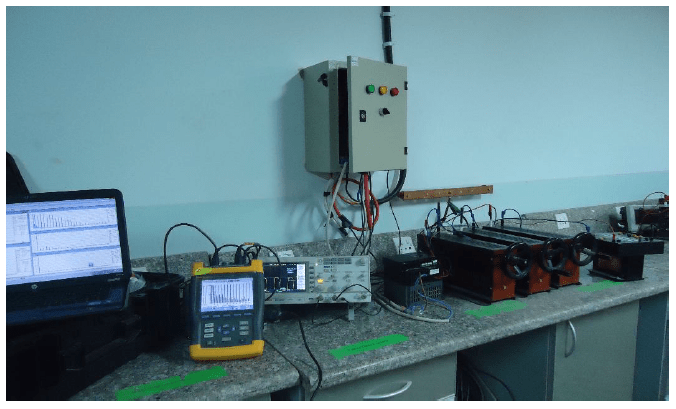
In this section, we present the results of a practical experiment conducted in this study to determine THD of a 1-KVA single-phase transformer. The experiment was performed using the devices listed in Table 1. The detailed used in the experiment are shown in Figure 3. A variable frequency supplier (N700E) was used for generating the 3rd, 5th, and 7th harmonic frequency on the transformer, while 600-W variable resistors were used for controlling the supplied voltage at different frequencies on the transformer.
Table 1. Components used in the experiment
5.1 Discussion and Results
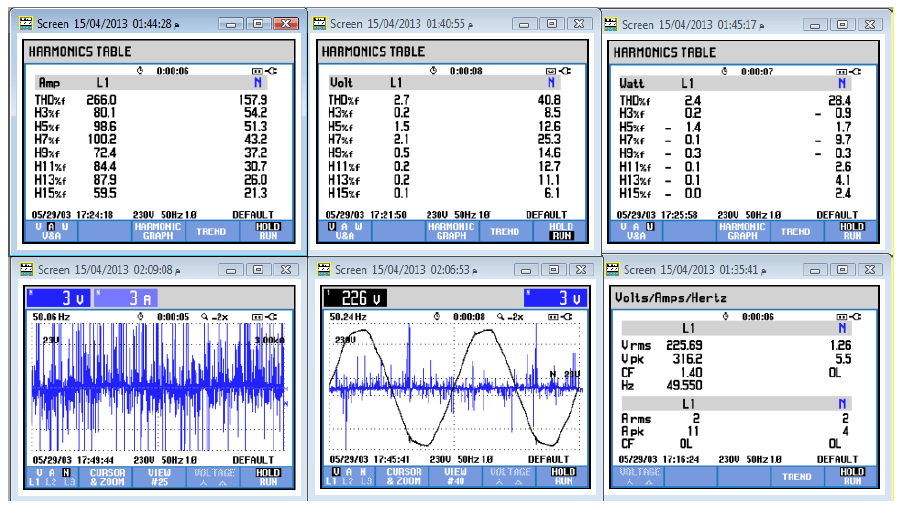
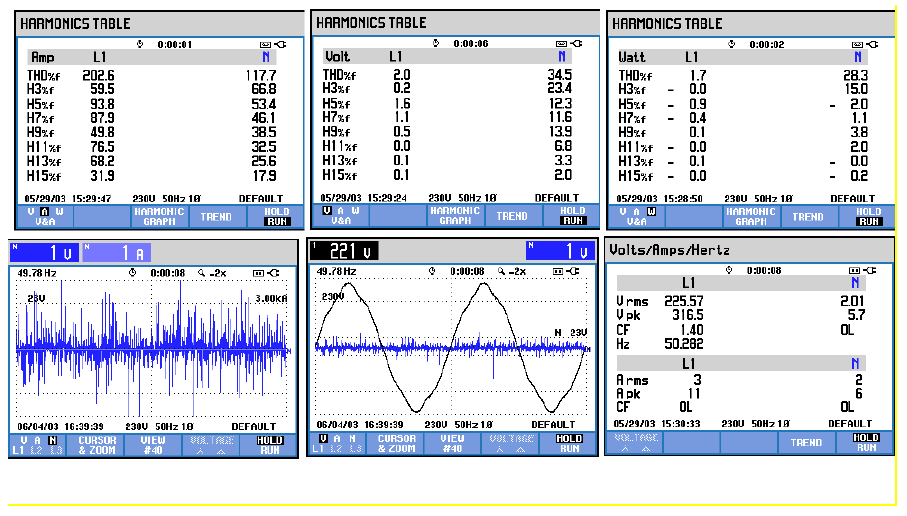
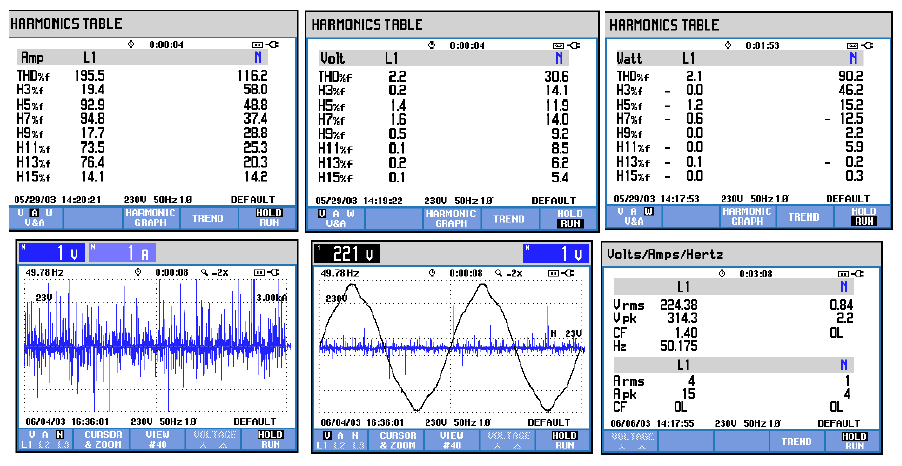
This section discusses the effects of harmonics on the 1-KVA single phase transformer. Figure (4) gives the harmonics effects in table forms. The upper figures represent the harmonics in Ampere, Volt, and Watt from left to right, respectively. In the first table, THDf = 266 and 157.9 for line (L1) and neutral (N), respectively; however, this value reduces as the harmonics increases to 250 Hz and 350 Hz, as shown in Figures 5 and 6. The corresponding values of THDf (250 Hz) = 202.6, and THDf (350 Hz) = 195.5. The values of THDf also decreased for neutral lines in the same tables, i.e., THDf = 157.9 at 150 Hz, THDf = 117.7 at 250 Hz, and THDf = 116.2 at 350 Hz. The other values in the tables represent the values of odd harmonics from H3 to H15. The values of harmonic percentages, expressed in Volts and Watt, are also shown in the same figures. The subplots in the bottom right of Figure. illustrate the harmonic effects as a function of Volts/Amps/Hertz. The harmonic percentage decreases as the applied frequency increases, as shown in Figures 4, 5, and 6). From the same subplots, the crest factor was constant at 1.4 because of the use of variable resistors for controlling the applied currents and voltages on the transformer; this implies that currents Imax and Irms were constant in equation (1). The subplots at the bottom-center of figures represent the main signal of 230 V (source voltage) in addition to the applied harmonics voltage of 23 V in the neutral line. From this figure, it is clear that the fluctuation in the shape of the signal is due to the effect of the applied harmonic signal on the transformer.
The other subplots (bottom-center) in the same figures represent the effect of harmonics on the signal shape (5th and 7th harmonics). Finally, the last subplots (bottom-left) represent the harmonic effects on the current waveform. In these subplots, the fluctuation was observed to be for the 3rd harmonics than the other values at 5th and 7th harmonics. This observation can be as expected because the amplitude of harmonics decreases as the order increases.
5.2 Effects of harmonics at different frequencies and K-Factor
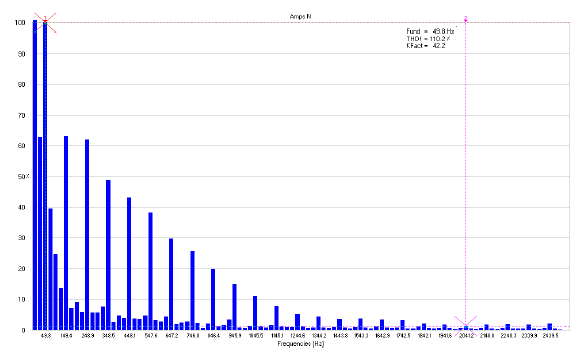
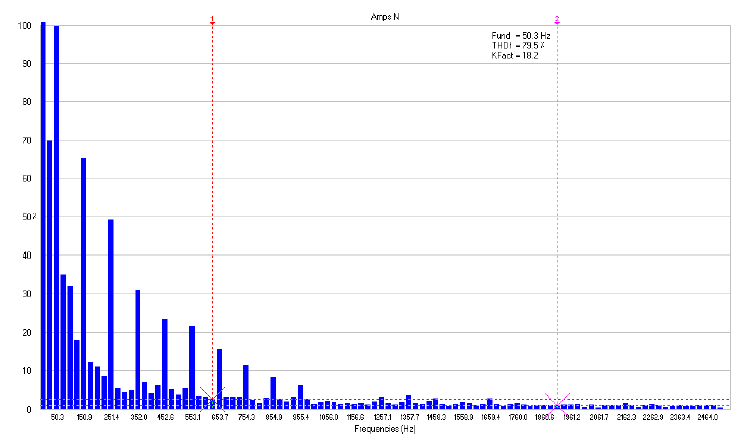
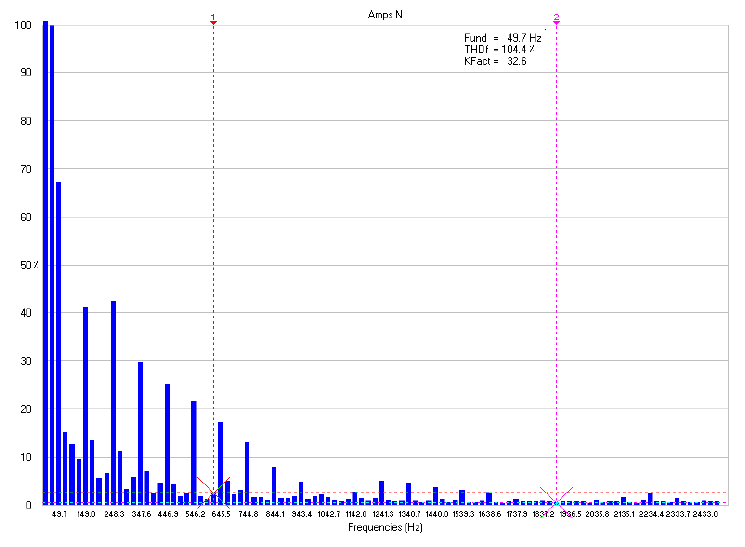
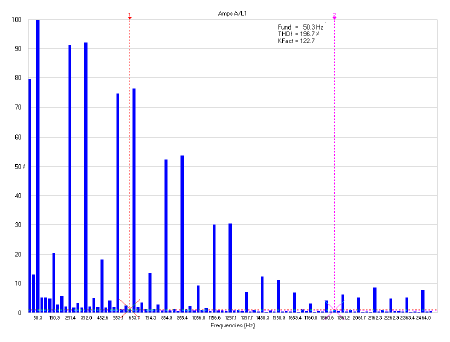
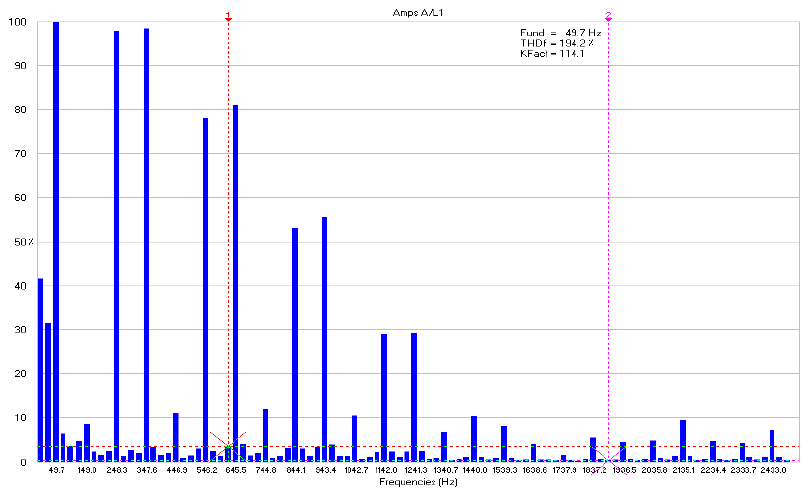
THD and K-factor can also be determined using the power quality analyzer (Fluke-435B). Figures 7, 8 and 9 show the amplitude of harmonics in the neutral line for the given current waveform. From the first two figures, THD and K-factor decreased as the frequency of the simulated harmonics increased. In Figure 9, THD decreased from 110.2% to 79.5%, while K-factor decreased from 42.2 to 18.2. In Figure 8, THD increases as a function of the corresponding value because the reading was taken in a high harmonics environment in the lab during the testing time, which was in addition to the already injected harmonics using the variable frequency supplier (N700E). From Figure 7, it is evident that the amplitude of harmonics decreases as the frequency on the x-axis increases. An amplitude of harmonics above 30% implies that the order of harmonics is less than 13, while a THD amplitude of less than 20% implies that the order of the harmonics is more than 17.
Figures 10, 11, and 12 illustrate the harmonic effects in neutral line for voltage waveform. From these figures, it is evident that THD and K-factor decrease as the frequency increases from 150 Hz to 350 Hz. Moreover, we can see that the maximum amplitude of harmonics lies at the odd integer of the fundamental frequency. Percentage THD in Figure 10 has an amplitude above 20% when the order of harmonics is below 31. Note that the values of harmonics are very high in Figure 10 for line voltage.
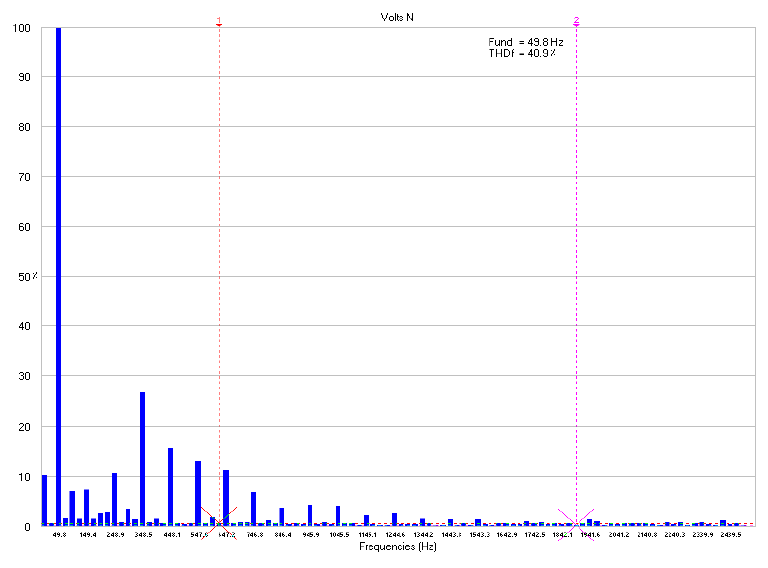
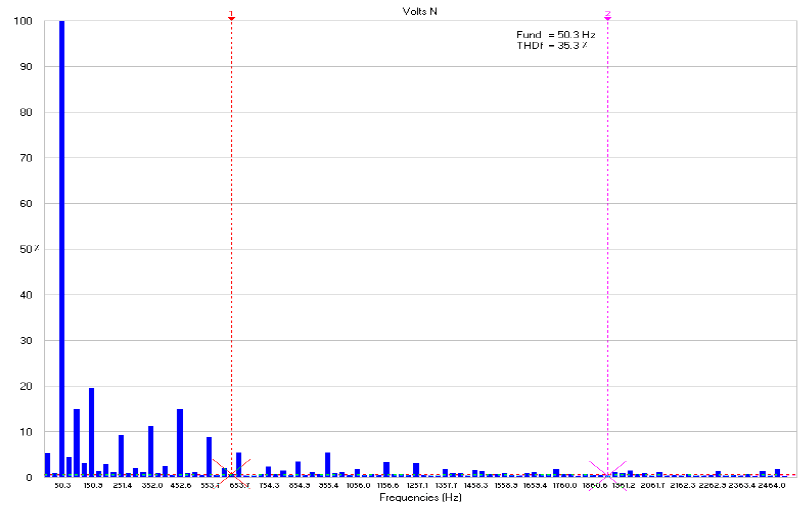
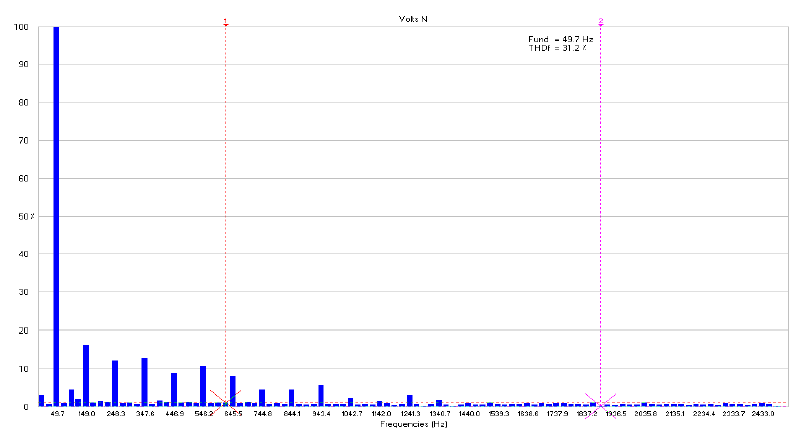
Figures 13, 14, and 15 show THD values for the voltage waveform in the neutral line. THD decreased from 40.9% at 150 Hz to 35.3% at 250 Hz, and subsequently reduced to 31.2% at 350Hz.

6. Conclusions
The distortions produced in current and voltage waveforms due to nonlinear loads can often lead to several issues in an electrical distribution system. In this study, the harmonic signals at the 3rd, 5th, and 7th order were simulated using a variable frequency supplier (N700E) by injecting the harmonics frequency on the load in a 1-KVA transformer. The results showed that the harmonics had pronounced effects on the current and voltage waveforms. Moreover, the maximum harmonics percentage occurred at the 3rd order and decreased at higher orders. The results also showed that the crest factor and K-factor decreased as the harmonics order increased.
*Corresponding Author: Munther Naif Thiab, Email id : nmunther2@gmail.com Article History: Received: Aug 15, 2018, Revised: Sep 10, 2018, Accepted: Oct 04, 2018
References
[1] A. Cataliotti et al., “Metrological performances of voltage and current instrument transformers in harmonics measurements,” in 2018 IEEE International Instrumentation and Measurement Technology Conference (I2MTC), 2018: IEEE.
[2] D. Ismail, H. Syafruddin, A. Rosnazri, M. Z. Samila, and A. H. Haziah, “The effects of harmonic components on transformer losses of sinusoidal source supplying non-linear loads,” American Journal of Applied Sciences, vol. 3, no. 12, pp. 2131-2133, 2006.
[3] S. PURUSHOTHAMAN ” ,DESIGN AND ANALYSIS OF ELIMINATION OF HARMONICS USING WIND ENERGY CONVERSION SYSTEMS,” Journal of Theoretical & Applied Information Technology, vol. 61, no. 3, 2014.
[4] S. Saodah, “Investigation of Transformer Losses and Temperature Rise,” Electrotehnica, Electronica, Automatica, vol. 66, no. 2, pp. 37-44, 2018.
[5] R. M. Patil, M. Nagaraj, and P. Venkataramu, “Harmonic Elimination System (HES) using a novel type of Pulse Width Modulation (PWM) scheme in Matlab-Simulink environment,” in Signal Processing, Communication, Power and Embedded System (SCOPES), 2016 International Conference on, 2016, pp. 40-47: IEEE.
[6] H. E. Mazin and W. Xu, “Harmonic cancellation characteristics of specially connected transformers,” Electric Power Systems Research, vol. 79 ,no. 12, pp. 1689-1697, 2009.
[7] L. UMASANKAR and N. KALAIARASI, “IDENTIFICATION OF INRUSH CURRENT AND INTERNAL FAULT CURRENTS IN A TRANSFORMER USING SELF ORGANIZING MAPS,” Journal of Theoretical & Applied Information Technology, vol. 58, no. 2, 2013.
[8] K. Xu, K. Meah, and A. S. Ula, “A novel method for reducing harmonics in series-connected rectifiers,” Electric Power Systems Research, vol. 78, no. 7, pp. 1256-1264, 2008.
[9] H. García, M. Madrigal, and J. Rico, “The use of companion harmonic circuit models for transient analysis and periodic steady state initialization in electrical networks with nonlinearities,” Electric Power Systems Research, vol. 93, pp. 46-53, 2012.
[10] S. Sadati, A. Tahani, B. Darvishi, and M. Dargahi, “Comparison of distribution transformer losses and capacity under linear and harmonic loads,” in Power and Energy Conference, 2008. PECon 2008. IEEE 2nd International, 2008, pp. 1265-1269: IEEE.
[11] N. Kotaiah and K. C. Sekhar, “INTEGRATION OF DISTRIBUTED GENERATION TO UPQC WITH UNIT VECTOR THEORY,” Journal of Theoretical & Applied Information Technology, vol. 95, no. 3, 2017.
[12] Alfredo Basulto Espinosa, “ESTIMATION OF SUBSTATION TRANSFORMER LOSSES UNDER NON-LINEAR AN UNBALANCED LOAD CURRENT,” CONGRESO ALTAE Conference. 2017.
[13] Thinh Dao, Bao Toan Phung, ” Effects of voltage harmonic on losses and temperature rise in distribution transformers,” IET Generation, Transmission & Distribution Journal,2017.
[14] Julio G. Mayordomo , Luis F. Beites, Ángel Carbonero, Xavier Yang, ,and Wilsun Xu,” An Analytical Procedure for Calculating Harmonics of Three-Phase Uncontrolled Rectifiers Under Nonideal Conditions,” IEEE TRANSACTIONS ON POWER DELIVERY, VOL. 30, NO. 1, FEBRUARY 2015.
[15] J. Zheng, “Transformer ac winding resistance and derating when supplying harmonic-rich current,” Michigan Technological University, 2000.
[16] R.A. Barr, V.J. Gosbell,”Power system harmonic voltage limits for the future,” International Conference on Harmonics and Quality of Power (ICHQP),2014.
[17] Mahrous A. Taher, Salah Kamel, and Ziad M. Ali,” K-Factor and Transformer Losses Calculations under Harmonics,” Eighteenth International Middle East Power Systems Conference (MEPCON), 2016.
[18] H. García, M. Madrigal, J.J. Rico, ” The use of companionharmonic circuit models for transient analysis and periodicsteady state initialization in electrical networks withnonlinearities”, Electric Power Systems Research, volume 93, 46–53,2012.
[19] Task Force on Harmonics Modeling and Simulation, “Modeling devices with nonlinear voltage-current characteristics for harmonic studies”, IEEE Transactions on Power Delivery, Vol. 19, pp. 1802-1811, 2004.
[20] Dr. Abla GADO, Eng. Hassan ABO GAD, Eng. Salah RADWAN, “EFFECT OF TYPES OF LOADS IN RATING OF TRANSFORMERS SUPPLYING HARMONIC-RICH LOADS”, 21st International Conference on Electricity Distribution Frankfurt,2011.
Article in Journal of Advanced Research in Dynamical and Control Systems · October 2018. Source URL: https://www.researchgate.net/publication/330811342_Effect_of_Harmonics_on_Power_Transformers_A_practical_demonstration_and_analysis
