Published by Electrotek Concepts, Inc., PQSoft Case Study: Substation Resonance and Harmonic Filter Application, Document ID: PQS0702, Date: July 26 1, 2007.
Abstract: A utility operates a 16.2 MVAr capacitor bank on a 24kV substation bus that supplies various customers that have significant amounts of nonlinear loads. The utility is investigating the possible conversion of the capacitor bank into a harmonic filter bank to control the frequency response characteristic and reduce the overall harmonic distortion levels. This case study presents some of the findings associated with a harmonic resonance study that included frequency scan simulations.
INTRODUCTION AND MODEL DEVELOPMENT
A substation harmonic resonance and filter application evaluation was completed for the system shown in Figure 1. The accuracy of the system model was verified using three-phase and single-line-to-ground fault currents and other steady-state quantities, such as capacitor bank rated current and voltage rise.

SIMULATION RESULTS
The frequency response characteristic is determined by using frequency scan simulations. A frequency scan is the most commonly used technique for harmonic analysis of power systems. A scan determines the impedance vs. frequency characteristic at a particular bus by injecting a one-amp current source at the bus over a range of frequencies and then observing the resulting voltage. The voltage is directly related to the system impedance in ohms. Frequency scan analysis is the best method for identifying resonance conditions and evaluating harmonic filter designs.
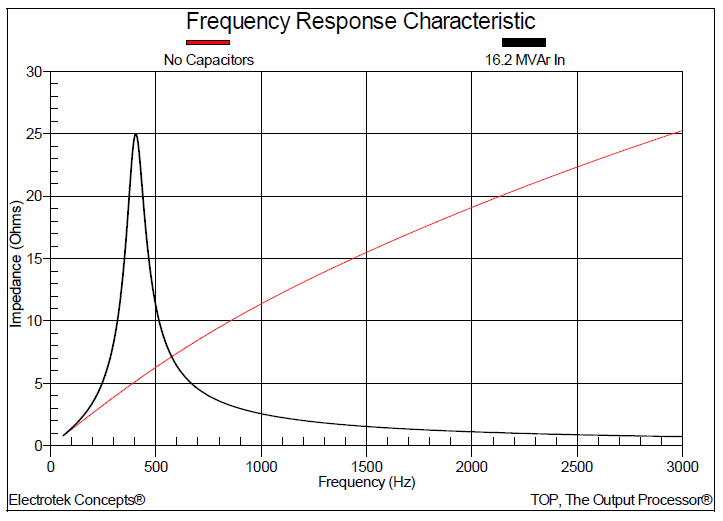
Figure 2 shows the impedance vs. frequency simulation result for the basecase condition that has no shunt capacitor banks in service. The frequency scan is completed at the 24kV bus at Substation 1 where the 16.2 MVAr capacitor bank is installed. The frequency range for the scan is from 60 Hz to 5,000 Hz, with a 1 Hz increment.

Figure 3 shows the impedance vs. frequency simulation result with the 16.2 MVAr, 24kV capacitor bank in service. The initial basecase result is also shown on the graph so the two conditions can be compared. The simulated parallel resonance due to the addition of the shunt capacitor bank was 404 Hz (6.73th harmonic). A simple hand-calculation can be used to validate this result:
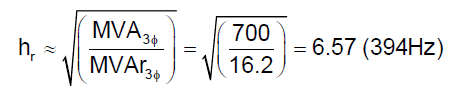
where:
hr = parallel resonant frequency (x fundamental)
MVA3φ = three-phase short circuit capacity (MVA = √3*24kV*16.85kA≈700MVA)
MVAr3φ = three-phase capacitor bank rating (MVAr)
The simulated resonant frequency is slightly different from the calculated value. This is primarily due to the capacitance of the distribution feeder (that is ignored during the hand-calculation approximation) and the effect of load. The simulated steady-state voltage rise of 2.28% (23.4183kV vs. 23.9523kV) is also quite close to the calculated value:

Figure 4 shows the effect on the simulated frequency response characteristic when adding the two 300 kVAr, 4.16kV capacitor banks. The simulated parallel resonance is shifted slightly to 432 Hz (7.2th harmonic).
Because the resonant frequency shown in Figure 4 is near the 7th harmonic (432 Hz), it might be assumed that the solution to the problem would be to convert the 16.2 MVAr capacitor bank into a 7th harmonic filter. This would seem at first to be a reasonable approach since the goal of applying a harmonic filter is to change an uncontrolled high impedance (high voltage distortion) condition to a lower impedance condition (low voltage distortion). Figure 5 shows the impact on the simulated frequency response characteristic when converting the capacitor bank into a 7th harmonic filter. The previous case results are also shown on the graph so the conditions can be compared.
As can be observed in Figure 5, the high impedance near the 7th harmonic is replaced with a lower impedance value. This would suggest that the resulting voltage distortion should also be reduced when the filter is applied. However, the application of a single-tuned shunt filter bank creates a new parallel resonance that must also be evaluated. The simulated new parallel resonance frequency is 288Hz (4.8th harmonic).


The harmonic number for the new parallel resonance may be approximated using:
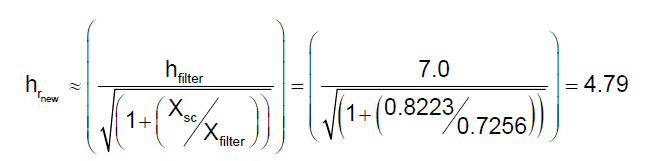
where:
hrnew = resulting (new) parallel resonant frequency (x fundamental)
XSC = system short circuit reactance (Ω – (24kV/√3)/16.85kA=0.8223Ω)
Xfilter = reactance of series filter reactor (Ω)
This frequency should be checked when designing shunt harmonic filters to make sure that a parallel resonance is not introduced at a lower order characteristic harmonic. In this example, installing a 7th harmonic filter retunes the system near the 5th harmonic which may actually increase the voltage distortion level. It is generally good practice to apply filters starting at the lowest characteristic harmonic to avoid this problem (e.g., 4.7th filter for six-pulse drive load).
Figure 6 shows the influence on the simulated frequency response characteristic when converting the 16.2 MVAr capacitor bank into a 4.7th harmonic filter. The previous case results are also shown on the graph so the conditions can be compared. The application of the 4.7th harmonic filter results in a new parallel resonance frequency that is 230Hz (3.8th harmonic).

SUMMARY
A harmonic filter provides a low impedance path for harmonic currents, thereby minimizing harmonic voltage distortion problems. The filter is generally tuned slightly below the harmonic frequency of concern. This method allows for tolerances in the filter components and prevents the filter from acting as a short circuit for the offending harmonic current. A general method for applying filters includes:
1. Apply one single-tuned shunt filter first, and design it for the lowest generated frequency (e.g., 4.7th).
2. Determine the voltage distortion level at the bus. The commonly applied limit of 5% was introduced in IEEE Std. 519.
3. Vary the filter elements according to the specified tolerances and check its effectiveness.
4. Check the frequency response characteristic to verify that the newly created parallel resonance is not close to a harmonic frequency.
5. Complete standards compliance check (e.g., IEEE Std. 519) if required.
6. If necessary, investigate the need for several filters, such as 5th and 7th.
REFERENCES
IEEE Recommended Practice for Electric Power Distribution for Industrial Plants (IEEE Red Book, Std 141-1986), October 1986, IEEE, ISBN: 0471856878
IEEE Recommended Practice for Industrial and Commercial Power Systems Analysis (IEEE Brown Book, Std 399-1990), December 1990, IEEE, ISBN: 1559370440
IEEE Recommended Practice for Protection and Coordination of Industrial and Commercial Power Systems, March 1988, IEEE, ISBN: 0471853925
