Published by Prof. Silviu Darie, PhD (EE), Technical University Cluj Napoca, Romania, Honorary Member of the Romanian Technical Sciences Academy. Email: silviu.darie@enm.utcluj.ro.
Abstract: Based on the author’s experience one describes in field tested methodologies which can be employed in solving the frequency-based power quality problems. A generic approach is presented and an experience-based assessment is provided. After defining the main harmonics indices a case study with three (3) scenarios/cases with personal computer application is presented. PTW/SKM professional software is employed.
Keywords: Nonlinear loads, bus voltage total harmonic distortion, (THD-V), branch current total harmonic distortion, (THD-I), total harmonic demand distortion, (TDD), computer aided harmonic analysis, case study computer assisted.
1. Introduction
This paper provides the procedures that one should employ while Harmonics Analysis Investigation is of concern. One should highlight that Harmonic Analysis comprises several steps. The first step is to determine if harmonics exist in the given power systems. Usually this is given by a site survey and site measurements. Please notice that a close cooperation with the plant engineer is a “must-use” dialog. Once that the power system one line is provided and the filed data has been collected building the electrical model follows. Several professional power engineering software can be employed, such as PTW/SKM, ETAP, DigSILENT, CYME, EasyPower, Paladin DesignBase, etc. While the power system is built, all the power system components and system layout should in detail be considered. Once the model is completed, the harmonic sources are generated and then injected at the existing points of harmonics sources. The power system model has to be consistent with the requirements of IEEE 519-2014, IEEE-399 (Brown Book) and IEC 500 standards. As a rule, once the power system is built in any professional power software, always run Power Flow. The convergence of Power Flow demonstrates that the system is feasible and the input data is consistent.
1.1 Methodology
Based on the site survey the study power system layout, power system components data and system operation scenarios are collected. In general, the Harmonics Analysis study is conducted to determine:
• Bus voltage waveform, bus voltage spectrum and bus voltage total distortion THD-V % at Point of Common Coupling (PCC) or at all of the power system panels in the system model, if the project owner requires; Branch current waveform, branch current spectrum and branch current total Distortion THD-I % at all of the branches which fed the panels in the system model;
• One recommends computing the total “Harmonic Voltage” and current indices; this gives the bus voltage fundamental magnitude V1 and the bus actual voltage Vrms considering harmonic contribution; branch current fundamental I1 and branch actual Irms current considering the harmonic contribution;
• The harmonic voltage and current.
1.2 Assumptions
When necessary, assumptions are made based on mutual agreement and with suitable technical and/or the other relevant applicable arguments. Bus IDs, branch names and equipment characteristics are shown on the Computer Program model drawing and project database. Equipment Names should be input as per “project as built”. However, in completing the plant model one uses plant one-line drawings and data from site survey of the existing equipment.
2. Harmonics investigation
2.1 Harmonics indicators
There are several indexes which can be used to measure the harmonics impacts to the power network. The most commonly used indexes are, [3, 6, 8, 9, 11]:
• Total harmonic distortion;
• Total harmonic distortion for bus voltage, V-THD (%);
• Total harmonic distortion for current, I-THD (%);
• Total harmonic demand distortion, TDD for branches;
• Telephone interference factors, if this is requested IT.
2.2 Harmonics voltage distortion
Harmonic voltage distortion index Vn% is the r.m.s. amplitude of a harmonic voltage of order “n” expressed as a percentage of the r.m.s. amplitude of the fundamental, [8, 11]:
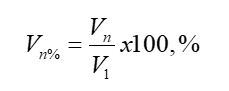
with, n ≠ 1
2.3 Harmonics current distortion
Harmonic current distortion In% is the r.m.s. amplitude of a harmonic current of order “n” expressed as a percentage of the r.m.s. amplitude of the fundamental, [8, 11]:
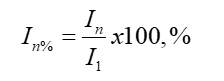
with, n ≠ 1
2.4 Total harmonic bus voltage distortion, V-THD, %
Total harmonic bus voltage distortion, (THD-V)% is defined as, [8]:
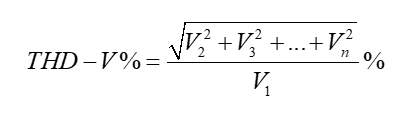
where:
V2, V3, …Vn are the individual harmonic voltage magnitudes, in V;
V1 is the fundamental frequency of the voltage magnitude, in V.
The total harmonic distortion factor, THD can be computed by using the field measurements results, or by using a professional software such as HI_WAVE, of PTW/SKM – [www.skm.com] to simulate the network and compute THD at different bus location. By setting the program, THD is calculated for all network busses and any THD larger than a target value is flagged in the output results
Bus total harmonic distortion, (THD-V)% should normally be less than 5%. The IEEE 519-2014 Standard recommends, [3]:
Table 2.1 Bus total harmonic distortion, [3]
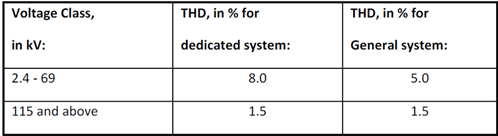
Note: One should note that the voltage distortion level is dependent on the system impedance characteristics and the harmonic current injected by the individual harmonic sources.
The table 2.2, below, gives the IEEE 519 -2014 current limits as function of the short circuit factor Isc / ILoad,[3].
Table 2.2 Harmonic current limits, [3]
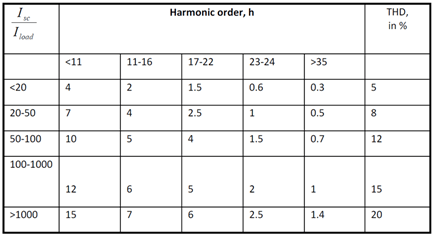
where:
Isc is the short circuit current at the PCC, in A;
ILoad the load current, in A at the PCC.
3. Computer assisted harmonics analysis
Based on the author’s experience one proposes the procedure listed in in Figure 4.2. Please note that once the system is modelled, power flow always should be run. The convergence of the power flow demonstrates that the modeled system is feasible and the input system data is consistent. The guidelines that address harmonics share a common goal: to maintain the quality of electrical power at the point of common coupling (PCC). One meets such a goal if one limits the harmonics-induced voltage distortion at the point of common coupling, PCC. The “point of common coupling” is the interface between sources and loads.
Most experts select the primary of a feeder transformer as the PCC and the distortion is measured here.
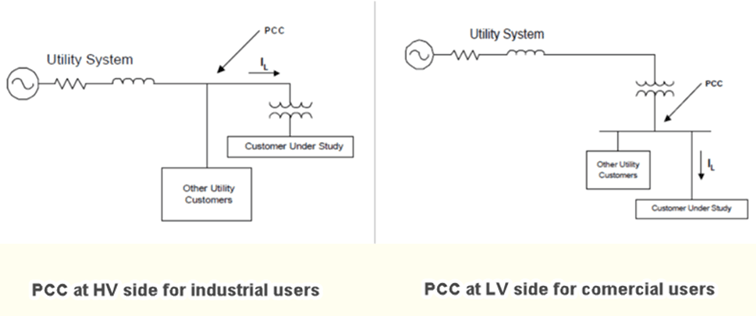
3.1 Point of common coupling
On recommends selecting the PCC on the primary side of the main distribution power transformer for industrial projects, or the secondary side for commercial supply, Figure 3.2, [3].
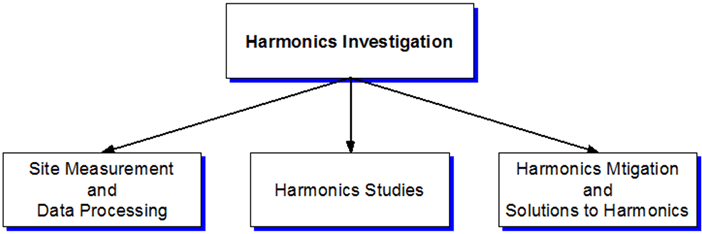
3.2 Harmonics investigation procedure flow chart
Based on a large number of projects completed by the author one provides a practical guide on harmonics analysis and harmonics investigations, Figure 3.5.
In harmonics-based power quality investigation, the consultant engineer should well understand the study power system and should recommend a site visit. However, based on the site survey the consultant engineer will collect all the power system data, network structure, electrical loads, type of cabling and earthing, machine parameters as built. Also, the operating regimes will be considered. Site visits are the best time to compare, update and correlate the project data with the real data collected from the field.
Harmonic measurements may be made on power systems at the consultant engineer request for several reasons, such as:
• To identify the source of harmonics and harmonic source location;
• To determine the spectrum of harmonics current and voltage;
• To confirm the findings of a simulation;
• To verify previous harmonic studies (if this exist) and check the filter design impact;
• To perform measurement of harmonic mitigation devices.
During the site survey the network database is collected and saved. The following data is needed:
• Network one-line diagrams as built;
• Network parameters including feeder longitudinal and shunt impedance, power transformer name plate data and parameters, reactor name plate data, motor data and operating regime, generator data and running regime;
• Electrical loads and generation;
• Load profile and structure;
• Type of harmonic source and harmonics components.
Note: Computer programs are used to calculate the levels of harmonic distortion, harmonic current flows and the effects of different filter designs;
The database should be organized consistent with the requirements of the software to be employed for network investigation.
4. Computer aided power system harmonic analysis
4.1 Scope of study
The Harmonic Study is to compute the Total Demand Distortion (TDD) and Bus Total Harmonic Distortion (THD-V) at the defined PCC. The purpose of imposing limits on the harmonics emissions is to ensure that the current and voltage distortions at the Point of Common Coupling (PCC) be kept at a low level as possible. Thus, the other customers connected at the same point are not disturbed.
The Harmonics analysis may be completed by several professional software program, and should be consistent with the requirements of the current standards (IEEE 519-2014 Standard, IEEE Brown Book, IEC 509, etc.). In this paper the PTW/SKM industrial power software is employed, www.skm.com, [13].
4.2 Methodology
While generating the power system model, the power system data is provided by the electrical contractor and the design team, the joint venture personnel and the design office of company that is involved in the study. Also, one needs to get the data obtained from the vendor’s submittals on the equipment that is being installed in the project.
The harmonics analysis is performed to calculate the followings:
• Bus voltage waveform, spectrum and bus voltage total distortion. The bus THD-V at all the panels in the power system model;
• Branch current waveform, branch current spectrum and branch current total distortion, the current THD-I;
• The total harmonic voltage and current indices; these give the bus voltage fundamental magnitude V1 and the bus actual voltage Vrms considering harmonic contribution; branch current fundamental I1 and branch actual current Irms considering the harmonic contribution;
• Compute the harmonic voltage and current;
• Design filters if needed.
The Harmonic study should include:
• A detailed computer model of the electrical power system using the requested professional software program. The model should allow any system studies, “what if” scenarios, system performance analyses, power quality investigation, etc.;
• Input data and assumed data reports;
• Harmonic Analysis.
4.3 Computer aided harmonic analysis
The power system harmonics analyses are performed to assess the followings:
• Frequency Scan (Impedance versus frequency analysis). It is important analysis for predicting the system resonances in the distribution system. Peaks of the impedance plot indicates parallel resonance conditions while valleys are an indication of series resonance;
• Voltage Distortion Analysis – voltage harmonic distortions should be calculated at all of the buses in the distribution system and the results will be compared with IEEE-519 harmonic limits;
• Current Distortion Analysis – current harmonic distortions should be calculated for all of the distribution system and the results will be compared with IEEE-519 harmonic limits.
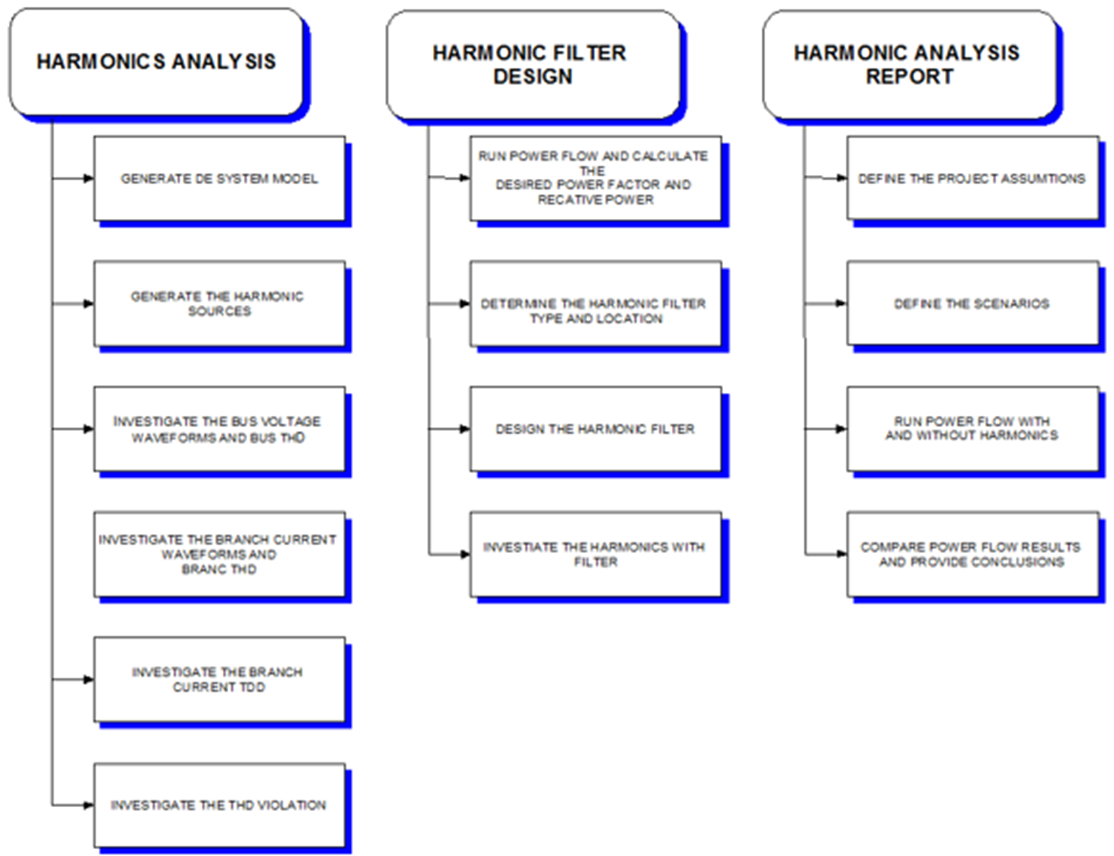
The Figure 4.1 provides the recommended procedure and steps for harmonic analysis:
1. Generate the power system model as built;
2. Obtain from the company the relevant data and requirements at the point of common coupling. These must include: minimum and maximum fault levels for different system conditions; permissible limits on harmonics including distortion factors and IT factor; The criteria and limits vary considerably from country to country;
3. Complete harmonic analysis for the base system configuration;
4. Compute harmonic voltage distortion factors and IT (if this is requested) value at the point of common coupling;
5. Examine the power system results: bus voltage drops, feeders and power transformers loading, power factor, power system losses;
6. Go back to step 1 or step 4, depending on whether the network data or only the parameters of the analysis need to be modified;
7. Check the power system losses without and with the harmonics present in the system;
8. Calculate the requested shunt capacitor ratings to reach the desired power factor; Apply a detuning reactor if a resonance condition is found. Go back to step 4;
9. Design and add harmonic filters if the harmonic distortion factors value at the point of common coupling exceeds the limit imposed by the utility.
5. Harmonic analysis: case study – generic power system
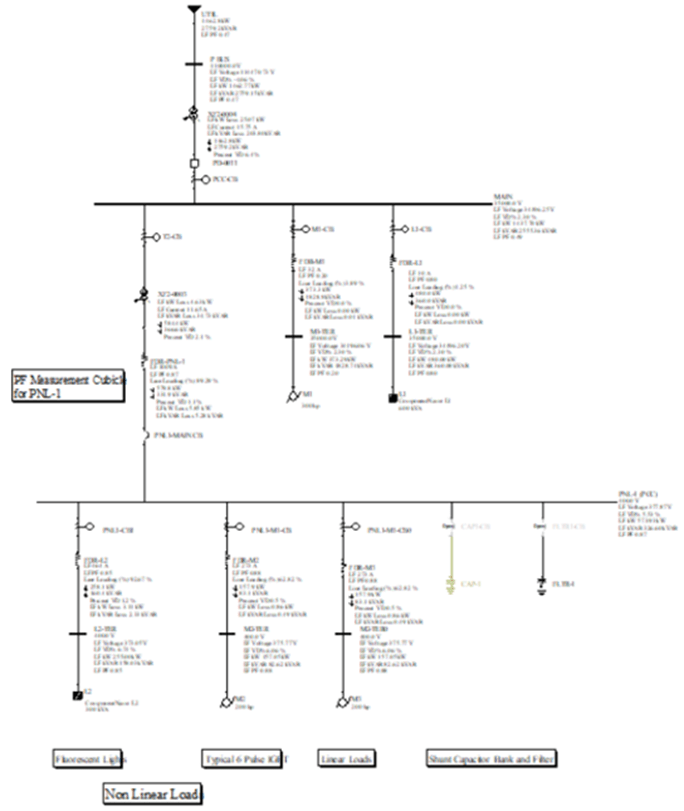
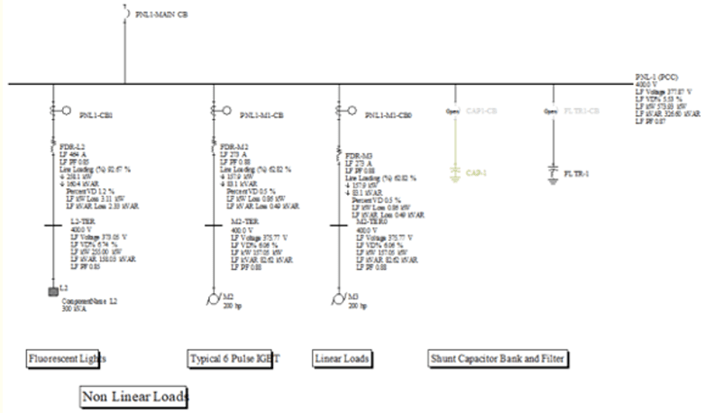
One considers the study system presented in the Figure 5.1. As can be seen, at the MAIN switcher several circuits are reticulated; a static load L3, one M1 motor circuit and a 400 V PNL-1; 2 motors M2 and M3 are connected to the panel PNL-1; motor M2 is supplied via a VFD system; the total static load connected at the PNL-1 is represented by a composite static load L2 which has harmonics generated by the fluorescent system.
The harmonic analysis is performed by employing PTW/SKM (www.skm.com) professional software. The PTW/SKM is a powerful industrial power software for designing and analysis of power system. It is worldwide employed by consultant engineers, designers and utility engineers. The PTW/SKM is on the market for more than 38 years. It has a powerful Graphical User Interface (GUI) with several power system calculations, a large power system database and intuitive display information. The PTW/SKM is used by over 35,000 engineers worldwide, offering specialized Power Tools design and powerful modeling and documentation capabilities. Professional trainings are provided for PTW/SKM users.
For this study, three (3) Scenarios/Cases are considered as flows:
Scenario 1 /Case1: all harmonic sources are ON, harmonic filter is OFF and the power factor shunt capacitor CAP-1 is OFF;
Scenario 2/Case2: normal, with shunt capacitor CAP-1 On, all harmonic sources ON, harmonic filter OFF and the power factor shunt capacitor CAP-1 is ON;
Scenario 3/Case3: the power factor shunt capacitor CAP-1 is OFF, all harmonic’s sources are ON, the harmonic filter is ON.
5.1 The power system model input data
A summary of the power system model input data is listed in the Table 5.1.
Table 5.1 Power System Model Input Data

5.2 The harmonic sources
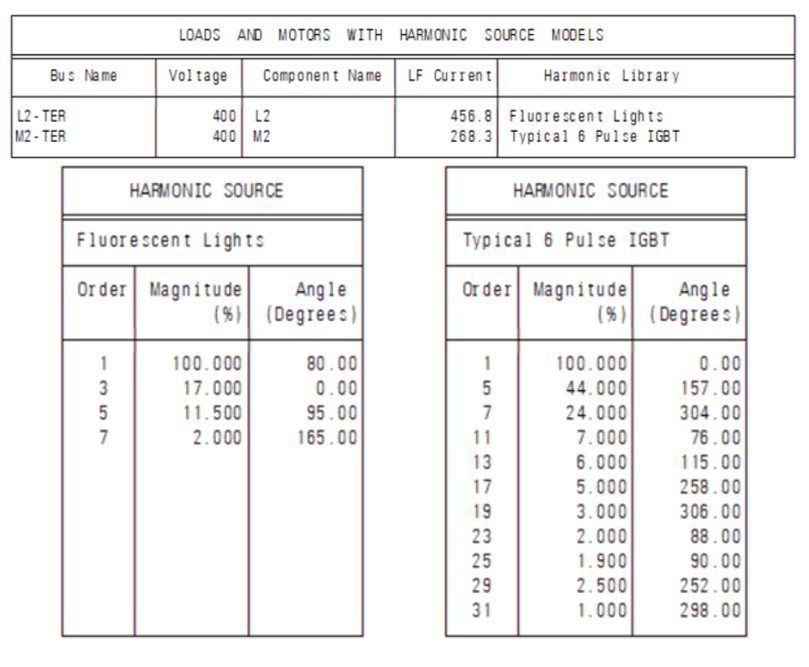
The harmonics sources present in the system study are:
• Typical 6 Pulse IGBT at the motor M1;
• The fluorescent lights at the static load L1.
The Figure 5.2 and the Table 5.1 provides the harmonic sources characteristics:

Table 5.2 Loads and Motors with Harmonic Source Models
6. Harmonics investigation
6.1 Frequency scan
Frequency scan is performed with the shunt capacitor bank OFF, Case 1 and with the shunt capacitor bank ON, Case 2, Figure 6.1.
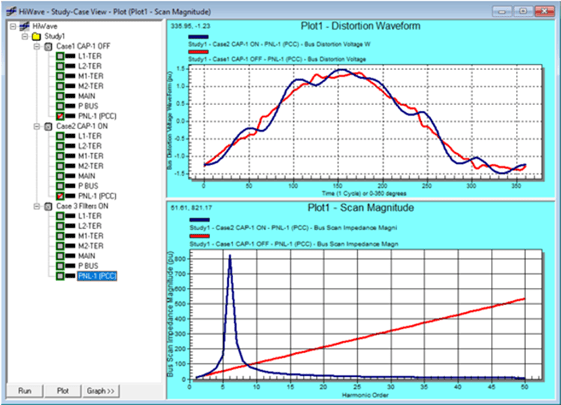
Note: As can be seen from Figure 6.1 the shunt capacitor CAP-1 generates resonances and it represents an harmonic amplifier.
The frequency response shape at a given bus depends on the existing or not of a shunt capacitor bank in the power system. Several problems may occur when the system response exhibits a parallel resonance near one of the harmonic components which are in the system (usually the 5th or the 7th harmonic). The resistive load provides damping near these resonant frequencies. The combination of these two factors determines whether or not a harmonic problem will exist at a particular bus.
6.2 Bus voltage waveforms and distortion spectrum
One investigates both the voltage distortion and the distortion spectrum at the MAIN bus, above the PNL-1 (PCC) bus in order to monitor the harmonic penetration towards Utility source, Figure 6.2
There are several indexes which can be used to measure the harmonics impacts to the power network. The most commonly computed indexes are:
• Bus total harmonic distortion, V-THD (%);
• Branch current total harmonic distortion, I-THD (%);
• Total harmonic current demand distortion, TDD for branches;
• Telephone interference factors, IT.

In Figure 6.2 a) represents the MAIN bus voltage waveforms, in blue color and the bus PNL-1 (PCC) in red color.
Figure 6.2 b) represents the bus voltage distortion spectrum.
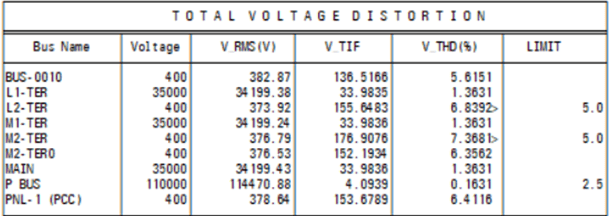
The total voltage distortion, for Scenario/Case 1 (CAP-1 OFF) is listed in the Table 6.1. One should note that the voltage distortion level is dependent on the system impedance characteristics and the harmonic current injected by the individual harmonic sources.
Table 6.1 Total Bus Voltage Distortion, Case1
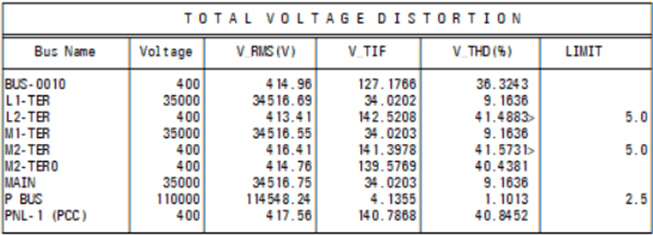
While the shunt capacitor is ON, Scenario/Case 2 which is the normal regime, large bus voltage distortion is induced at the PNL-1 (PCC) bus, see Figure 6.3 in the blue color. One can see that the 5th and the 7th harmonic orders are generated.

The shunt capacitor bank works as an harmonic amplifier; the curves in blue color. The 5th and the 7th harmonics are increased to 4.788 and 6.759 respectively, in per unit, Figure 6.3.
While the shunt capacitor is ON, Case 2, the bus voltage distortion is increased, see Table 6.2.
Table 6.2 Total Voltage Distortion, Case 2 the Capacitor Bank CAP-1 is ON
Harmonic studies are performed to determine the harmonic distortion levels and filtering requirements within a study facility. In general, field measurements and computer simulations are used to characterize the impact of the nonlinear loads. Based on the computer simulations the required harmonic filter is selected and sized. The application of harmonic filters will significantly alter the frequency response of the power system.
The level of the harmonic distortion is dependent on two important factors:
• The level of harmonic distortion; harmonic currents are generated by loads which have nonlinear “voltage-current” characteristics;
• The number and sizes of the nonlinear devices at a given bus determines the level of harmonic current generation.
If local resonances exist, then it is also possible the harmonic problems to occur at buses remote from the harmonic sources. If capacitors are applied at any locations, the potential for resonance problems must be considered carefully.
The following technical solutions can be employed:
• Harmonic filtering;
• Installing capacitors banks and filters;
• Increase pulse number of electronic devices;
• The use of custom power technology and products.
For harmonic mitigation one uses the tuned harmonic filters. Harmonic filtering is a typical mitigation technique which is employed by the utility, industrial and commercial systems. Basically, there are two types of filters:
• Passive filters, where the filter components are passive elements such as resistor, inductor and capacitor;
• Active filters, where the filter has a controlled current or voltage source.
7. Harmonic filter design
For harmonic filter design on should start by investigating the actual power factor. For this, one runs the power flow and check the system power flow results. The convergence of the power flow demonstrates that the system is feasible and the input data is consistent. The bus voltages and the branch current should be within the standard limits.
Further, one may consider the followings rules of thumb in designing the harmonic filter, [11, 13]:
• Always start mitigating the harmonics with the lowest harmonic order;
• Connect the filter near to the harmonic sources;
• It is a good practice to tune the filter to (3 to 5) % below the harmonic order to be mitigated;
• The filter reactive component C (Q) will compensate the power factor close to the desired power factor (client request);
• Increase the filter Q to produce higher harmonics mitigation: in this particular situation this is dangerous due to the excessive increase of power factor at the panel where filter is installed. During a plant operation with low system loading, this issue will generate problems with the system reactive stability;
• Above tuned frequency the harmonics are absorbed;
• Below tuned frequency the harmonics may be amplified.
7.1 Power flow results
While shunt capacitor bank is OFF, the power factor at PNL-1 (PCC) is LFPF = 0.87. Let’s assume a desired power factor of 0.97; in this case, a 200 kVAR reactive power is requested. This amount of reactive power will be considered while harmonic filter will be sized.
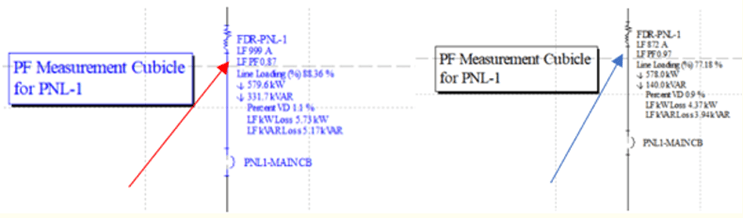
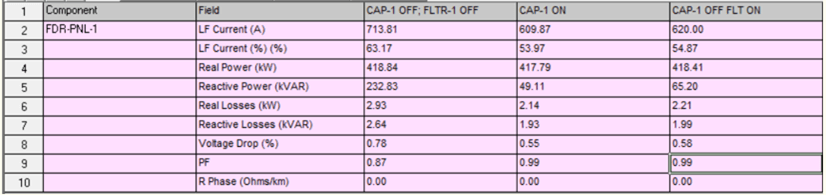
Based on power flow analysis, the comparative results are provided by the “SKM Visualizer” as listed in Table 7.1.
The power factor is computed at the Power Factor Measurement Cubicle for each Scenario/Case. One has to note that the power flow analysis application does not consider the harmonics.
Table 7.1 Comparative Power Factor Results: CAP-1 OFF, PF = 0.87; CAP-1 On, PF = 0.99
7.2 Harmonic filter sizing
To reach the requested power Factor of 0.97 the harmonic filter capacitor should be 250 kVAR. With this capacitor bank value, the harmonic filter sizing becomes:
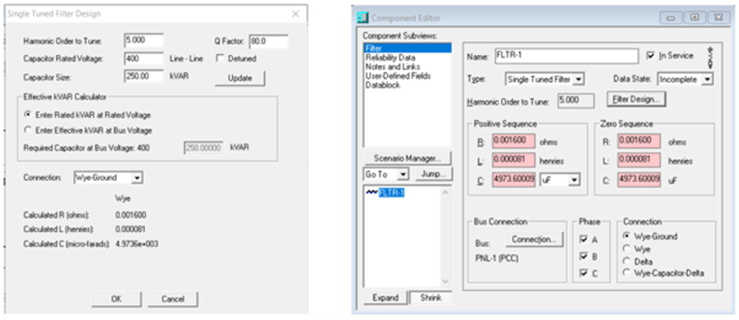
Single Tuned Filter Data: FLTR-1
Rated voltage 400 V;
Capacitor size: 250 kVAR;
Harmonic order to tune 5.00;
Q Factor: 80;
C = 4973.60009.
Once the harmonic filter has been sized and connected to PNL-1(PCC) bus, one performs harmonic analysis by employing the PTW/SKM professional software. The harmonic analysis results are provided via the Tables 7.2 -7.20. Some of the tables are listed in the body of the paper, the others are listed in the Appendices which are part of this paper. The following harmonic analysis were completed for Scenario/Case 3 FLTR-1 ON:
• The comparative harmonic studies results: Total Bus Harmonic Distortion V(THD) % for each Scenario; Table 7.2 for the power system components;
• Voltage distortion summary, Table 7.3;
• Total voltage distortion, Table 7.4;
• Total Current Distortion, Table 7.5;
• Current Distortion Summary, Table 7.6;
• Harmonic Voltage Spectrum Report, Tables 7.7 to 7.12;
• Harmonic Current Spectrum Report, Tables 7.13 to 7.16;
• Harmonic Filter Design, Harmonic Filter Data, Table 7.17;
• Filter Spectrum Report, Table 7.18;
• Harmonic Current Spectrum Report, Table 7.19;
• Power system losses, Table 7.20.
Table 7.2 Comparative harmonic studies results: Total Bus Harmonic Distortion V(THD) %; FLTR-1 OFF versus FLTR-1 ON

7.3 Bus voltage waveforms and spectrum
With harmonic filter ON, the bus voltage waveforms and spectrum are listed in the Figure 7.3.
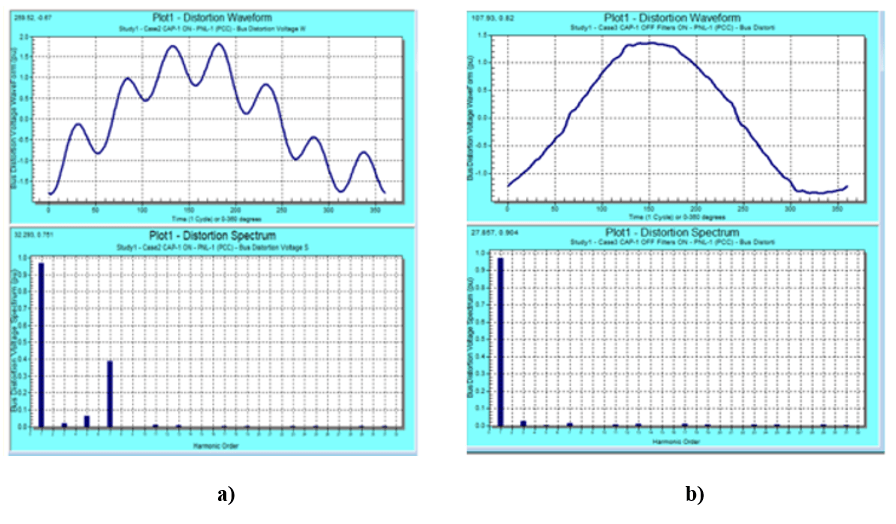
One can be seen a large reduction of the bus total harmonic distortion at the PNL-1 (PCC) from 6.7 % to 3.5 %. Also, one can see the improvements of the system performances above the PNL-1 (PCC) bus towards to utility bus.
Table 7.3 Voltage Distortion Summary, Case 3; CAP-1 OFF, FLTR-1 ON.
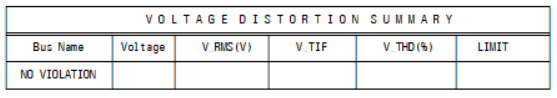
Table 7.4 Total Voltage Distortion Summary, Case 3; CAP-1 OFF, FLTR-1 ON.
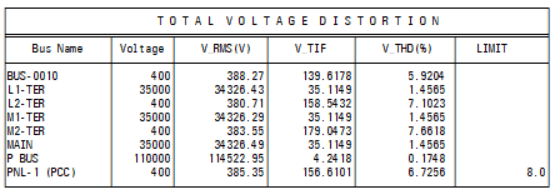
Table 7.5 Total Current Distortion Summary, Case 3; CAP-1 OFF, FLTR-1 ON.
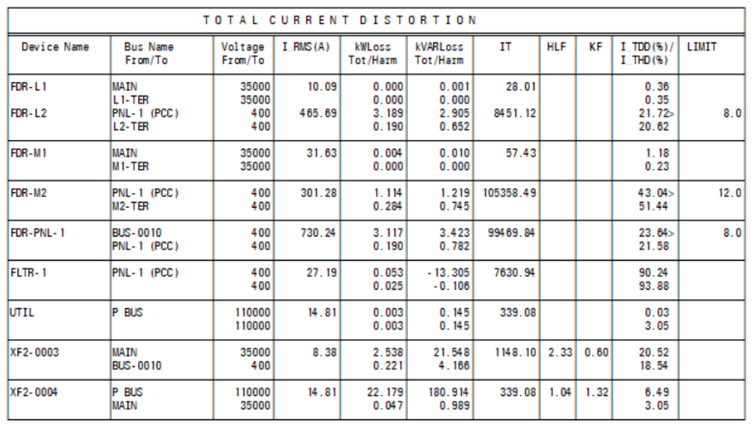
Table 7.6 Total Current Distortion Summary, Case 3; CAP-1 OFF, FLTR-1 ON

Table 7.7 Total Current Distortion Summary, Case 3; CAP-1 OFF, FLTR-1 ON.
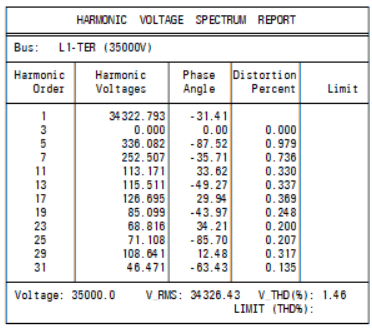
Table 7.8 Harmonic Voltage Spectrum Report, Case 3; CAP-1 OFF, FLTR-1 ON.

Table 7.9 Harmonic Voltage Spectrum Report, Case 3; CAP-1 OFF, FLTR-1 ON.
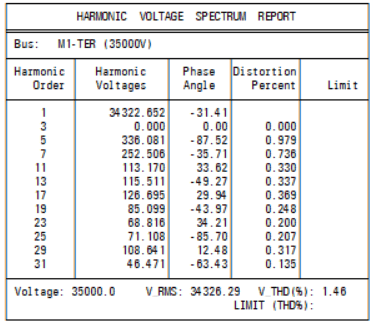
Table 7.10 Harmonic Voltage Spectrum Report, Case 3; CAP-1 OFF, FLTR-1 ON.
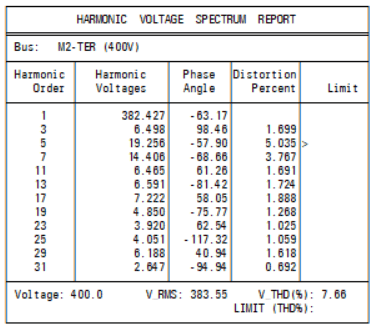
Table 7.11 Harmonic Voltage Spectrum Report, Case 3; CAP-1 OFF, FLTR-1 ON.
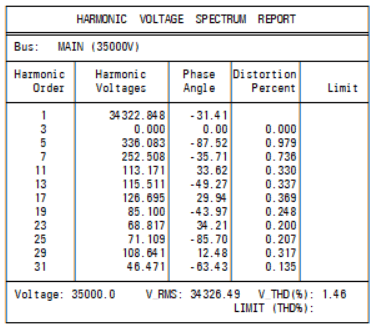
Table 7.12 PNL-1 (PCC) Harmonic Voltage Spectrum Report, Case 3; CAP-1 OFF, FLTR-1 ON

Table 7.13 Harmonic Current Spectrum Report, Case 3; CAP-1 OFF, FLTR-1 ON.
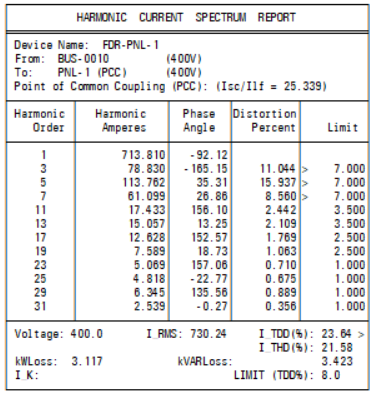
Table 7.14 Harmonic Current Spectrum Report, Case 3; CAP-1 OFF, FLTR-1 ON.
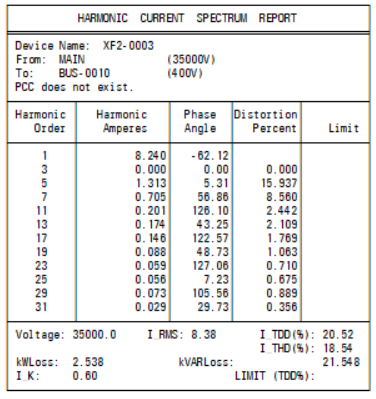
Table 7.15 Harmonic Current Spectrum Report, Case 3; CAP-1 OFF, FLTR-1 ON.

Table 7.16 Harmonic Current Spectrum Report, Case 3; CAP-1 OFF, FLTR-1 ON.

Table 7.17 Passive Filter Data, Harmonic Current Spectrum Report, Case 3; CAP-1 OFF, FLTR-1 ON.
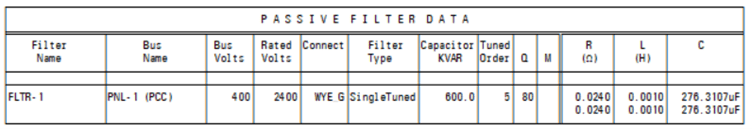
Table 7.18 Filter Spectrum Report, Case 3; CAP-1 OFF, FLTR-1 ON.
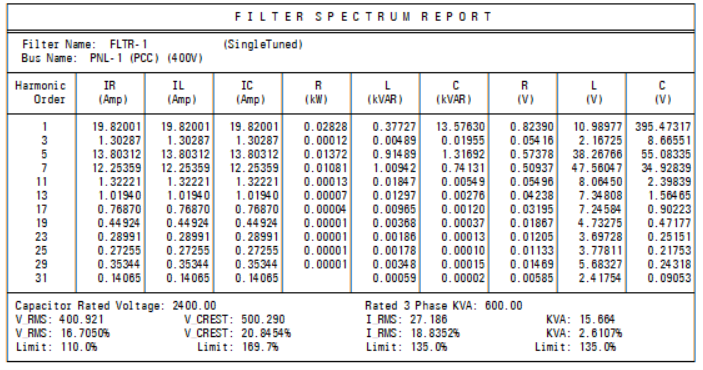
Table 7.19 Total System Power Losses, No Harmonics in the System, CAP-1 OFF

Table 7.20 Total System Power Losses, No Harmonics in the System, CAP-1 ON
Table 7.21 Total System Power Losses, with Harmonics, Scenario/Case 2: CAP-1 ON, FLTR-1 OFF
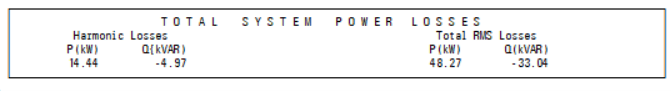
Table 7.22 Total System Power Losses, with Harmonics, Scenario/Case 3: CAP-1 OFF, FLTR-1 ON
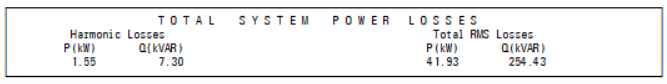
Note: Harmonics filters improves system power factor and reduce power losses, see Table 7.22
8. Conclusions
The paper provides an infield tested methodology and a guide in solving harmonics-based power quality computer assisted. The harmonic studies are performed by employing PTW/SKM professional software.
Harmonics generate problems if the power system is not designed to handle them. One notes that a large voltage distortion the PCC is acceptable as long as sensitive equipment is not affected. However, it is always important to consider the presence of harmonics and to try to minimize them by employing the appropriate low distortion electronic ballasts and reactors for PWM. Mitigating the harmonics will improve the power factor in the facility, and will also save energy by reducing power losses in power system components. Any time when there will be a considerable increase of non-linear loads, it is important to check the power system components loadings to prevent problems.
Based on the several projects completed by the author, the followings may be considered, [10, 11]:
• The harmonic limits are recommended for both voltages and currents.;
• Both the system owners or the operators and the users must work cooperatively to keep actual voltage distortion below the standard levels;
• The end-users should limit the harmonic current injections;
• One needs to highlights that the recommended limits of the THD apply only at the PCC bus and should not be applied to either individual equipment or at locations within a user’s facility, [3, 8];
• Harmonic mitigation does not generate energy savings. Harmonics do not affect the real power absorbed by the loads;
• K-factor is based on the THD-I present in the system;
• K-factor does not mitigate harmonics. It permits the power transformer to operate in the presence of harmonics as long as transformer is not overheated;
• Total Demand Distortion (TDD) compares the amplitude of the current with considered harmonics at any operating point to the demand (full) load fundamental current of the loads, [3];
• Total Demand Distortion (TDD) is based on the measured levels that define the harmonic current amplitudes and the maximum fundamental current of the loads;
• One needs highlighting that the metering devices do not measure the TDD;
• It’s important to note that the loads may cause some harmonics, while others harmonics may be from the power sources;
• The only way to measure what is coming from a utility is to shut off all nonlinear loads in the plant and measure the voltage total harmonic distortion (THD (V)); Harmonic currents caused by the variable frequency drives (VFDs) depend on the impedance of the electrical system and the impedance in the VFD and/or the impedance in front of the VFD;
• Typically, “Pulse Width Modulation”, or PWM with diode rectifiers does not have DC choke impedance and input line reactors, [6];
• The current practice recommends do not install line reactors in medium voltage system;
If the harmonic current distortion is high, resonance or capacitor destruction caused by harmonic heating are possible;
• If the study bus has greater than 50 % nonlinear loads, then active filters should be considered for both power factor correction and harmonic filtering purposes;
• Harmonics filters improves system power factor and reduce power losses.
Contributions: The paper presents the author’s in-field tested methodologies for harmonics investigation, practical flow chart for harmonics investigation, large conclusion based on the author’s experience on harmonics investigation computer based; the step-by-step harmonic filter design and the impact of harmonics to distribution power systems
9. References
1. IEEE Standard 141-1993, IEEE Recommended Practices for Electric Power Distribution for Industrial Plants, (IEEE Red Book).
2. EN IEC 61000-3-2, European Standard, 2019.
3. IEEE 519-2014. https://www.elspec-ltd.com/understanding-the-ieee-519-2014-standard-for-harmonics/.
4. Cheng, J. IEEE Standard 519-2014. Compliances, Updates, Solutions and Case Studies. Schneider Electric.
5. Reducing of Harmonic Distortion. ASIAN Electricity, September 2003.
6. EPRI Electric Power Research Institute. Proceedings: Second International Conference on Power Quality. End-Use Applications and Perspectives. PQA’92. Volume 1&2, Albany, California, 1992.
7. George J. Wakileh Power Systems Harmonics. Fundamentals, Analysis and Filter Design. Springer, 2001, 506 pp.
8. Jos Arrillaga, Neville R. Watson Power Systems harmonics. Second Edition, John Willey & Sons, Ltd, 2003, 399 pp.
9. Silviu Darie, Harmonics Investigation; Part 1 Overview, Harmonics Indices, IEEE & IEC Standards. Rev. Energetica Nr. 10/2020, Volume 68, ISSN: 1553-2360.
10. Silviu Darie, Harmonics Investigation; Part 2 Computer Aided Harmonics Studies, Rev. Energetica Nr. 11/2020, Volume 68, ISSN: 1453-2360.
11. Darie, S., Computer Aided Harmonics Investigation (in English), Blue Print House Cluj, 2019, 170 pp.
12. Mekhamer, S.F., Abdelaziz, A.X., Ismael, S.M. Harmonic Analysis Studies Applied to Industrial Electrical Power Systems. ETASR-Engineering Technology & Applied Science Research. Vol. 3, No. 4, 2013.
13. *** Power Tools for Windows (PTW). HI_WAVE Reference Manual. Electrical Engineering Analysis Software for Windows. Copyright, 2009, SKM Systems Analysis, Inc., USA.

Author: Prof. Silviu Darie, PhD (EE), Technical University Cluj Napoca, Honorary Member of Romanian Technical Sciences Academy, Former VP Power Analytics Corporation, USA.
Prof. Dr. Daries has more than 20 years’ work experience with Power Analytics products, and nearly 40 years of university-level electrical engineering instruction and industry consultancy in power system analysis computer applications, electrical power quality, transmission pricing, embedded generation, computer aided power system analysis and design. In addition to earning both his doctorate and master’s degrees in electrical engineering, he has authored or co-authored hundreds of technical books, student manuals, technical papers, and research projects.
Dr. Darie is a former professor of power systems and electrical engineering in Technical University of Cluj Napoca, Romania, and University of Cape Town, South Africa, as well as a former visiting professor in École polytechnique fédérale de Lausanne, Switzerland. He has received several awards and recognitions throughout his years of expertise including the Award Professor for Life of Faculty of Engineering, University of Cape Town 1993, Romanian National Research Award. Since 2005 he is the Vice President of Consulting and Engineering for Power Analytics Corporation.
Dr. Darie led nearly 180 electrical power projects worldwide; he constructed 18 prototypes designed for mass production, holds three patents, and is experienced in most leading software programs for electrical engineering. He has provided services to clients worldwide, and is a registered professional engineer in Romania, South Africa, and New Zealand.
Contact address:
Prof. Silviu Darie, Ph.D., P.E.,
Romania: Bd. 21 Decembrie 1989, No. 104 Bl. L1, Sc. 1, Ap. 8 Cluj Napoca, 400124 Romania
Mobile: +40728312222
Email: silviu.darie@gmail.com, Silviu.darie@enm.utcluj.ro
