Published by Richard P. Bingham
Abstract. Understanding what is important to know about harmonics can be challenging for those without extensive electrical engineering backgrounds. In this two part series, this second article will help to clarify why you need to be concerned about them, how and where to find them, and when they are a problem.
Why Worry About Harmonics
The presence of harmonics does not mean that the factory or office cannot run properly. Like other power quality phenomena, it depends on the “stiffness” of the power distribution system and the susceptibility of the equipment when operating in the presence of the harmonics. One factory may be the source of high harmonics but be able to operate properly. This harmonic pollution is often carried back onto the electric utility distribution system, and may effect neighboring facilities on the same system which are more susceptible.
There are a number of different types of equipment that may experience misoperations or failures due to high harmonic voltage and/or current levels:
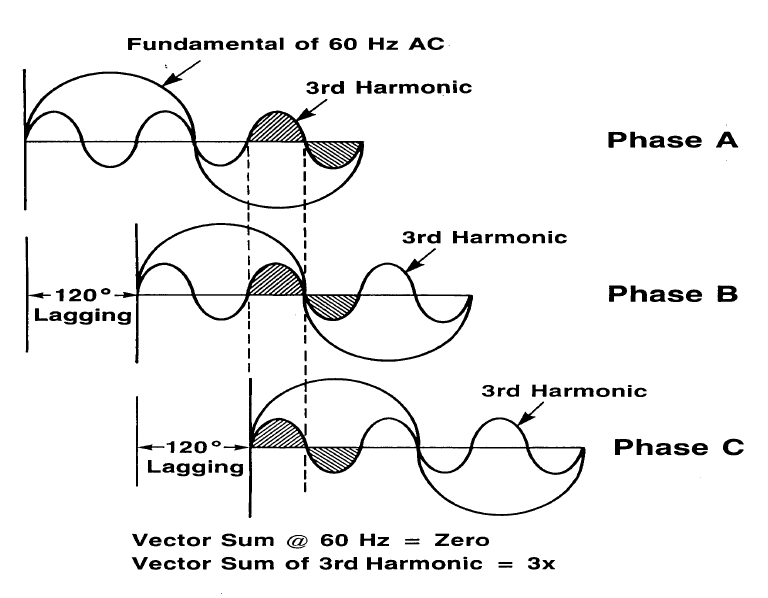
• Excessive neutral current, resulting in overheated neutrals. The currents of triplen harmonics, especially the odd harmonics, (3rd, 9th, 15th,…) are actually additive in the neutral of three phase wye circuits. This is because the harmonic number multiplied by the 120 degree phase shift between the three phases is a integer multiple of 360 degrees, or one complete cycle. This puts the harmonics from each of the three phase conductors “in-phase” with each other in the neutral, as shown in Figure 1.
• Incorrect reading meters, including induction disc-type W-hr meters and averaging type current meters.
• Reduced true PF, where PF= Watts/VA.
• Overheated transformers, especially delta windings where triplen harmonics generated on the load side of a delta-wye transformer will circulate in the primary side. Some type of losses go up as the square of harmonic value (such as skin effect and eddy current losses). This is also true for solenoid coils and lighting ballasts.
• Positive, negative, and zero sequence voltages on motors and generators. These are voltages at a particular frequency that try to rotate the motor forward, backward, or neither (just heats up the motor), respectively. As shown in Table 1, the voltage of a particular frequency in a balanced system harmonics can have either a positive (fundamental, 4th, 7th,…), negative (2nd, 5th, 8th…) or zero (3rd, 6th, 9th,…) sequencing value.
Table 1. Harmonic Sequencing Values in Balanced Systems.

• Nuisance operation of protective devices, including false tripping of relays and failure of a UPS to transfer properly, especially if the controls incorporate zero-crossing sensing circuits.
• Bearing failure from shaft currents through uninsulated bearings of electric motors.
• Blown-fuses on PF correction caps, due to high voltage and currents from resonance with line impedance.
• Mis-operation or failure of electronic equipment – Light flicker results when there are voltage subharmonics in the range of 1-30Hz. The human eye is most sensitive at 8.8Hz, where just a 0.5% variation in the RMS voltage is noticeable with some types of lighting.[2]
Where They Come From
The amount of voltage harmonics will often depend on the amount of harmonic currents being drawn by the load, and the source impedance, which includes all of the wiring and transformers back to the source of the electricity. Ohm’s Law says that Voltage equals Current multiplied by Impedance. This is true for harmonic values as well. If the source harmonic impedance is very low (often referred to as a “stiff” system) then the harmonic currents will result in lower harmonic voltages than if the source impedance were high (such as found with some types of isolation transformers). The impedance of an inductive device goes up as the frequency goes up, while the impedance goes down for capacitive devices for higher harmonics.
How this electricity is used by the different types of loads can have an effect on the “purity” of the voltage waveform. Some loads cause the voltage and current waveforms to lose this pure sine wave appearance and become distorted. Depending on the type of load and system impedances, the waveform may consist of predominately harmonics.
“The main sources of harmonic current are at present the phase angle controlled rectifiers and inverters.” [3] These are often called static power converters. These devices take AC power and convert it to DC, then sometimes back to AC power at the same or different frequency based on the firing scheme. The firing scheme refers to the controlling mechanism that determines how and when current is conducted. One major variation is the phase angle at which conduction begins and ends.
Power converters come in different sizes. Low power, AC voltage regulators for light dimmers and small induction motors adjust the phase angle or point on the wave where conduction occurs. Medium power converters are used for motor control in manufacturing and railroad applications, and include such equipment as ASDs (adjustable speed drives) and VFDs (variable frequency drives). Metal reduction operations, like electric arc furnaces, and high voltage DC transmission employ large power converters, in the 2-20MVA rating.
Where to look for them
Wherever the aforementioned equipment is used, one can suspect that harmonics are present. Like any power quality investigation, the search can begin at the equipment effected by the problem or at the point-of-common-coupling (PCC), where the utility service meets the building distribution system. If only one piece of equipment is effected (or suspected as being the producer), it is often easier to start the monitoring process there. If the source is suspected to be from the utility service side (such is the case when there is a neighboring factory that is known to generate high harmonics), then monitoring usually begins at the PCC.
How do you find them
Hand-held harmonic meters can be useful tools for making spot checks for known harmonic problems. However, harmonic values will often change during the day, as different loads are turned on and off within the facility or in other facilities on the same electric utility distribution system. This requires the use of a harmonic monitor or power quality monitor with harmonic capabilities (such as shown in Figure 2), which can record the harmonic values over a period of time.

The phase voltages and currents, as well as the neutral-to-ground voltage and neutral current should be monitored, where possible. This will aid in pinpointing problems, or detecting marginal systems. Monitoring the neutral will often show a high 3rd harmonic value, indicating the presence of non-linear loads in the facility.
Typically, monitoring will last for one business cycle. A business cycle is how long it takes for the normal operation of the plant to repeat itself. For example, if a plant runs three identical shifts, seven days a week, then a business cycle would be eight hours. More typically, a business cycle is one week, as different operations take place on a Monday, when the plant equipment is restarted after being off over the weekend, then on a Wednesday, or a Saturday, when only a skeleton crew may be working.
In order to be able to analyze complex signals that have many different frequencies present, a number of mathematical methods were developed. One of the more popular is called the Fourier Transform. Duplicating the mathematical steps required in a microprocessor or computer-based instrument is quite difficult. So more compatible processes, called the FFT for Fast Fourier Transform, or DFT for Discrete Fourier Transform, are used. These methods only work properly if the signal is composed of only the fundamental and harmonic frequencies in a certain frequency range (called the Nyquist frequency, which is one-half of the sampling frequency). The frequency values must not change during the measurement period. Failure of these rules to be maintained can result in mis-information.
For example, if a voltage waveform is comprised of 60Hz and 200Hz signals, the FFT cannot directly see the 200Hz. It only knows 60, 120, 180, 240,…, which are often called “bins”. The result would be that the energy of the 200Hz signal would appear partially in the 180Hz bin, and partially in the 240Hz bin. An FFT-based processer could show a voltage value of 115V at 60Hz, 18V at the 3rd harmonic, and 12V at the 4th harmonic, when it really should have been 30V at 200Hz. A spectrum analyzer can also exhibit a similar problem, as it places the energy in its own machine-dependent bins. In addition, a spectrum analyzer takes only a snap-shot in time of the harmonics, which are best analyzed on an averaged, steady-state waveform.
When are they a problem
To determine what is normal or acceptable levels, a number of standards have been developed by various organizations. ANSI/IEEE C57.110 Recommended Practice for Establishing Transformer Compatibility When Supplying Non-sinusoidal Load Currents [5] is a useful document for determining how much a transformer should be derated from its nameplate rating when operating in the presence of harmonics. There are two parameters typically used, called K-factor and TDF (transformer derating factor). Some power quality harmonic monitors will automatically calculate these values.
IEEE 519-1992 Recommended Practices and Requirements for Harmonic Control in Electrical Power Systems [6] provides guidelines from determining what are acceptable limits. The harmonic limits for current depend on the ratio of Short Circuit Current (SCC) at PCC (or how stiff it is) to average Load Current of maximum demand over 1 year, as illustrated in Table 2. Note how the limit decreases at the higher harmonic values, and increases with larger ratios.
Table 2. Current Harmonic Limits as per IEEE 519-1992.

For voltage harmonics, the voltage level of the system is used to determine the limits, as shown in Table 3. At the higher voltages, more customers will be effected, hence, the lower limits.
Table 3. Voltage Harmonic Limits as per IEEE 519-1992.

The European Community has also developed susceptibility and emission limits for harmonics. Formerly known as the 555-2 standard for appliances of less than 16 A, a more encompassing set of standards under IEC 1000-4-7 are now in effect.
Most electrical loads (except half-wave rectifiers) produce symmetrical current waveforms, which means that the positive half of the waveform looks like a mirror image of the negative half. This results in only odd harmonic values being present. Even harmonics will disrupt this half-wave symmetry. The presence of these even harmonics should cause the investigator to suspect there is a half-wave rectifier on the circuit. This also result from a full wave rectifier when one side of the rectifier has blown or damaged components. Early detection of this condition in a UPS system can prevent a complete failure when the load is switched onto back-up power.
References
[1] Power Line Harmonic Problems – Causes and Cures, Dranetz Technologies, December 1994.
[2] NFPA 70B Recommended Practice for Electrical Equipment Maintenance – Chapter
24, National Fire Protection Association, Quincy MA, 1994.
[3]J. Arrillega et.al. Power System Harmonics, John Wiley and Sons, 1985.
[4]Heydt, GT, Electric Power Quality, Stars in the Circle Publication, Indianapolis, 1991, pg 240.
[5] ANSI/IEEE C57.110 Recommended Practice for Establishing Transformer Compatibility When Supplying Nonsinusoidal Load Currents
[6] IEEE 519-1992 Recommended Practices and Requirements for Harmonic Control in Electrical Power Systems National Electrical Code – NEC-1996, National Fire Protection Association
About the Author: Richard P. Bingham is currently the Chief Technologist for Dranetz Technologies, Inc., having previously been the Vice-President of Engineering and Strategic Planning. He has been with the company since 1977, following completion of his BSEE at the University of Dayton. Richard also has an MSEE in Computer Architecture and Programming from Rutgers University. He is a member of IEEE Power Engineering Society and Tau Beta Pi, the Engineering Honor Society. Richard is currently working with the NFPA 70B committee on Power Quality and several IEEE committees related to IEEE 1159, and has written and presented numerous papers and seminars in the electric utility and power quality instrumentation fields.
Blog post: HARMONICS: Understanding the Facts – Part 1
