Published by Jacek DĄBROWSKI, Ewa KRAC, Krzysztof GÓRECKI
Katedra Elektroniki Morskiej, Akademia Morska w Gdyni
Abstract. In the paper the results of long-time investigations of the photovoltaic installation situated in Gdynia Maritime University are presented. A short description of the considered installation and the weather station making possible continuous monitoring of weather parameters are included. The selected results of measurements of exploitive parameters of the considered installation obtained in the selected days and the corresponding to them results of measurements of power density of solar radiation are shown.
Streszczenie. W pracy przedstawiono wyniki długookresowych badań instalacji fotowoltaicznej zlokalizowanej w Akademii Morskiej w Gdyni. Zaprezentowano krótki opis rozważanej instalacji fotowoltaicznej i stacji pogodowej umożliwiającej ciągłe monitorowanie stanu pogody w miejscu zamontowania instalacji fotowoltaicznej. Pokazano wybrane wyniki pomiarów parametrów eksploatacyjnych rozważanej instalacji uzyskane w wybranych dniach oraz odpowiadające im wyniki pomiarów gęstości mocy promieniowania słonecznego. (Analiza długookresowej wydajności instalacji fotowoltaicznej).
Słowa kluczowe: Systemy fotowoltaiczne, parametry pogodowe, pomiary.
Keywords: Photovoltaic systems, weather parameters, measurements.
Introduction
Photovoltaic installations are used more and more often in households, in objects of public utility and in great solar power stations [1, 2, 3]. A drawback of these installations is variability of their efficiency at different seasons of the year and at different times of the day [1]. The efficiency of such installations strongly depends on weather conditions, characterized, among other things by power density of solar radiation and temperature [3, 4, 5].
A basic component of the considered photovoltaic system are photovoltaic panels. The value of electrical power produced in such panels depends also on the direction of the wind and its speeds, because these parameters influence efficiency of convection of heat generated in the panel as a result of solar infrared radiation and self-heating phenomena [5, 6].
On the other hand, the considered weather parameters are subject to seasonal and days fluctuations and they strongly depend on localisation of the considered photovoltaic installation.
From the literature [7,8,9] it is known that energy produced by photovoltaic panels, being basic components of the considered installation, is proportional to power density of solar radiation, and it also strongly depends on temperature.
In the paper the set-up to investigate the influence of weather parameters on exploitive parameters of the photovoltaic installation situated in Gdynia Maritime University and the selected results of measurements of this installation are shown.
The Weather Station
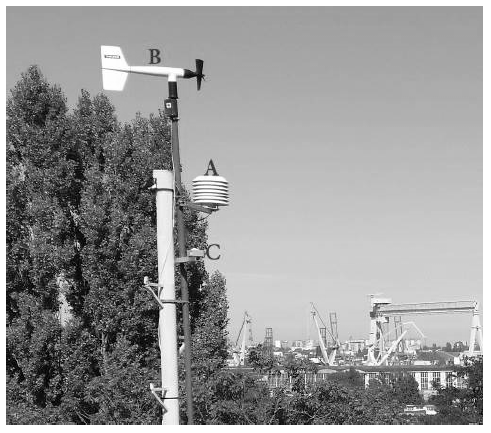
To register weather parameters the weather station designed by the Authors and installed on the roof of the building of Gdynia Maritime University was used. This station, shown in Fig.1, consists of 3 sensors measuring the ambient temperature, moisture, directions and speeds of the wind and power density of radiation, it also has the module LB-480 used to stockpile the measuring results. This data can be watched and analysed online from any place on the Earth thanks to the interface Ethernet with which the module LB-480 is equipped.
The module LB-480 assures the data access and settings with the use of the protocol http. The default home page contains the table with the running results of measurements. The page is refreshed automatically every second and contains the current results of measurements [10].
In the paper [11] the influence of weather conditions on the operation of the selected photovoltaic panels is analysed. The weather station making possible measurements of values of the selected weather parameters on the ground of Gdynia Maritime University is described. The measured waveforms of power density of solar radiation and air temperature in the selected days are presented. The electrothermal transient analysis of the polycrystalline photovoltaic panel operating with the linear resistance load was conducted. The obtained results of calculations were presented and discussed. The problem of the influence of weather parameters on cooling conditions of the photovoltaic panels was pointed out.
Photovoltaic installation
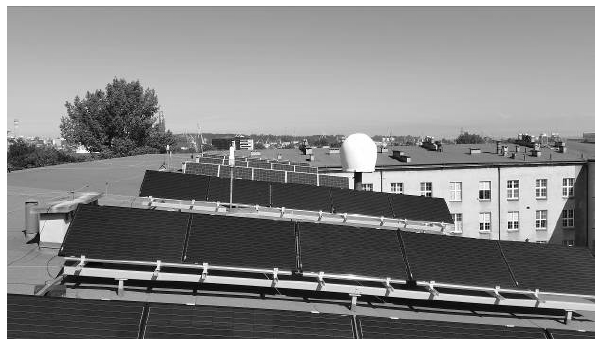
The photovoltaic system installed in Gdynia Maritime University is characterized by the installed top-power of silicon photovoltaic panels equal to 10.4 kWp. This system, shown in Fig. 2, is made according to the topology of the system SMA FLEXIBLE STORAGE SYSTEM based on the devices by SMA company including two network inverters of the type Sunny Boy 5000TL-21 operating in the two-phase-configuration and the insular inverter of the type Sunny Island 6.0H. In the considered system forty panels are used, each of the top-power equal to 260 kWp, including 20 monocrystalline panels – Axitec AC-260M/156-60S and 20 poly-crystalline panels – Axitec AC-260P/156-60S. The mounting construction of the panels makes possible manual regulation of the depression angle of these panels, which can be 20°, 35°, 50° or 60°.
The photovoltaic system provides electrical energy to the local energy-network installed in the laboratory of optoelectronics, photovoltaics and optical fibre technique.
The insular inverter makes possible the transformation of electrical energy of the direct current, aggregated in the battery of four gel batteries connected serially, characterised by the nominal voltage amounting to 12 V and the capacity of 220 Ah, into energy of the alternating current. The production of additional energy across the network inverter follows in the case of the too weak sun exposure (eg. large cloudiness, nighttime) and in the case of damage of the university energy-network. The communication between each device is realised across the local Internet network. Parameters of the system are sent to the Internet service Sunny Portal across the device of the name Sunny Home Manager. This service allows remote management with settings of the photovoltaic system and its monitoring.
Investigations results
With the use of the weather station presented in Section 2, weather parameters in the place of location of the photovoltaic installation described in Section 3 were measured and recorded. The measurements of weather parameters and exploitive parameters of the considered installation have been performed since October 2015.
As an example, in Fig. 3 the measured courses of changes of power density of solar radiation during twenty-four hours are shown, and in Fig. 4 – the corresponding to them courses of power produced by the considered installation. For the presentation the Authors selected the arbitrarily data from the following days – 27th October 2015, 27th November, 24th December 2015, 29th January 2016, 27th February 2016, 2nd April 2016, 26th April 2016, 25th May 2016, 30th June 2016, 29th July 2016 and 25th August 2016.
As it is visible, the considered waveforms obtained for all the considered days have similar courses, and over the considered period of time the maximum power density of solar radiation in winter and in summer changes even four times. As a result of changing times of the sunrise and the sunset, as well as changes of the height of the sun over the horizon at noon, there are visible changes of the maximum value of pV and time, in which the values of pV are much more than zero.
In the considered curves obtained in the selected days many local minima and maxima are observed. These local extrema are a result of changes in cloudiness during the considered days. These changes cause fast changes in the value of power density of solar radiation. For example in the curve measured on 29th July 2016 it is visible that during 10 minutes only the value of pV decreases from 1100 W/m2 to 300 W/m2. On the other hand, for a sunny day the curve pV(time) has the shape near the Gaussian curve.

As it is visible in Fig. 4, the output power of the photovoltaic system visibly changes every day and during the year. It is worth noticing that the maximum output power of the photovoltaic system changes from about 5 kW in December to about 9 kW in June.
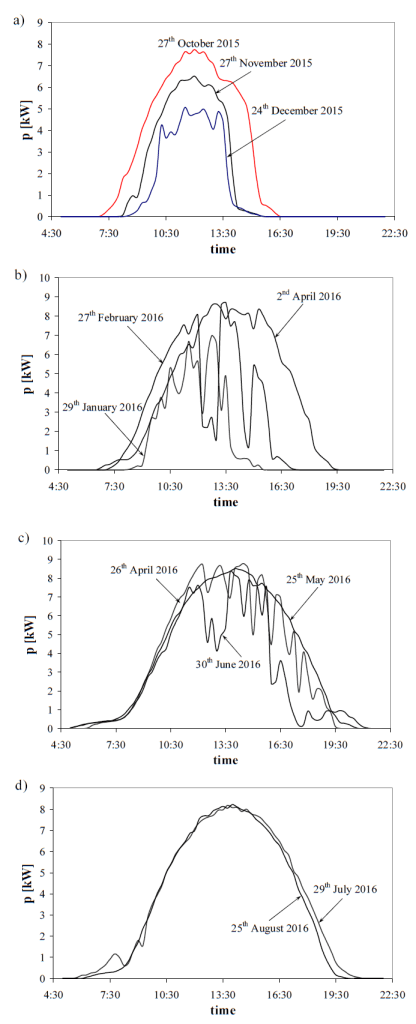
In the observed curves it is visible that the energy produced by the considered system depends on power density of solar radiation pV. Particularly, changes in values of pV (observed in Fig. 3) cause changes in the values of the output power of the considered system. The maximum value of the output power equal to the nominal value of this parameter was obtained in the period between April and October.
The information about time at which the power generation starts and stops in the considered days is presented in Fig.5.
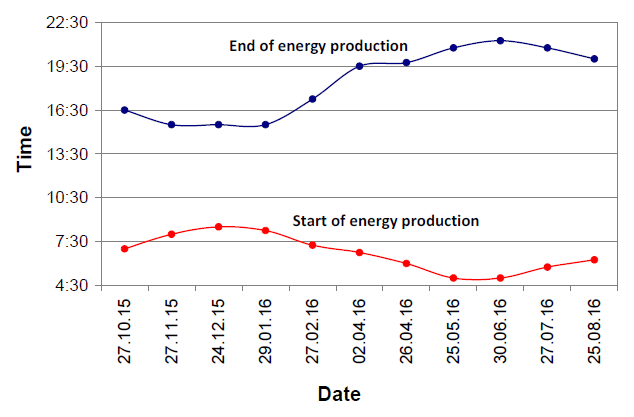
It is visible that this time is very short between November and January and its value is about only 7 hours, whereas in summer this time is equal to about 16 hours.
From the point of view of the user of a photovoltaic system information about electrical energy produced by this system is very important. The value of this energy depends on solar energy. In Fig.6 the values of solar energy density in the selected days are shown, whereas in Fig. 7 – the values of electrical energy produced by the considered system in the same days are presented.
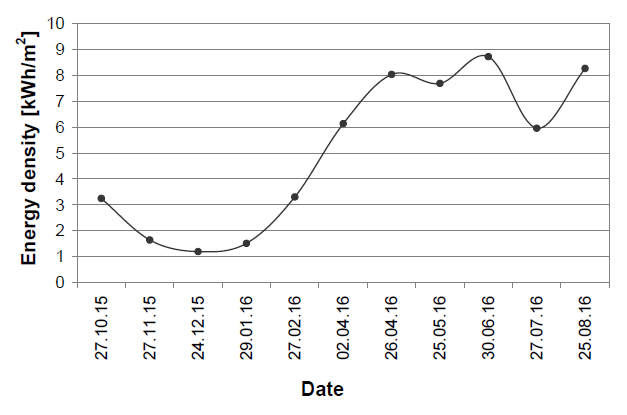

As it is visible, shapes of the curves shown in Fig. 4 and 5 are similar. The minimum value of the produced energy is observed in December and it is equal to 25% only of the value of this energy produced in May. The observed changes in the value of the produced electrical energy is twice smaller than changes in the value of density of solar energy. The value of electrical energy produced each day in the period from the beginning of April to the end of August is nearly the same and it is equal to about 60 kWh.
Conclusions
In the paper the investigations results of the photovoltaic installation and the weather station situated in Gdynia Maritime University are presented. The long-time investigations confirmed that the output power of the considered installation was not proportional to power density of solar radiation. It is also visible that changes of power density of solar radiation due, among other things to variable cloudiness get averaged. The energy produced by the considered installation changes even four times during the period from the end of December to the beginning of April and the time, in which energy is produced during this period, increases twice. During 5 months the value of the produced each day electrical energy is equal to its maximum.
REFERENCES
[1] D. Mulvaney, Solar’s Green Dilemma, IEEE Spectrum, No. 9, 2014, pp. 26-29
[2] J. Singh, “Semiconductor devices: basic principles”, John Wiley&Sons, 2000
[3] E. Klugmann-Radziemska, „Fotowoltaika w teorii i praktyce”, Wydawnictwo BTC, Legionowo, 2010.
[4] L. Castaner, S. Silvestre, „Modelling photovoltaic systems using Pspice”, John Wiley&Sons, 2002.
[5] M.H. Rashid, “Power Electronic Handbook”, Academic Press, Elsevier, 2007.
[6] E. Krac, K. Górecki: Modelling characteristics of photovoltaic panels with thermal phenomena taken into account. IOP Conference Series: Materials Science and Engineering, Vol. 104, 2016, 39th International Microelectronics and Packaging IMAPS Poland 2015 Conference, 012013, pp. 1-7, doi:10.1088/1757-899X/104/1/012013.
[7] W. Marańda, M. Piotrowicz: “Extraction of Thermal Model Parameters for Field-Installed Photovoltaic Module”, PROC. 27th International Conference on Microelectronics (MIEL 2010), NIŠ, Serbia, 16-19 MAY, 2010.
[8] K. Górecki, J. Zarębski: Modeling the influence of selected factors on thermal resistance of semiconductor devices. IEEE Transactions on Components, Packaging and Manufacturing Technology, Vol. 4, No. 3, 2014, pp. 421-428
[9] F.F. Oettinger, D.L. Blackburn: Semiconductor measurement technology: thermal resistance measurements U. S. Department Commerce NIST/SP-400/86, 1990
[10] T Markvart, L Castañer Practical handbook of photovoltaics : fundamentals and applications; Oxford: Elsevier Advanced Technology, 2003
[11] http: //mk.label.pl/lb480-user-manual/pl/lb480-usermanual.pl.pdf
[12] E. Krac, K. Górecki: The influence of selected weather parameters on characteristics of photovoltaic panels. Elektronika, No. 5, 2016, pp. 40-43
Autorzy: dr inż. Jacek Dąbrowski, mgr inż. Ewa Krac, prof. dr hab. inż. Krzysztof Górecki, Akademia Morska w Gdyni, Katedra Elektroniki Morskiej, ul. Morska 81-87, 81-225 Gdynia, E-mails: j.dabrowski@we.am.gdynia.pl, e.krac@we.am.gdynia.pl, k.gorecki@we.am.gdynia.pl
Source & Publisher Item Identifier: PRZEGLĄD ELEKTROTECHNICZNY, ISSN 0033-2097, R. 93 NR 2/2017. doi:10.15199/48.2017.02.44
