Published by Suren DRAN. R1, Parvatha VARTHINI. B2,
Research Scholar, Department of Information Technology, Sathyabama University, Chennai, Tamilnadu, India (1), Professor & Head, Department of Computer Applications, St. Joseph’s College of Engineering, Chennai, Tamilnadu, India (2)
Abstract. Load balancing is an important feature that keeps the power system safe from overloading. Load details can be obtained from Circuit Breaker’s Relay Meter and it is connected to computer. Power balancing and failure detection will be done using Fuzzy Rule, which is helpful for the operator to recover the power fault quickly. Because of this power sharing between the substations, in turn between feeders, the load balancing of the power system is maintained. This is applied in the real time system using tree topology to get the result more quickly than the existing Petri Net Model.
Streszczenie. Przedstawiono możliwości wykorzystania logiki rozmytej do analizy obciążę i nierównowagi mocy systemu energetycznego. Analizowany jest rozdział mocy między podstacjami oraz sposoby równoważenia rozdziału mocy żeby zapobiec przeciążeniom. (Wykrywanie nieprawidłowości w systemie energetycznym bazujące na logice rozmytej)
Keywords: Power Grid, Load Balancing, Power Failure Detection, Fuzzy Rule.
Słowa kluczowe: sieć energetyczna, nierównowaga obciążeń, logika rozmyta
Introduction
An electric power system is a network of electrical components used to supply, transmit and use electric power. Since the power grid failure diagnosis method in practical application has problems such as adaptability of the diagnosis algorithm, acquisition of fault information, and fault tolerance of model, Petri Net (PN) model was used to pick out fault components. It is a powerful inference mechanism, but simulates all of the system states and all transition judgments by the token passing in a quite straightforward manner, the graphical representation for a moderate system shows very complex configuration. So it’s more time-consuming and fault detection cannot be done quickly. Weather conditions can change the consumer usage and extreme weather conditions can cause overloading. Previously Petri net model was used to detect the fault in the Power System and the false tripping or operating information was picked out. When one area is overloaded, the loads can be transferred to the less loaded areas using switches. Grid balancing provides how much load has to be transferred to maintain system within limits. This helps in preventing the damage of electrical devices. It is implemented at the substation side at the power distribution level. In this paper, the design and implementation of Grid balancing and power failure detection is done using Fuzzy Rules Algorithm and calculated using Java Swing program in order to quickly detect the fault in the power grid system as it is a platform independent GUI framework for Java, which follows a single-threaded programming model. This is applied in the real time power system using tree topology and got the result more quickly than the existing Petri Net Model.
Aims
To detect the Power Systems Failure in the Real Power Grid using Fuzzy Logic (FL) Algorithm and calculated using Java Swing Program which runs in Netbeans IDE, version 6.9? To share the load between substations so that if a substation shuts down, those on either side continue to feed electricity to that substation using Fuzzy logic technique.
Scope
The increasing requirements of power in day-to-day life in all fields make it necessary to maintain power delivery service with minimum interruption. The goal of power system fault analysis is to provide as quickly as possible an action to restore the power delivery by load balancing.
Literature Survey
An electric power system is a network of electrical components used to supply, transmit and use electric power. Paper [1] proposes a hierarchical fault diagnosis model of a large scale power system adopting multi-agent system technology and based on dispatch integrated information platform. Paper [2] reports another diagnosis method by information fusion of multi-data resources. With the form of graphic representations, PN simulates the states and operations of a system transition. Load balancing is the process of improving the performance of a parallel and distributed system through distribution of load among the processors [3, 4]. Load balancing provides substations to meet extra load demands. Load balancing of power is done by open/close tie-switches in the distribution feeders (F). Overloading of network is maintained by transferring load from heavily loaded feeders to the less loaded feeders. It allows smoothing the load demands by distribution, reduced feeder losses and increased network reliability [5]. In centralized load balancing schemes, all these information need to be stored at one location where load balancing decisions are made [21]. Up to now, many AI methods applied to fault diagnosis try to figure the full association map, such as MAS [6], artificial neuronal network [7], expert system (ES) [8,9] and so on. PN is a powerful inference mechanism and has been successfully applied in the areas of service restoration scheduling for distribution systems [10–12], fault section estimation, rule-based evaluation, and power system protection, but simulates all of the system states and all transition judgments by the token passing in a quite straightforward manner, the graphical representation for a moderate system shows very complex configuration. The two most important concepts within FL are that of linguistic variable and the fuzzy if-then rule [13]. Using the priority scheduling for MNP (mobile node packets) forwarded from old FA to new FA will reduce its waiting time in the old FA (foreign agent) [19]. Fuzzy logic is a superset of conventional (Boolean) logic that has been extended to handle the concept of partial truth, i.e. truth values between “completely true” and “completely false” [14]. Swing is a platform-independent, Model-View-Controller GUI framework for Java, which follows a single-threaded programming model [15, 16]. Enhance dynamic composition of business process for modeling the Web services discovery and selection process using PetriNet [22]. NetBeans IDE supports development of all Java application types (Java SE) [17]. It helps developers find memory leaks and optimize speed [18]. With the form of graphic representations, PN simulates the states and operations of a system transition. Petri Net simulates all of the system states and all transition judgments by token passing in a quite straightforward manner, the graphical representation for a moderate system shows very complex configuration.
Proposed System
Colored Petri Net (CPN) concept along with fuzzy logic is used in Real System for detecting the Power fault and maintaining the load balancing in the power substation. In CPN, a place node owns several colors to represent different states and based on the colors the judgment functions in a transition node check the states of the incoming place nodes. The characteristics dramatically simplify the graphical representation of the traditional Petri Net and also improve the execution efficiency.
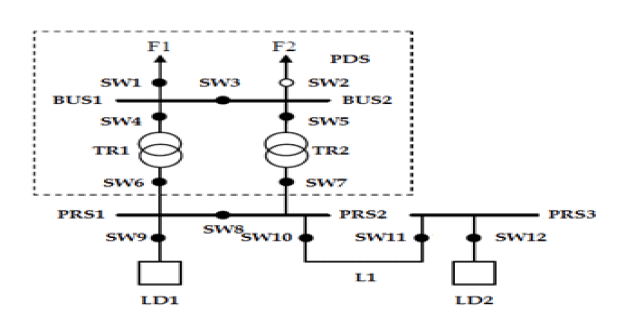
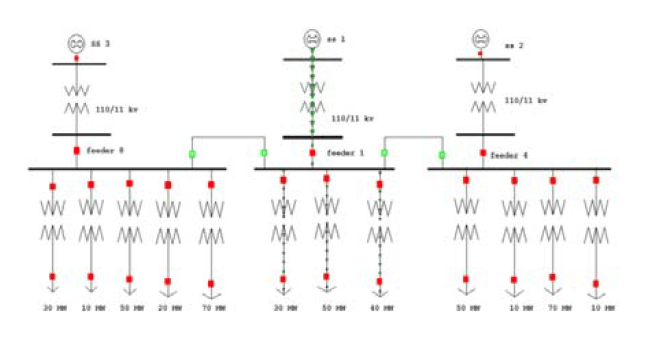
System Architecture of Power Grid
The system architecture of power grid is shown in Fig 1. It contains one PDS (Power Delivering Station) and two PRS (Power Receiving Station). In Fig. 2, F1 and F2 denote Feeders F1 and F2, SW denotes switches, LD denotes load delivering station and TR denotes transformer. If fault occurs in F2 due to overload the SW2 will be opened by manual operation. After this SW3 will be closed (normally open condition) to deliver the power to the affected area of F2. If fault occurs in F1 the vice versa will happen. Because of this resource sharing is taking place which makes the balancing of the power system’s load.
Modules
This paper is done with the following four modules:
1. Power grid system
2. Power fault
3. Power fault analysis and
4. Load balancing process
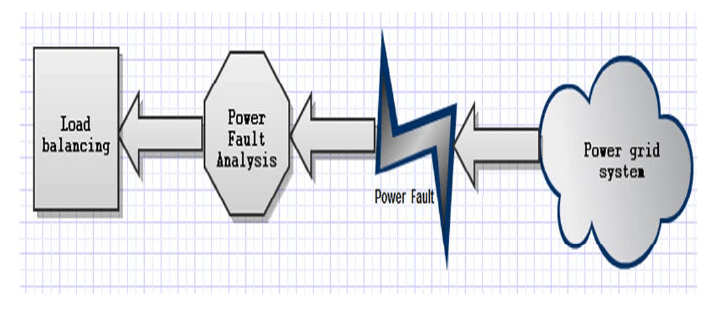
The diagrammatic representation of modules is given in Fig.2.
Power grid system
It includes a number of substations interconnected together and each substation is having power transformers, breakers and isolator switches through which power sharing is done.
For each PDS, there is a corresponding T node. For each element in the PDS such as feeder, bus bar, switch, and transformer, there is a corresponding P node. The relationship among the elements, the bi-directed arcs are created between P nodes and T nodes.
Power fault
Power fault may occur due to human operational mistakes, overload of the current, machine fault, etc.
Power fault analysis
Each electrical equipment and line has a limited amount of current. If the amount is exceeded power fault will occur which will be analyzed using Petri net model, genetic algorithm, fuzzy logic, etc. In this project fuzzy logic is used for analyzing the power fault.
Load balancing
Load balancing is a very important feature that keeps the system safe from overloading. The flowchart for load balancing is given in Fig. 3 and the load balancing process is explained in Fig. 4.


Fuzzy Rule
In Fig 5, Fuzzy Rule is used for fault detection and load balancing to achieve resource sharing between substations.
Fuzzy logic is a superset of conventional (Boolean) logic that has been extended to handle the concept of partial truth, i.e. truth values between “completely true” and “completely false”. Fuzzy logic offers an alternative technique to the design of such a control system making decisions based on human expertise, thus avoiding complex calculations [26]. Fuzzy Petri Nets (FPN) technology is used for accurate fault diagnosis in power system when some incomplete and uncertain alarm information of protective relays. It is shown from several cases that the faulted system elements can be diagnosed correctly by use of these models. By the suggested method, it is possible to decline diagnosis time according to traditional methods. Finally, the suggested method can easily be adapted to different power system networks. It is practicable an impressive for fault diagnosis in power system [27]. Combining the Generalized Stochastic Petri nets (GSPN) properties and high level Petri nets facilities, a structural simplified model Logical Explicit Stochastic Petri Nets (LESPN), having the same modeling power as GSPN, is built. LESPN primitive architectural modules are used in repairable power systems dependability modeling [28].
Fuzzification
Firstly, a crisp set of input data are gathered and converted to a fuzzy set using fuzzy linguistic variables, fuzzy linguistic terms and membership functions. This step is known as fuzzification. Fuzzy Set: Two valued set (0, 1)
Inference
An inference is made based on a set of rules, i.e. IF …. THEN rule
Defuzzification
The resulting fuzzy output is mapped to a crisp output using the membership functions.
Algorithm 1
| Step 1: Define the linguistic variables and terms(initialization) Step 2: Construct the membership functions (initialization) Step 3: Construct the rule base (initialization) Step 4: Convert crisp input data to fuzzy values using the membership functions (fuzzification) Step 5: Evaluate the rules in the rule base (inference) Step 6: Combine the results of each rule (inference) Step 7: Convert the output data to non-fuzzy values (defuzzification) |
Linguistic variables
∞ Quantification variables (All, Many, None)
∞ Usability variables (Sometimes, Frequently, Always)
∞ Likelihood variables (Possible, Likely, Certain)
Membership function
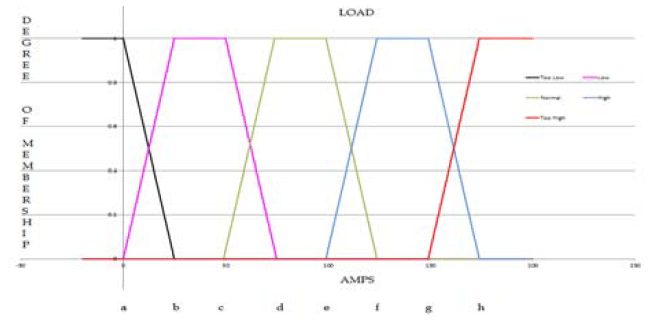
a = 0, b = 25, c = 50, d = 75, e = 100, f = 125, g = 150, h = 175
(1) μNormal(Load) = {1 , d ≤ x ≤ e}
(2) μHigh(Load) = {1 , f ≤ x ≤ g}
(3) μtooHigh(Load) = {(h – Load)/(h – g)} g ≤ x ≤ h
(4) load = x
Algorithm 2
1. Read the all sub station’s load values connected with X substation via remote metering method.
2. Compare the load values to find which is the smallest
3. Connect the X substation to Substation that is having smallest load values.
Fuzzy Rule
Fuzzy Logic or Rule is a logical system, which is an extension of multi-valued logic that is intended to serve as logic for approximate reasoning.
The two most important concepts within Fuzzy Logic (FL) are Linguistic variable and fuzzy if-then rule. In this paper I have used the fuzzy if-then rule.
1. IF (load is more than too-high) THEN command is fault.
2. IF (load is too-high) THEN command is Reduce the Load.
3. IF (load is Normal) THEN command is no-change.
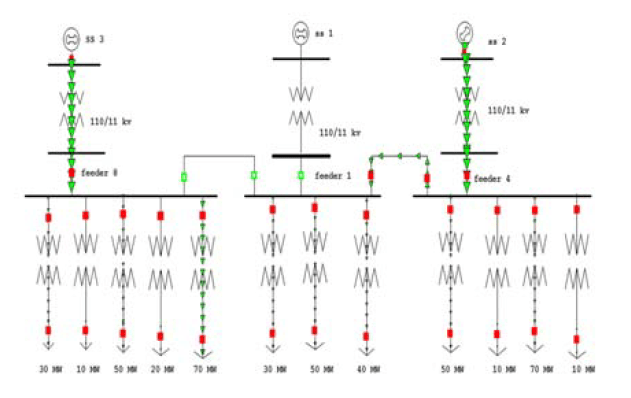
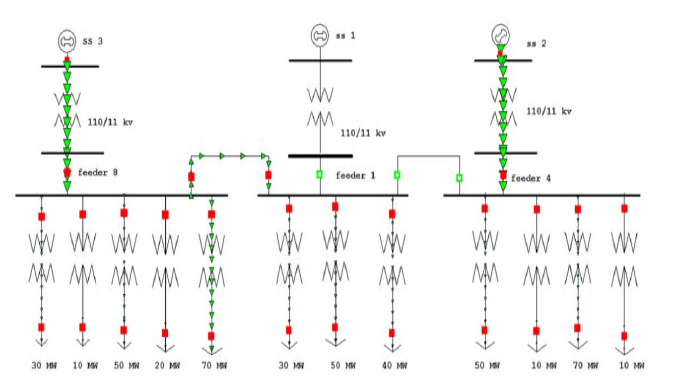
Figure 8 represents the model diagram of power delivering. Additional requirements on modulation scheme for AC Converters include true grid synchronous operation with Phase-control of the switching frequency harmonics, in order to interlace all converters onboard, and topology specific requirements related to the parallel/series configurations of the line-side converters for traction drives and auxiliary power supply converters) [20].
Tree Topology
Tree topology integrates the characteristics of Star and Bus Topology. In this topology, the numbers of Star networks are connected using Bus. This main cable seems like a main stem of a tree, and other star networks as the branches. Workflow composition systems are designed for enabling users to assemble components into workflows based on Petri Net model [23]. When a fault happens, the component connecting topology trees were used for creating the Petri Nets model of possible fault components [24]. The digital information is transformed to fuzzy fault degree through fuzzy Petri nets and the analogue information is transformed to wavelet fault characteristics through the wavelet analysis [25].
Advantages of Tree Topology
1. Expansion of network is possible and easy.
2. Here, we divide the whole network into segments (star networks), which can be easily managed and maintained.
3. Error detection and correction is easy.
4. Each segment is provided with dedicated point-to-point wiring to the central hub.
5. If one segment is damaged, other segments are not affected
Advantages of Proposed Work
1. No need for manual reading and fault calculation.
2. Even ON/OFF indication and fault trip alarm failure occurs due to battery and aging problem; fault can be identified, and the load can be balanced through this project calculation method.
3. Fault identification and fault recovery is very quick.
4. Using this project Resource sharing and load balancing can be done easily.
5. The algorithm can be applied in the Real Power system, whereas in previous Petri Net model and colored pertinent model this is not possible. It is used only as graphical representation model/Simulation model.
6. This fully automated power failure Detection Grid service can be accessed from anywhere at any time through grid portal.
Experiments
This is the first page for running the Java swing program for which Net Beans IDE version 6.9 is used.
This is the load-setting page for breakers and transformers. In Fig. 10, Values are assigned as given in the Screen shot. In this box A, B and C denote Feeder Breakers. A1–A5, B1–B3 and C1–C4 denote the corresponding transformers. For all the feeder breakers the maximum power of 200 Ams is assigned. After setting the load in the box the below substation diagram (Fig. 11) is obtained. The values are reflected in the diagram.
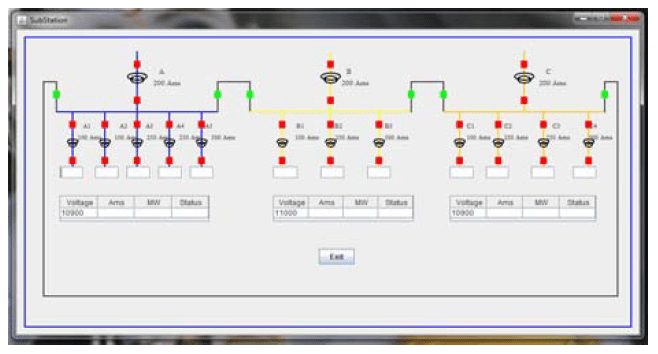
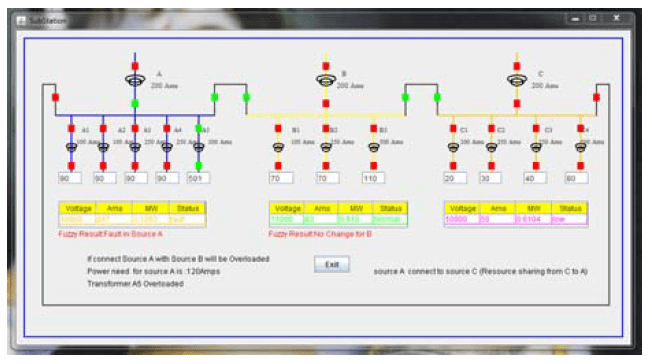
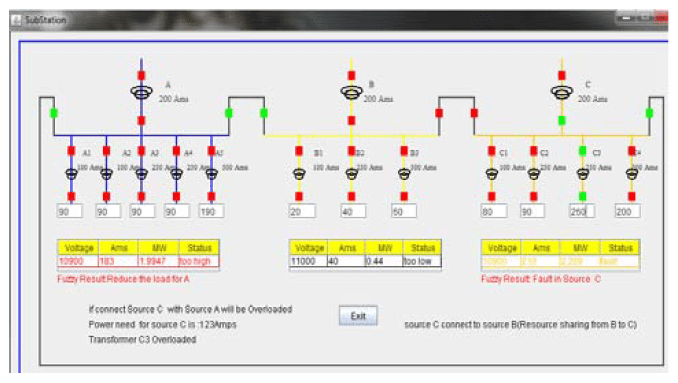
Fault is created in Source A and power is supplied to the affected area of Source A by resource sharing from Source B. Source C will be overloaded if affected area of Source A is connected to Source C.

In this screen shot, we can see the comment if Source A is connected to Source C it will be overloaded because the power need for Source A is 137Ams and Source C already has 86 Ams so if Source A is connected to Source C then total Ams will be 223Ams, which is overload. Because of this Source A should be connect to Source B.
Table explanation
| ¤ Voltage: incoming voltage of Sources A, B, C ¤ Ams: summation of total transformer current/3 ¤ MW: Voltage X Ams ¤ Status: displays the Ams value converted into fuzzy logic command. |
Voltage in column one of table indicates the incoming voltage of Substation A, i.e., source A, Ams indicates how much load is utilized by the connected area of Source A. The Ams is calculated by adding all transformers current values divided by 3 which means if the current in the breaker relay shows 1 Ams the line will carry 3 Ams. But in the actual substation if the line carries 300 Ams the current in the breaker relay shows 1 Ams. The Ams present in the table will be compared each and every time with the Feeder Breaker Relay Ams wherein Fuzzy calculation is implemented to estimate the line current to reduce the fault, Load and share the load to the affected area. It helps the Operator for quick Operation and avoids the Power interruption and Power Losses. MW is calculated by multiplying the voltage and Ams it informs the operator how much amount of MegaWatt is delivered /received to/from the affected area. Status column indicates the present status of the load from which the operator can easily take the decision. Fault is created in Source A and power is supplied to the affected area of Source A by resource sharing from Source C. Source B will be overloaded if affected area of Source A is connected to Source B.
In above screenshot (Fig. 13), we can see the comment if Source A is connected to Source B it will be overloaded because the power need for Source A is 120 Ams and Source B already has 83 Ams so if Source A is connected to Source B the total Ams will be 203 Ams, which is overload. Because of this Source A should be connected to Source C. Membership function is calculated in the status bar of the following substation diagram (Fig. 14).
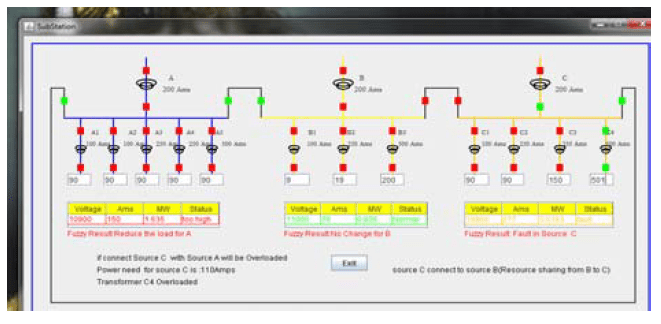
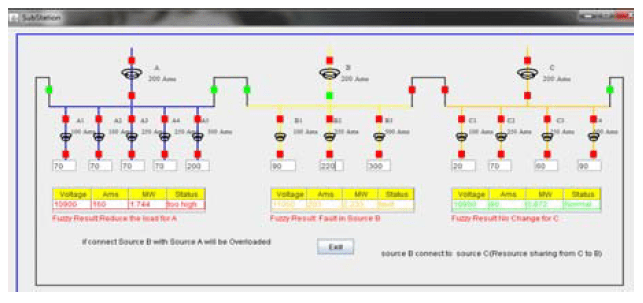
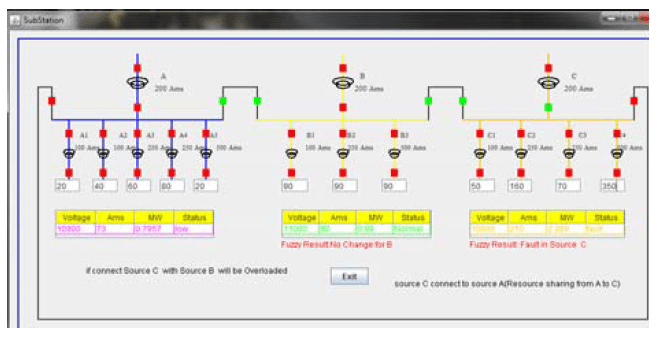
Fig. 15, Fault is created in Source B and power is supplied to the affected area of Source B by resource sharing from Source A. Source C will be overloaded if affected area of Source B is connected to Source C.
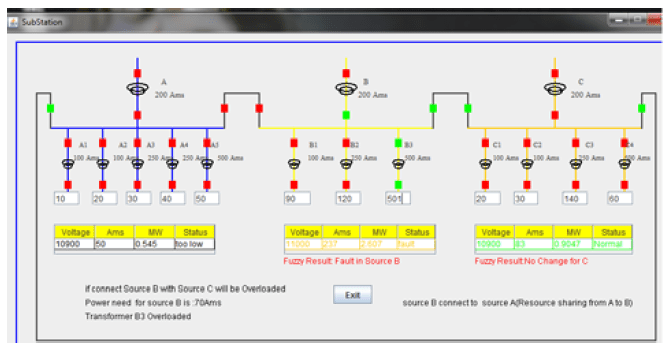
The Fault created in Source B is shown below and the power is supplied to the affected area of Source B by resource sharing from Source C. In Fig. 16, Source A will be overloaded if affected area of Source B is connected to Source A.
Fig. 17, shows the Fault created in Source C and power is supplied to the affected area of Source C by resource sharing from Source B. Source A will be overloaded if affected area of Source C is connected to Source A.
The screen shot shows that the Fault is created in Source C and power is supplied to the affected area of Source C by resource sharing from Source A. Source B will be overloaded if affected area of Source C is connected to Source B.
As shown above (Fig. 18), in all the screen shots we can observe which transformer is overloaded and in which feeder the fault has occurred.
Table 1. Sample test results
| Sub Station | A | B | C | Fuzzy Remarks |
| Amps | Too Low | Over Load | Normal | Substation B Connected with substation A |
| Amps | Low | Low | Over Load | Substation C Connected with substation A |
| Amps | Over Load | Low | Too Low | Substation A Connected with substation C |
| Amps | Over Load | Normal | High | Substation A Connected with substation B |
| Amps | Normal | High | Over Load | Substation C Connected with substation A |
| Amps | High | Over Load | Normal | Substation B Connected with substation C |
Since by using FL method we can detect the location of fault exactly it saves the time of the operator and the fault can be quickly rectified and the power can be supplied to the affected area immediately from the area where there is excess of power available by means of resource sharing.
MW = √3 Voltage Amps*Cosθ
Mega Watt = MW
Cos indicates Power factor
Power factor should Maintain 0.9 to 1.0
a = too Low Load = 25 amps to 50 Amps
b = Low Load = 50 to 75 Amps
c = Normal Load = 75 to 100 Amps
d = High Load = 100 to 150 Amps
e = too high load = 150 to 200 Amps
Above 200 Amps fault
Substation A total Load =( a1 + a2 + a3 + a4 )/3
Substation B total Load =( b1 + b2 + b3 )/3
Substation C total Load =( c1 + c2 + c3 + c4 + c5)/3
If total load < 50 = too low
If total load < 75 = low
If total load < 100 = Normal
If total load < 150 = High
If total load < 200 = too High
If total load < 200 = Over load
Total Load should not increase above 200 Amps then system will get fault.
Summary and Conclusions
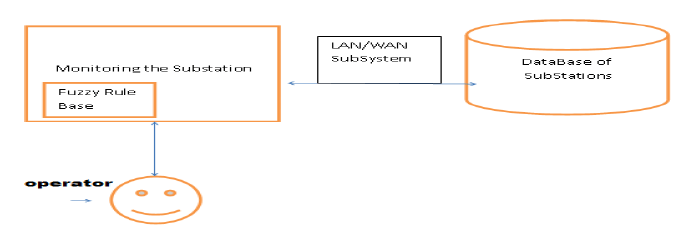
As fuzzy logic is simple and quick in detecting the power fault in the power system it is used in this project. In this project the location of fault is detected quickly and exactly so it saves the time of the operator and the fault can be rectified quickly and the power can be supplied to the affected area immediately from the area where there is excess of power available by means of resource sharing. Normally each and every power grid substation is connected with Load Control Centre. Load Control Centre will be monitoring those of Substations every second. If fault occurs in one Substation that will be obtained by Load control Centre through SCADA (Supervisory control and Data Acquisition) and informed to healthy substations which are connected with the faulty Substation, then only power will be shared to faulty substation. In which Data Traffic is a major drawback because at the same time many substations may fail when communication delay will be happened so that resource recovery and load balancing will be delayed, people will be affected without power, cost loss. This Project will overcome the present status of power sharing and fault diagnosis power system method through the following steps. Each and every Grid substation connected with more than two substations, if fault occurs in one among the substations, share the load from low load substation to affected substation through LAN connected with Substation computer. So there is no need for Load Control Centre.
Acknowledgments: The authors would like to thank the reviewers and Mr. K. RAJU, Electrical Engineer for their detailed reviews and constructive comments, which have helped improve the quality of this paper.
REFERENCES
[1] Zhu Chuanbai, Guo Chuangxin, Cao Yijia, Hierarchical fault diagnosis model of a large-scale power system based on dispatch integrated information platform, Automation of Electric Power Systems, pp. 51–55,2009
[2] Guo Chuangxin, Peng Mingwei, Liu Yi, Novel approach for fault diagnosis of the power grid with Information fusion of multi-data resources, Proceedings of the CSEE, pp.1–7, 2009
[3] S. Sharma, S. Singh, and M. Sharma, Performance Analysis of Load Balancing Algorithms, World Academy of Science, Engineering and Technology, Vol. 38, 2008
[4] G. R. Andrews, D. P. Dobkin, and P. J. Downey, Distributed allocation with pools of servers, ACM, pp. 73–83, 1982
[5] M. A. Kashem, V. Ganapathy, G. B. Jasmon, A geometric approach for three-phase load balancing in distribution networks, pp. 293 – 298, Vol.1, IEEE, 2000
[6] LI Lan-fang, LIU Kai-pei, HU Yu-hang, Architecture of Multi-Agent Based Distributed Monitoring and Control System for Substations, Power System Technology;2004-22
[7] BI Tianshu, NI Yixin, WU Fuli, YANG Qixun, A Novel Neural Network Approach for Fault Section Estimation, CSEE, 2002
[8] Fang Peipei, Li Yongli, Yang Xiaojun, Transmission Power System Fault Diagnosis Based on Petri Nets and Expert System, Proceedings of the CSU-EPSA, pp. 26-30, 2005
[9] Sun Jing, Qin Shiyin, Song Yonghua, Fuzzy Petri Nets and its Application in the Fault Diagnosis of Electric Power Systems, Proceedings of the CSEE, pp. 74-79, 2004
[10] Y.M. Park, K.H. Lee, Application of Expert System to Power System Restoration in Local Control Center, International Journal of Electrical Power and Energy System, 1995
[11] Jaw-Shyang Wu, Chen-ching Liu, Ken-Lee Liou, A Petri Net Algorithm for Scheduling of generic restoration actions, IEEE Trans. on Power Systems, pp.69–76, 1997
[12] Jaw-Shyang Wu, A Petri-Net Algorithm for Multiple Contingencies of Distribution System Operation, IEEE Trans. On Power Systems, pp.1164–1171, 1998
[13] Andries P. Engelbrecht, Computational Intelligence, Wiley Publications, 2nd edition, Chapter 21, pp. 465-474, 2007
[14] http://en.wikipedia.org/wiki/Fuzzy_logic
[15] Sun and Netscape to jointly develop Java Foundation Class, Netscape Communications Corporation. 2011-08-08
[16] Swing threading and the event-dispatch thread – JavaWorld, Welcome to JavaWorld.com 2008-05-17
[17] http://en.wikipedia.org/wiki/NetBeans
[18] ^ “Profiler”, Netbeans.org. Retrieved 2008-05-17
[19] Fayza A. Nada, Improving Mobile IP Performance Through Priority Scheduling, AUTOMATIKA, pp.365–3692011
[20] Nenad Težak, Ivan Bahun, Ivan Petrovi´c, Active Suppression of Low-frequency Interference Currents by Implementation of the High-performance Control System for the Grid-interfaced Converters, AUTOMATIKA, pp.199–214, 2012
[21] Qin Zheng,Chen-Khong Tham,Bharadwaj Veeravalli, Dynamic Load Balancing and Pricing in Grid Computing with Communication Delay, J. of Grid Computing, pp.239–253, 2008
[22] Liang-Jie Zhang and Bing Li, Requirements Driven Dynamic Services Composition For Web Services and Grid Solutions, Journal of Grid Computing, pp.121–140, 2004
[23] Jia Yu and Rajkumar Buyya, A Taxonomy of Workflow Management Systems for Grid Computing, Journal of Grid Computing, pp.171–200, 2006
[24] GAO Zhanjun, GAO Nuo, WANG Lei, LI Zhaofei, Power System Fault Diagnosis Based On Power Grid, IET, 2012
[25] WANG Lei, CHEN Qing, GAO Zhanjun, Power Systems Fault Diagnosis Based On Grid Computing, IEEE, 2011
[26] José L. AZCUE-PUMA1, Alfeu J. SGUAREZI FILHO, Ernesto RUPPERT, Fuzzy logic based vector control for three-phase induction motor, PRZEGLAD ELEKTROTECHNICZNY JOURNAL, 2013
[27] Nihat PAMUK , Yılmaz UYAROGLU, The Fault Diagnosis for Power System Using Fuzzy Petri Nets, PRZEGLĄD ELEKTROTECHNICZNY JOURNAL, 2012-7a
[28] Mariana DUMITRESCU, Using Stochastic Petri Nets for power system computation Dependability, PRZEGLĄD ELEKTROTECHNICZNY, Electrical Review 200
Authors: Surendran. R, Research Scholar, Department of Information Technology, Sathyabama University, Chennai, Tamilnadu, India, B. Parvatha varthini, Professor & Head, Department of Computer Applications, St. Joseph’s College of Engineering, Chennai, Tamilnadu, India , E-mail : surendran.mtech.it@gmail.com parvathavarthini@gmail.com
Source & Publisher Item Identifier: PRZEGLĄD ELEKTROTECHNICZNY, ISSN 0033-2097, R. 89 NR 8/2013
