Published by Electrotek Concepts, Inc.
Background
PQView® is a database software application developed and commercialized by Electrotek Concepts, Inc. (“Electrotek”), which is designed to store and analyze large quantities of power quality-related disturbance and steady-state measurement data. PQView enables users to organize data from a variety of instruments, such as power quality monitors, microprocessor relays, and digital fault recorders. It also stores site characteristics (e.g., substation, bus, feeder, latitude, longitude, etc.) and event information for voltage sags, transients, and faults (e.g., root cause code or text description). PQView brings all this information together in one relational database and provides the means to automate both the loading of new data and the generation of monitoring reports. PQView comes with a base set of reports that provide information on raw measurements, detailed statistical analysis, and executive summaries.
PQView Software System Overview
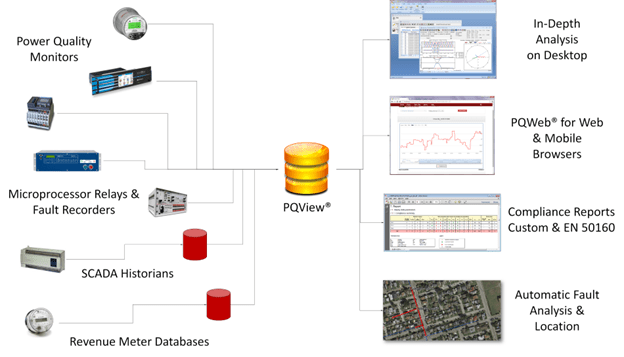
PQView builds databases with billions of measurements from thousands of monitoring points taken by many different types of meters, including power quality monitors, voltage recorders, in-plant monitors, and digital fault recorders. It can store and analyze information associated with the measurements, including cause and source of triggered events, as well as evaluate the financial impact of events to both a power provider and a power user. It can quickly extract meaningful information from a one megabyte or one terabyte database.
PQView automatically builds power quality databases from data sources. It also automatically sends email notifications using SMTP servers when data sources have finished importing, RMS voltage variations are imported from data sources, or measurements are not collected from a monitoring instrument for a specified period. PQView automatically correlates measurements by time stamp and location. It also deletes old measurements, manually adds missed RMS voltage, performs EN 50160 compliance calculations, automatic derivations, and automatic fault location. In addition, it can update measurement databases manually, automatically once per day, or as fast as once every minute.
The following list summarizes the basic functions provided by PQView:
• Stores measurements in PQView databases in Microsoft Access file format
• Stores measurements in PQView databases hosted by Microsoft SQL Server
• Imports measurements from data stores automatically via schedules
• Sends email alerts automatically
• Provides interactive charts in user interface
• Allows user to customize chart captions from defaults to alternate text in any language
• Displays meter locations and measurement values on maps using shapefiles
• Provides analysis of data logs
• Provides analysis of power quality event measurements
• Provides phasor analysis of steady-state snapshot measurements
• Provides harmonic analysis of steady-state snapshot measurements
• Provides custom analysis reports
• Displays monitor availability reports
• Provides system event analysis tools and reports
• Provides load growth estimation tools
• Provides optional fault analysis and location tools
• Allows user to rescale voltage, current, power, or energy measurements to correct transducer problems
• Allows user to adjust timestamps to correct clock problems
• Derives indices for steady-state analysis
• Derives SARFI indices
• Correlates power quality and relay events with SCADA operations events
• Derives indices for transient overvoltages
• Creates profile charts for any value log
• Creates summary statistical tables from value logs
• Optionally filters data in trends, histograms, and profile charts by min/max value, by hour, by day, and/or by month
• Combines measurements using temporal aggregation
• Offers zoom-in and zoom-out functionality in charts
• Creates trend charts that interactively link to event charts
• Creates trend charts that sum or average data log subsets
• Builds event lists of RMS voltage variation events, transient events, and frequency events
• Filters event lists by event type
• Filters event lists by voltage magnitude
• Displays event charts showing waveform samples
• Displays event charts showing frequency samples for frequency variation events
• Displays event charts showing RMS samples for RMS voltage variation events
• Derives RMS values from waveform samples if not recorded by meter
• Derives line-line voltage from line-neutral voltage if not provided by meter
• Derives residual voltage and current from line-neutral voltage if not provided by meter
• Derives net voltage and current from line-neutral voltage if not provided by meter
• Derives positive-sequence, negative-sequence, and zero-sequence components from voltage and current waveform samples
• Displays voltage and current phasor charts with voltage, current, impedance, and power phasor tables
• Displays harmonic spectrum charts derived from voltage and current waveform samples
• Displays derived real, reactive, and apparent power derived from waveform samples or RMS values
• Displays derived resistance, reactance, and impedance
• Displays characteristic voltage derived from waveform samples
• Displays sag energy and swell energy derived from waveform samples
• Displays derived missing voltage, delta current, delta power, delta energy
• Displays frequency values derived from voltage waveform samples
• Exports to IEEE COMTRADE format
• Exports to IEEE PQDIF format
• Exports chart images to JPEG, bitmap, SVG, WMF, and EMF formats
• Exports chart data to CSV, XML, Microsoft Excel, and Waveform Audio File formats
• Exports to Microsoft Outlook
• Exports to TOP, The Output Processor
• Provides link from application to view latitude and longitude coordinates on online mapping software (defaults to Google Maps).Creates on demand Microsoft Word summary reports
PQView Components
This section describes the main software applications of a complete PQView® system. Not all PQView users employ all PQView software applications.
Each of these software applications supports all versions of Microsoft Windows and Microsoft Windows Server currently supported by Microsoft.
• Microsoft Windows Server 2016, 2012, 2012R2, 2008, 2008 R2
• Microsoft Windows 10, 8.1, 8, and 7
These instances of Windows can be installed on physical servers or virtual servers.
For database storage, PQView supports all versions of SQL Server currently supported by Microsoft. This includes Microsoft SQL Server 2008, 2008 R2, 2012, 2014, 2016, and 2017. SQL Server Express editions are compatible with PQView software applications.
PQDMS
The Power Quality Data Manager Service (PQDMS) is an application server program that runs as a Microsoft Windows Service that collects data from power quality monitors, microprocessor relays, and more. The PQDMS provides real-time data via HTTP interfaces, sends email notifications, logs system events, and exports data to files.
PQView Admin Service
The PQView Admin Service is an application server program that runs as a Microsoft Windows Service to manage PQView resources (that is, each PQView Measurement Database and each PQDMS instance) and manages access to those resources.
PQWeb
PQWeb® is a web server application for Microsoft Internet Information Service (IIS) used for viewing and analyzing waveform events and data logs from each PQView Measurement Database and each PQDMS. This web application is the main user interface for most users.
PQWeb Services
PQWeb Services is a RESTful web service application that manages data flow between PQWeb and each PQView Measurement Database, and between PQWeb and each PQDMS.
PQView Admin
PQView Admin is web server application for Microsoft Internet Information Service (IIS) used to manage users, resources, and permissions.
PQDM
The PQView Power Quality Data Manager (PQDM) is a desktop application or application server application for importing file-based data sources, for managing measurements in a PQView Measurement Database, and in performing advanced derivations or calculations after data source import.
PQDA
The Power Quality Data Analyzer (PQDA) is a desktop application used for advanced fault analysis and power quality analysis on desktop and laptop computers using data from a PQView Measurement Database.
PQView Agent
PQView Agent is an application server program that allows more than one instance of PQDM to run on a single computer, importing measurements into one or more PQView Measurement Databases.
PQView FireDaemon
PQView FireDaemon is an application server program that runs as a Microsoft Windows Service that allows PQView Agent and PQDM to run as a service.
PQView Measurement Database
PQView measurements are stored in a Microsoft SQL Server database or Microsoft Access database called the PQView Measurement Database. These measurements include data source configurations, monitoring site properties, power quality & fault events, waveform samples, rms samples, data logs, and text properties.
PQView Admin Database
PQView system configuration information is stored in a Microsoft SQL Server database called the PQView Admin Database. This database stores user information, resource connection information, permissions, user preferences, and more. PQView in general supports Active Directory user accounts. However, if PQView Admin is configured to not use Active Directory, the PQView Admin Database stores user accounts and passwords that have been properly salted and hashed.
ARS
The Automatic Reporting System (ARS) from Electrotek Concepts is a desktop application and Microsoft Windows Service for automated report generation, archiving, and emailing. Using a PQView Measurement Database as a data source, ARS can integrate data from various instrument types and databases. Report structures are flexible: users can configure templates according to their needs and requests. ARS provides the functionality to create detailed reports for single sites, or comparative reports containing data from multiple sites or even multiple databases.
Data Sources for PQDM
PQView can be used to integrate data from nearly fifty different systems. IEEE PQDIF and IEEE COMTRADE are the two most common formats employed by PQView users for importing measurements. It also supports numerous vendor-specific file or databases formats. PQView is frequently extended/improved by Electrotek to accommodate new systems.
PQDM can import IEEE Std 1159.3-2003 PQDIF files produced by many vendors including Dranetz Technologies, Electrotek Concepts®, EPRI®, Iskra Sistemi, Power Monitors (PMI®), PSL Power Standards Labs®, Schneider Electric®/Square D® POWERLOGIC® System Manager Databases, and SoftSwitching Technologies®.
PQDM can import IEEE C37.111-1991/1999 COMTRADE files produced by many vendors including ABB®, Ametek®, Beckwith Electric, E-MAX Instruments, General Electric®, Mehta Tech, Qualitrol®/LEM Instruments BEN, Schweitzer Engineering Laboratories®, Schneider Electric®/Square D® POWERLOGIC®.
Using PQDM, the COMTRADE data handler has an option to download COMTRADE files from an FTP server automatically, allowing PQView to download and import waveform measurements automatically from the following monitors: Eaton Power Xpert Meter 4000, Power Xpert Meter 6000, Power Xpert Meter 6000, Schneider Electric ION 7550, and Schneider Electric ION 7650 meters. The following proprietary systems can be integrated using PQDM as well:
• BTECH® Battery Validation Manager (BVM) database
• Dranetz® Signature System® InfoNode® and Encore® Series (ESS)
• Dranetz NodeLink® and NodeCenter® Data Files
• Dranetz PASS® Database and PNDS Archive Files
• Dranetz PES Database used by PQNode® 7100 and 7100-S and PQPager 3100
• Dranetz DDB File Format used by Power Xplorer® PX5, PowerGuide® 4400, PowerVisa®, and Energy Platform® EP1
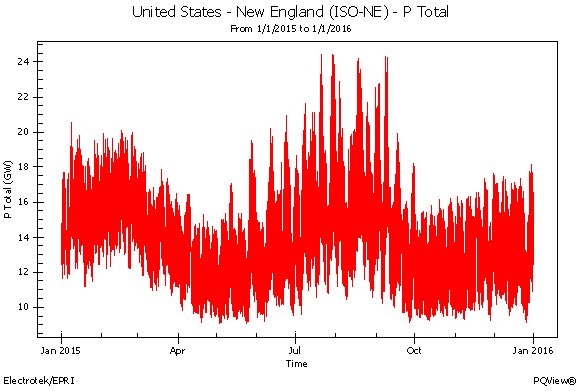
• Edison Electric Institute® Load File used by ISO-NE
• Electro Industries Communicator Log Files used by Nexus® 1272 Revenue Monitor
• Fluke®/Reliable Power Meters (RPM) Omega and Scenario Databases
• General Electric® Communicator Device Log Files
• GridSense PowerView CSV Files
• PQView Databases
• SATEC PAS Site Database
• SoftSwitching Technologies® I-Grid® Web Site
The following data sources can also be integrated with PQDM using optional add-in modules:
• Eaton CYMDIST network and equipment database files
• DNV GL Synergi Electric network and equipment database files
• OSIsoft® PI System® Servers
• Qualitrol®/LEM Instruments QIS Database
• Schneider Electric® PME Server, ION Enterprise®, StruxureWare®, and PEGASYS
• Unipower® PQ Secure Database
More data sources are available. See www.pqview.com for the latest list. Custom data handlers to bring data from proprietary systems into a PQView database are frequently developed to meet customer needs.
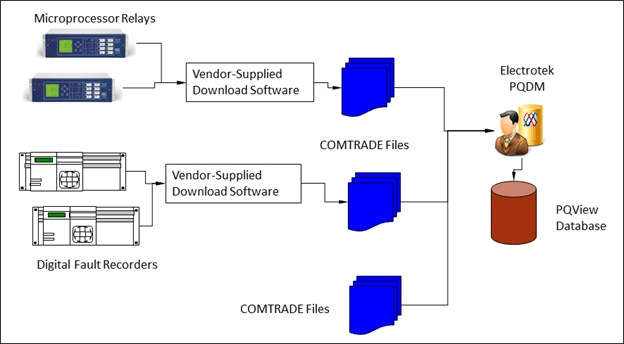
PQDM Import of IEEE COMTRADE Files
PQView’s PQ Data Manager (PQDM) can be configured to import COMTRADE files automatically that follow the IEEE C37.111-1991 format or IEEE C37.111-1999 COMTRADE file format. See Figure 3.
PQView is compatible with the COMTRADE files produced by many vendors, including ABB®, Ametek®, Beckwith Electric, E-MAX Instruments, General Electric®, Mehta Tech, Qualitrol®/LEM Instruments BEN, Schweitzer Engineering Laboratories®, and Schneider Electric®/Square D® POWERLOGIC®.
The COMTRADE data handler has an option to download COMTRADE files from an FTP server automatically, allowing PQView to download and import waveform measurements automatically from the following monitors: Power Xpert Meter 4000, Power Xpert Meter 6000, Power Xpert Meter 6000, Schneider Electric ION7550, and Schneider Electric ION 7650 meters.
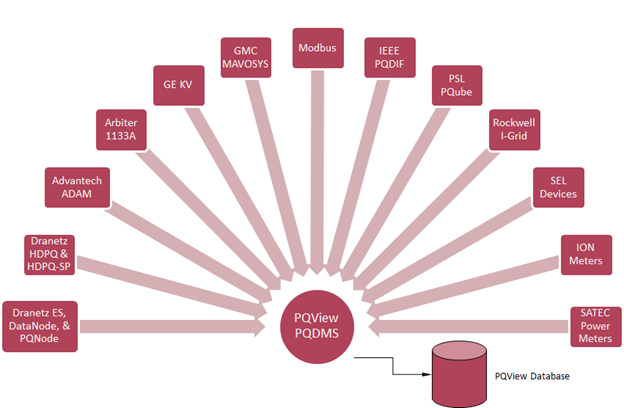
Data Sources for PQDMS
PQView can acquire measurements directly from select meters using the Power Quality Data Manager Service (PQDMS) software. The PQDMS runs as a background Windows Service to provide the following functions: setup monitors, download historical data from monitors, view real-time measurements, send email notifications, load measurements into a PQView database, and more.
Table 1: Summary of PQDMS Download Capabilities for Monitors
| Real-Time Values | “ | “ | ||||
|---|---|---|---|---|---|---|
| Company | Monitor | Metering | Waveforms | Phasors | Data Download | Meter Setup |
| Advantech® Corporation | ADAM Analog and Digital Modules | ▪ | ▪ | ▪ | ||
| Arbiter® Systems | Power Sentinel 1133A | ▪ | ▪ | ▪ | ▪ | |
| Camille Bauer | SINEAX A230, SINEAX A230S, SINEAX A220, and SINEAX A210 | ▪ | ▪ | |||
| GE® | KV Meter | ▪ | ▪ | ▪ | ||
| Dranetz® | DataNode® 5520, 5530, 5560, 5571, 61000, HDPQ, HDPQ SD | ▪ | ▪ | ▪ | ▪ | ▪ |
| Dranetz® | ES210, ES220, ES230, 5540 | ▪ | ▪ | |||
| Dranetz® | PQNode® 7100, 8010, DataNode® 5571 | ▪ | ||||
| Gossen Metrawatt | MAVOSYS 10 | ▪ | ▪ | ▪ | ▪ | ▪ |
| MODBUS® Devices | ▪ | ▪ | ▪ | |||
| Power Standards Lab® | PQube® Classic, PQube® 3 | ▪ | ||||
| Rockwell Automation | I-Grid Website | ▪ | ||||
| Schneider Electric | ION and PME | ▪ | ▪ | |||
| Schweitzer Engineering Laboratories® (SEL) | Relays, Reclosers, Concentrators, and Power Quality Monitors | ▪ |
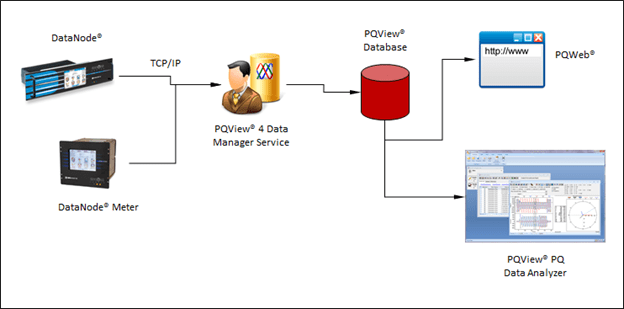
PQDMS Download of Dranetz DataNodes
PQView’s Power Quality Data Manager Service (PQDMS) application can be used to completely manage a system of Dranetz DataNodes monitors. See Figure 5.
The functions supported by PQView with DataNodes include:
• Manage Monitor Configuration
• Download Data Automatically and on Demand
• Manage All Communication with Monitors
• Manage Time Synchronization
• Access Monitor Status and Identification Information
• Access Real-Time Data for Metering, Phasors, and Scope Waveforms
• Send Email Notifications via SMTP
PQDMS runs as a background Microsoft Windows service. It can be programmed to download measurements from DataNode devices on a regular schedule using a TCP/IP connection or telephone modem.
PQDMS uses the same communication modules and data handlers used by the Dranetz/Electrotek Encore Series Software (ESS) when working with Dranetz DataNode monitors.
PQDMS has an HTTP interface that can be driven programmatically. Users normally use PQWeb 4 for configuration. The PQWeb 4 user interface runs on standard web browsers including Internet Explorer, Chrome, Safari, and Firefox. Interactivity in the browser is provided via JavaScript and HTML 5; no Java plugins are needed.
Electrotek recommends running the PQDMS on a machine with Microsoft Windows Server 2008R2 or later. Small systems and testing can be run on Microsoft Windows 7 and later.