Published by Electrotek Concepts, Inc., PQSoft Case Study: Distribution Substation Harmonic Measurement Data Evaluation, Document ID: PQS1016, Date: October 15, 2010.
Abstract: This case study presents a distribution harmonic data analysis for a substation monitoring location for a three-month period. The utility substation included a step-down transformer and a number of distribution feeders that supplied a mix of residential and commercial customers. One of the feeders had a switched 600 kVAr capacitor bank that was being used for power factor correction and voltage control. The analysis included trends of the rms voltage and statistical summaries of the voltage and current distortion values.
INTRODUCTION
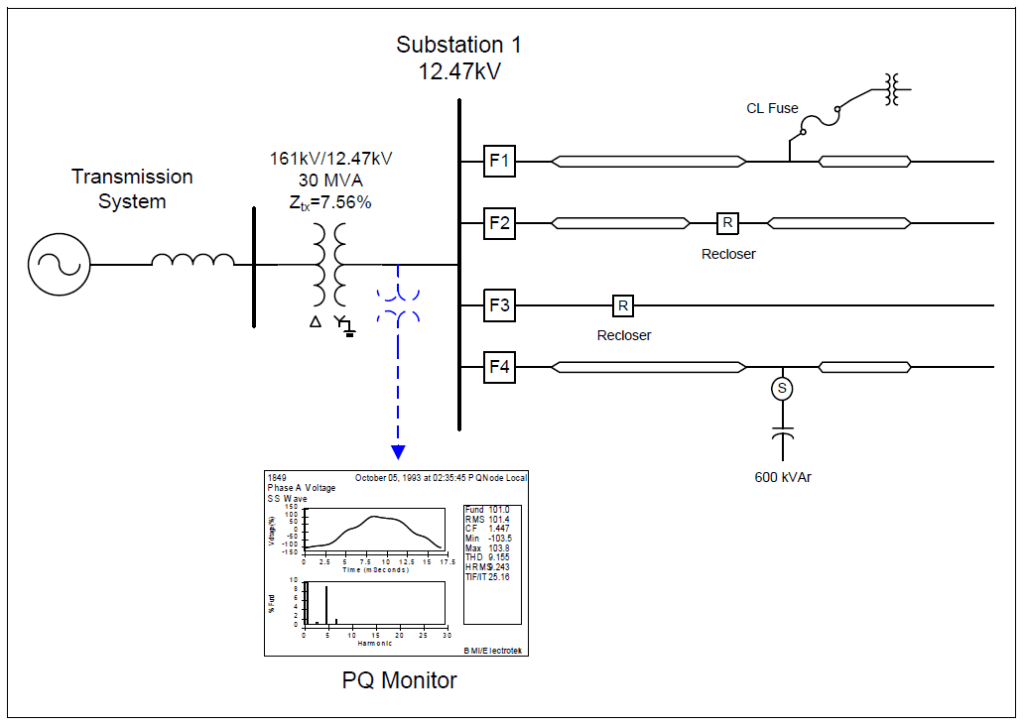
A distribution substation harmonic measurement analysis case study was completed for the 12.47 kV utility system shown in Figure 1. The utility substation included a 30 MVA, 161 kV/12.47 kV step-down transformer and a number of distribution feeders that supplied a mix of residential and commercial customers. In addition, one of the feeders had a switched 600 kVAr capacitor bank that was being used for power factor correction and voltage control.
The three-month monitoring period was from January 1, 2009 thru March 31, 2009. The power quality instrument used to complete the harmonic measurements was the Dranetz-BMI Encore SeriesTM. The instrument samples voltage at 256 points-per-cycle, current at 128 point-per-cycle, and follows the IEC 61000-4-3 method for characterizing harmonic measurement data. This involves analysis of continuous 200msec samples and storing aggregated 10-minute minimum, average, and maximum trend data. The measurement and statistical analysis was completed using the PQView® program.
SIMULATION RESULTS
Figure 2 shows the measured rms voltage regulation trend on the 12.47 kV substation bus during the three-month monitoring period. One pole-mounted 600 kVAr distribution feeder capacitor bank was switched on-and-off each day using time clock controls in an attempt to maintain a relatively constant voltage profile. Statistical analysis of the 25,520 individual steady-state measurements yielded a minimum rms voltage of 12.427 kV, an average voltage of 13.022 kV, and a maximum voltage of 13.499 kV. In addition, the CP95 value was 13.277 kV (106.5% of nominal). CP95 refers to the cumulative probability, 95th percentile of a value. Figure 3 shows the measured substation voltage distortion (VTHD) trend during the three-month monitoring period.
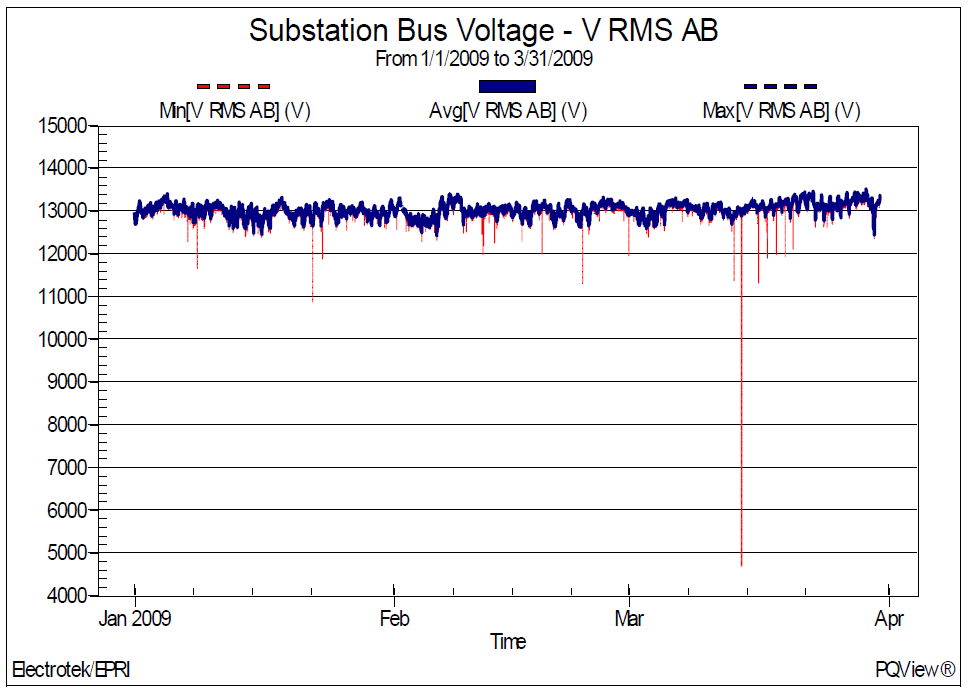
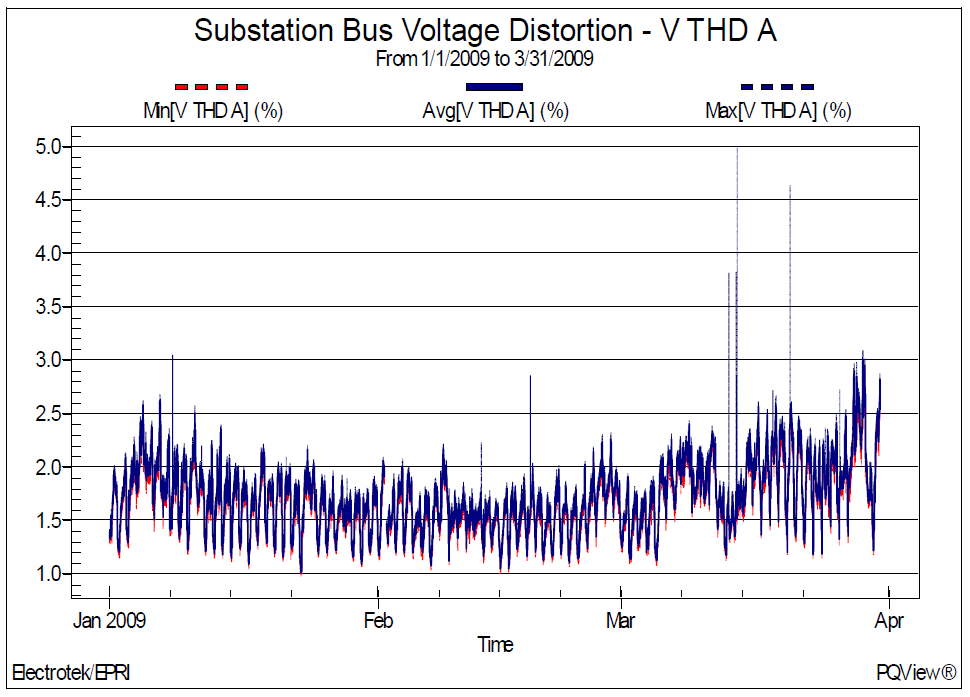
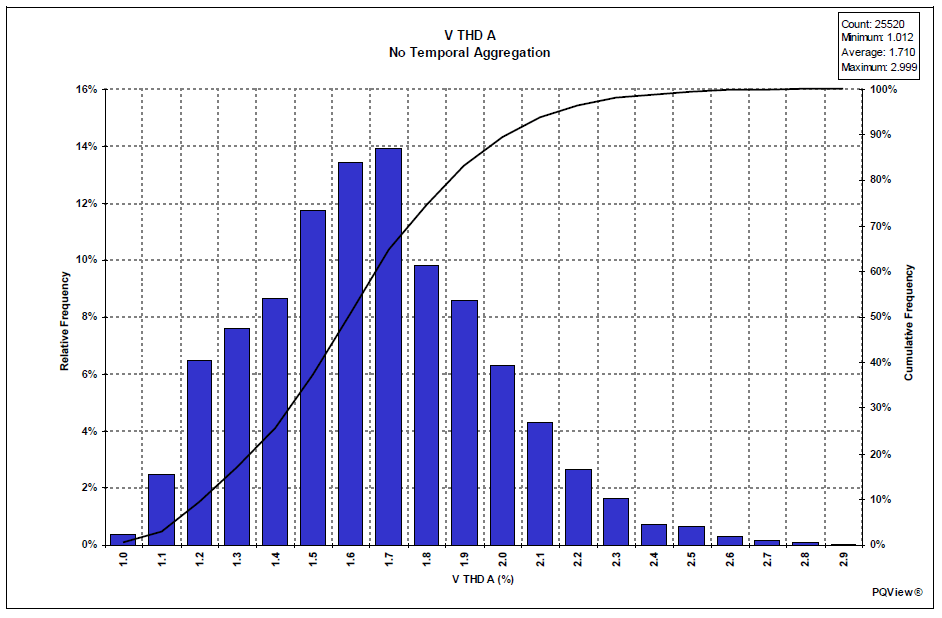
Figure 4 shows the corresponding voltage distortion histogram. Statistical analysis of the measurement data yielded a minimum distortion of 1.01%, an average distortion of 1.71%, and a maximum distortion 2.99%. The CP95 value was 2.24%. The measured voltage distortion was below the IEEE Std. 519 limit of 5%

Figure 5 and Figure 6 show the measured current distortion trend and histogram during the three-month monitoring period. Statistical analysis yielded a minimum distortion of 2.61%, an average distortion of 7.34%, and a maximum distortion 16.19%. The CP95 value was 11.01%.
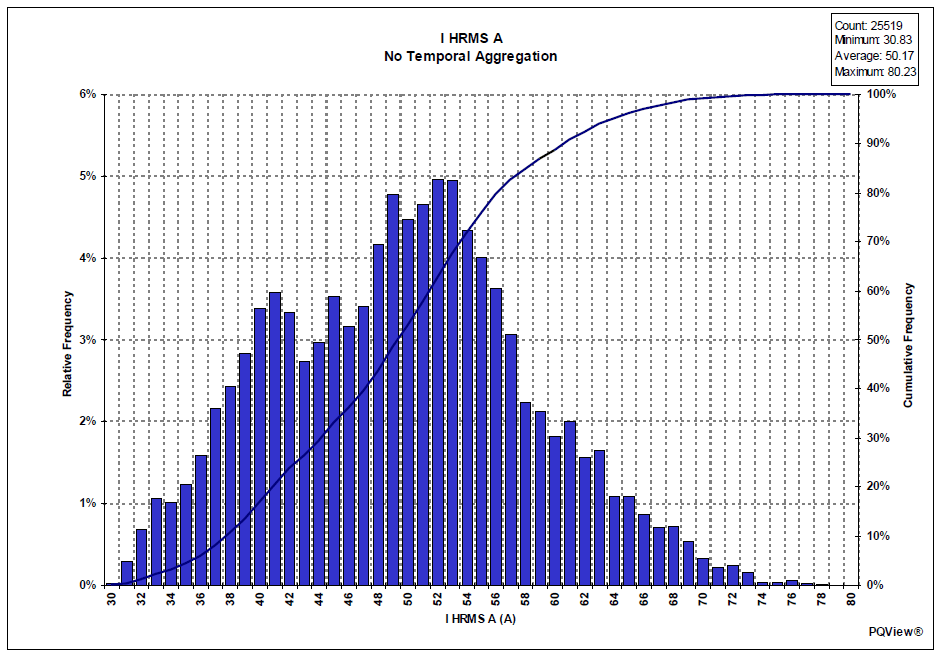
Figure 7 and Figure 8 show the measured substation harmonic current trend and histogram in amperes. The trend also shows the IEEE Std. 519 total demand distortion (TDD) current limit, which was determined to be approximately 60 A. The short-circuit capacity at the 12.47 kV substation bus was 340 MVA and the average maximum demand load was approximately 16 MVA. That resulted in a short-circuit ratio of 21.3, which resulted in a TDD limit of 8% (using the 2nd row of the current limit table in IEEE Std.519). Converting the TDD percent limit to amperes yielded a value of approximately 60 A (740.8 A * 0.08 = 59.3 A), which was also shown on Figure 7.
Statistical analysis yielded a minimum rms harmonic current of 30.83 A, an average current of 50.17 A, and a maximum current of 80.23 A. The CP95 value was 65.07 A, which meant that the harmonic current exceeded the IEEE Std. 519 limit for the three-month measurement period.
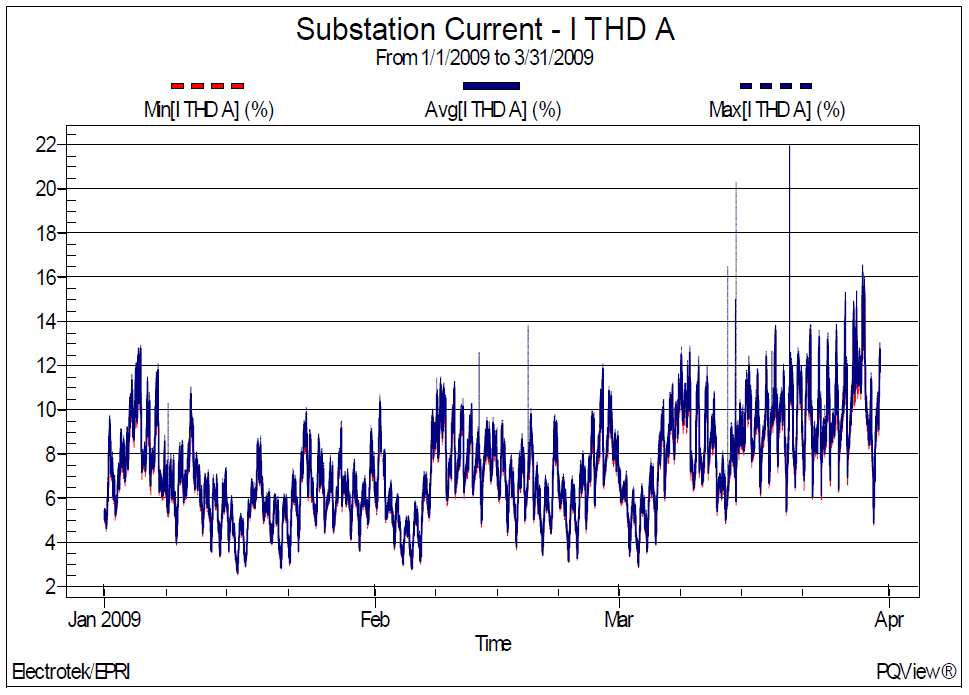
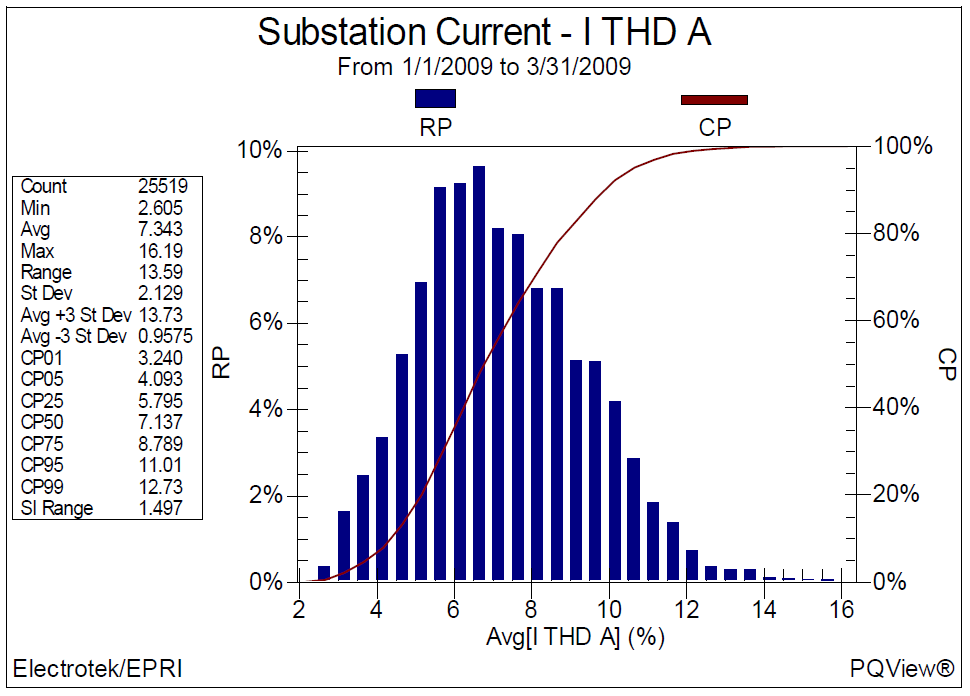
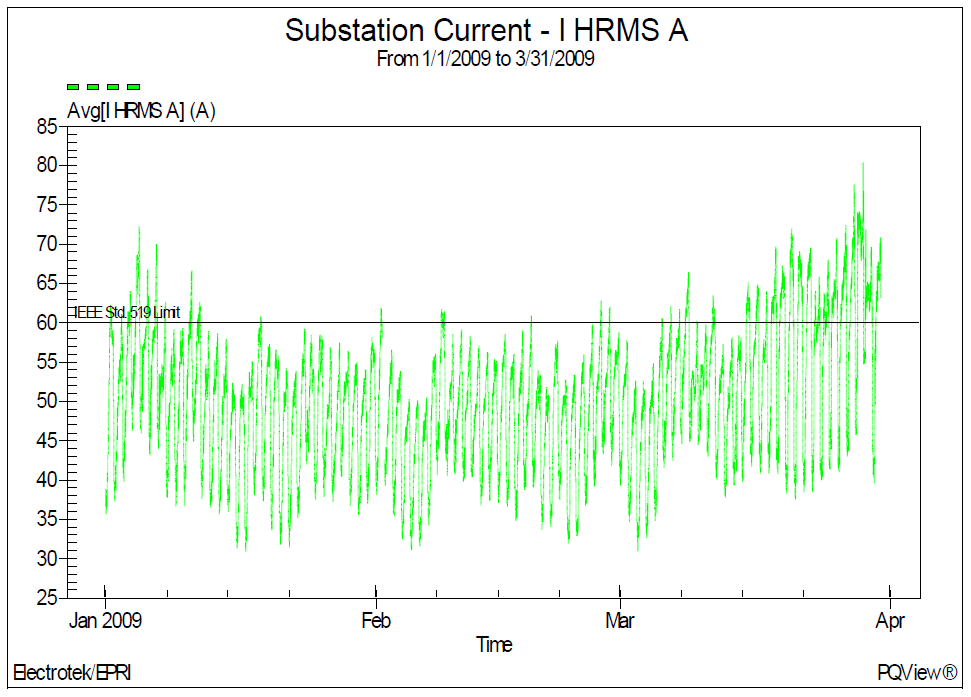
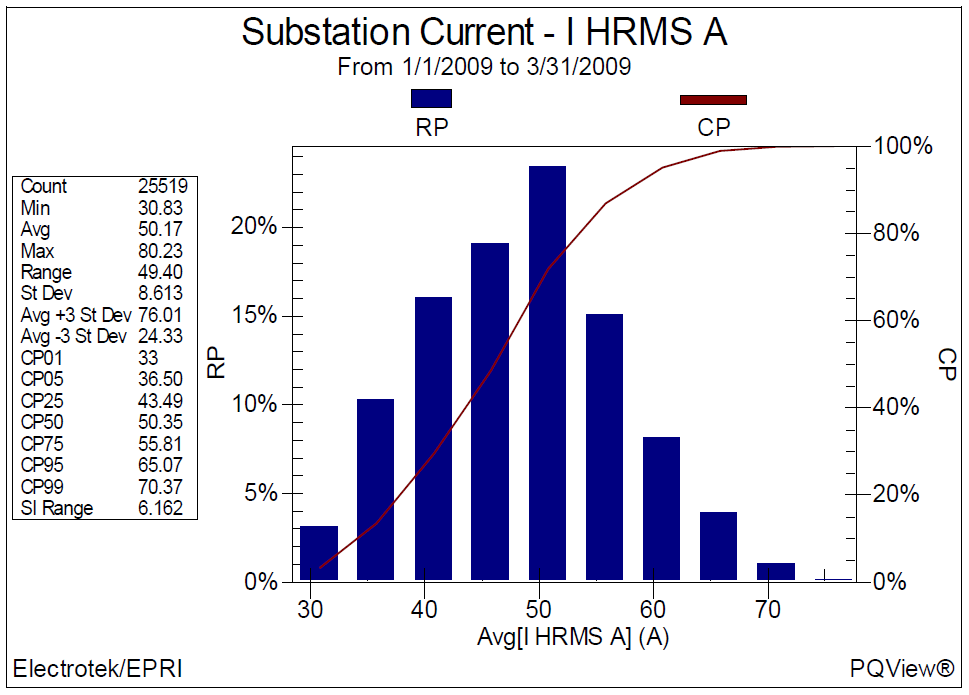
Figure 9 shows the measured substation 13th harmonic current trend in amperes. The top portion of the figure shows the entire three-month monitoring period, while the bottom portion of the figure shows a one-week snapshot. The one-week view of the 13th harmonic current highlights the change in the feeder resonance condition each time the 600 kVAr capacitor bank was switched.
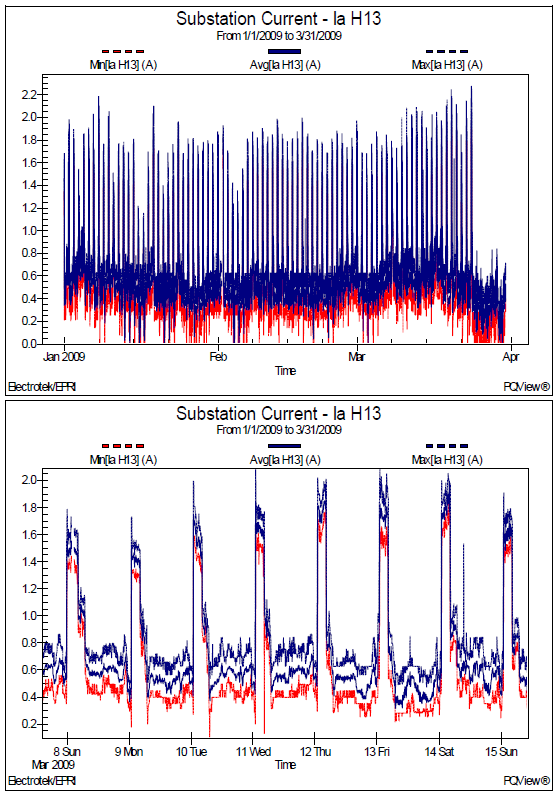
Figure 10 shows the statistical summary of total harmonic voltage distortion (VTHD) and number of individual harmonics for the three-month monitoring period. The analysis showed that the predominate harmonics for the measured substation bus voltages were the 3rd, 5th, 7th, and 9th. The measured values were below the IEEE Std. 519 voltage distortion limits, which were 5% THD and 3% for any individual harmonic.
The statistical summary in Figure 10 corresponds to the voltage distortion measurement data previously shown in Figure 4 (voltage distortion histogram). Statistical analysis of the measurement data yielded a CP05 of 1.24%, an average distortion of 1.71%, and CP95 value of 2.24%, which corresponded to the first column of results in Figure 10.
Figure 11 shows the corresponding statistical summary of total harmonic current distortion and number of individual harmonics for the three-month monitoring period. The analysis showed that the predominate harmonics for the measured substation currents were the 3rd, 5th, 7th, and 9th. The base current for the statistics summary was 740.8 A, which was the load current used for the IEEE Std. 519 evaluation.
The statistical summary in Figure 11 corresponds to the harmonic current data previously shown in Figure Statistical analysis yielded a CP05 value of 36.50 A (4.93%), an average current of 50.17 A (6.77%), and a CP95 value of 65.07 A (8.78%), which corresponded to the first column of results in Figure 11. Analysis of the measurement results showed that the harmonic current exceeded the IEEE Std. 519 TDD limit during the three-month measurement period.
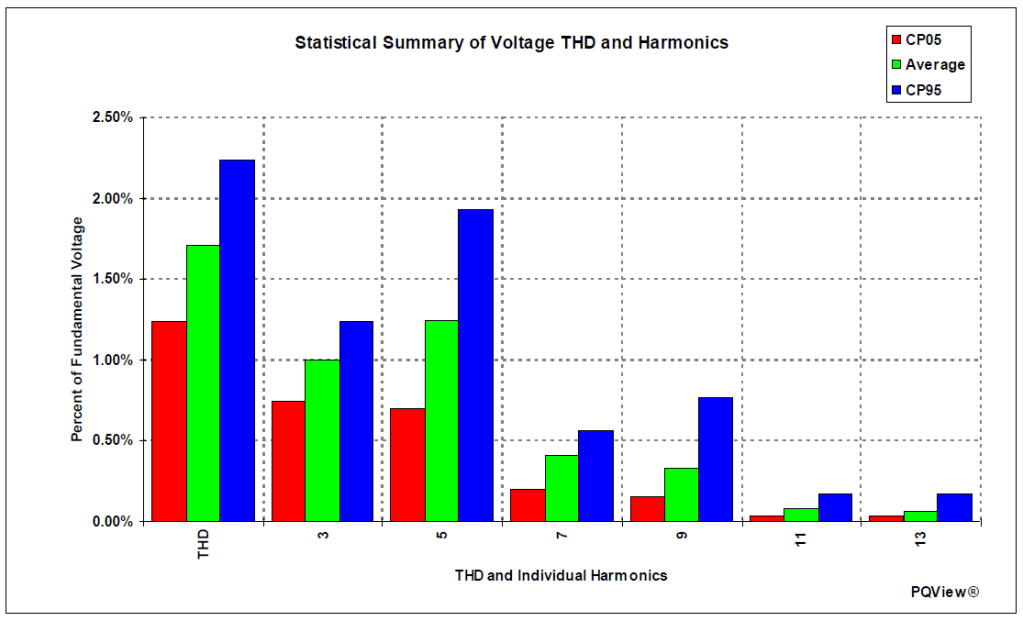
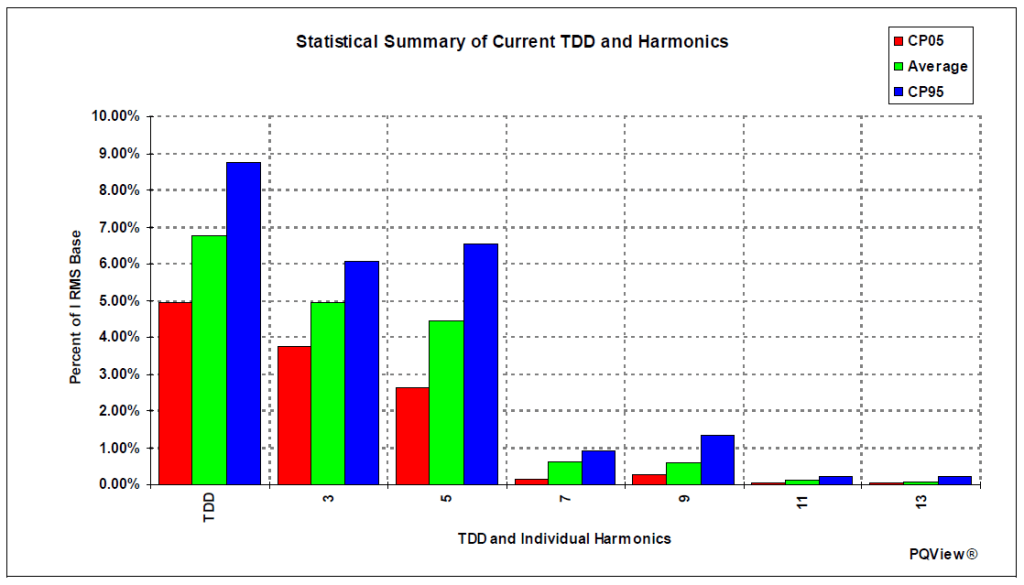
Figure 12 shows one sample calculated harmonic current waveform from the measured harmonic spectrum data. The waveform was created using an inverse DFT with 256 points per cycle. The fundamental frequency current value was 499 A, the rms current value was 502 A, and the current distortion was 10.1%.
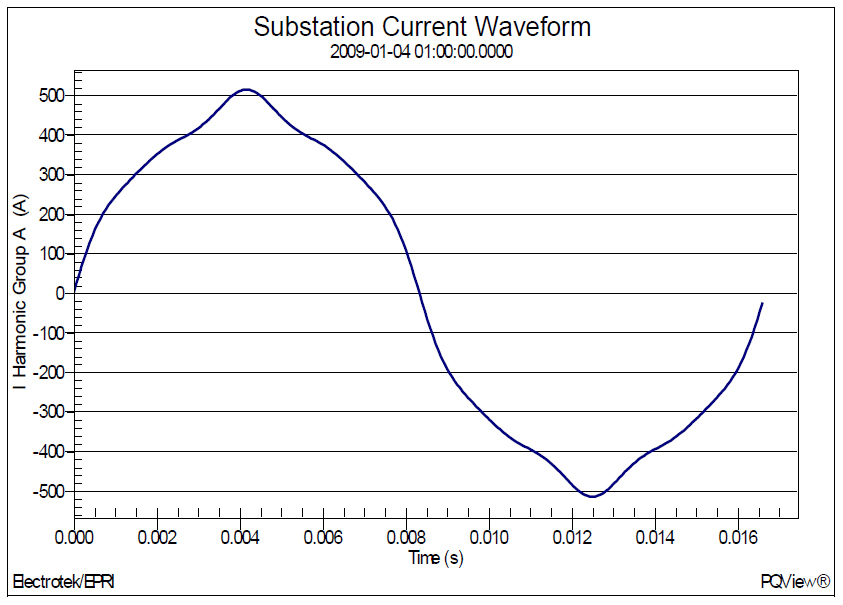
Figure 13 and Figure 14 show the steady-state analysis histograms and cumulative probability curves for the measured substation bus voltage distortion and substation current for the three-month monitoring period.
SUMMARY
This case study presents a distribution substation harmonic data analysis for a 12.47 kV monitoring location for a three-month period. The utility substation included a 161 kV/12.47 kV step-down transformer and a number of distribution feeders that supplied a mix of residential and commercial customers. In addition, one of the feeders had a switched 600 kVAr capacitor bank that was being used for power factor correction and voltage control.
The analysis included trends of the rms voltage and statistical summaries of the voltage and current distortion values. The results of the analysis showed that the harmonic voltage distortion levels were below the IEEE Std. 519 voltage limits, however, a number of the current measurements exceeded the respective current limits. Switching of the pole-mounted 600 kVAr capacitor bank caused a resonance condition that increased the harmonic voltage and current distortion levels.
Mitigation alternatives for reducing harmonic distortion levels include methods for modifying the power system to reduce or eliminate the harmonic resonances that can cause very high current or voltage distortion levels. For example, a passive shunt harmonic filter may be added to the utility or customer system to divert the troublesome harmonic currents off the system and into the filter.
In addition, the rating of power factor correction capacitor banks may be changed to shift the harmonic resonance frequency and reduce the resulting voltage distortion levels. This is often one of the least expensive options for both utilities and their customers. Voltage regulation and power factor correction considerations should be evaluated before changing capacitor bank ratings.
Power factor correction capacitor banks may be moved to a point on the system with a different short-circuit impedance or higher losses. This is also an option for utilities when a new capacitor bank causes telephone interference because moving the capacitor bank to another branch of the feeder may very well resolve the problem. This is frequently not an option for industrial facilities because the capacitor bank cannot be moved far enough away electrically to make a significant difference.
Finally, the power factor correction capacitor bank may be completely removed. For a customer, this may mean that they accept somewhat higher losses, lower voltages, and perhaps a power factor penalty from the utility. If technically feasible, this may occasionally be the best economic choice.
REFERENCES
1.IEEE Recommended Practice for Monitoring Electric Power Quality,” IEEE Std. 1159-1995, IEEE, October 1995, ISBN: 1-55937-549-3.
2.IEEE Recommended Practices and Requirements for Harmonic Control in Electrical Power Systems, IEEE Std. 519-1992, IEEE, ISBN: 1-5593-7239-7.
3.R.C. Dugan, M.F. McGranaghan, S. Santoso, H.W. Beaty, “Electrical Power Systems Quality,” McGraw-Hill Companies, Inc., November 2002, ISBN 0-07-138622-X.
RELATED STANDARDS
IEEE Std. 1159, IEEE Std. 519
GLOSSARY AND ACRONYMS
ASD: Adjustable-Speed Drive
DPF: Displacement Power Factor
PF: Power Factor
PWM: Pulse Width Modulation
THD: Total Harmonic Distortion
TPF: True Power Factor
