Published by Electrotek Concepts, Inc., PQSoft Case Study: Commercial Facility Harmonic Evaluation, Document ID: PQS1005, Date: March 15, 2010.
Abstract: Utility power system harmonic problems can often be solved using a comprehensive approach including site surveys, harmonic measurements, and computer simulations.
This case study presents the results for a commercial facility harmonic evaluation. The simulations were completed using the PSCAD program. The analysis evaluates the effects of transformer connections to determine the harmonic current distortion levels on both the primary and secondary sides of the customer transformers. The simulation results show the third harmonic neutral current and a K-Factor transformer derating analysis.
INTRODUCTION
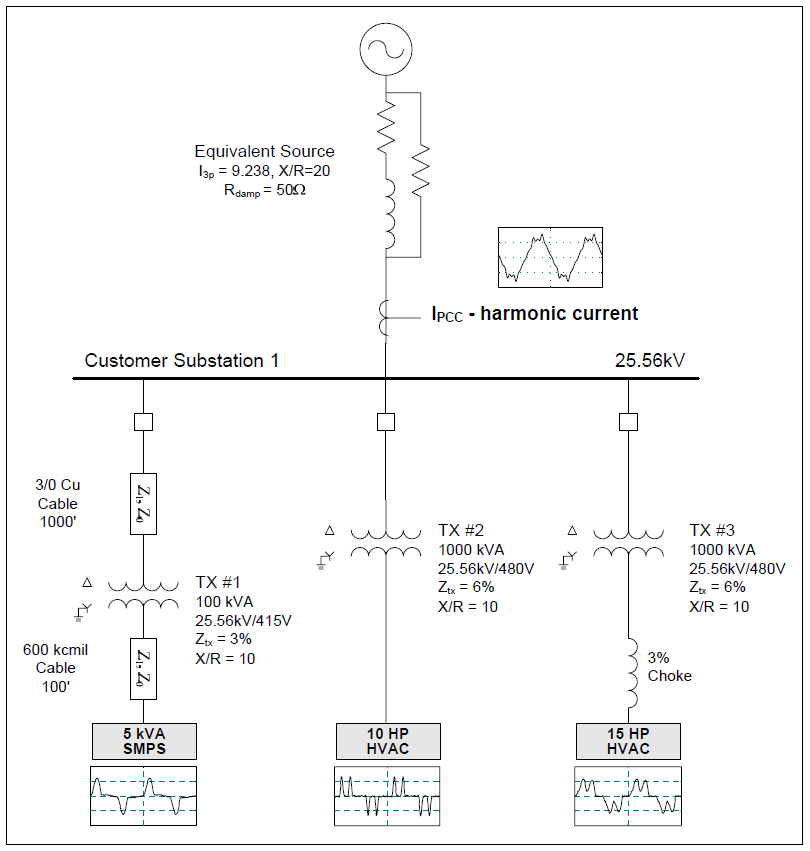
A commercial facility harmonic evaluation was completed for the system shown in Figure 1. The case study was completed using the PSCAD program. The accuracy of the simulation model was verified using three-phase and single-line-to-ground fault currents and other steady-state quantities.
The circuit model for the case involved a 25.56kV customer substation with two 1,000 kVA step-down transformers supplying HVAC loads and one 100 kVA transformer supplying switch-mode power supply (SMPS) loads.
Switch-mode power supplies use dc/dc conversion techniques for maintaining constant dc voltage output. In the absence of a large ac-side inductance, input current to the power supply becomes positive and negative current pulses, characterized by high crest factors (peak to rms ratio) and high harmonic content. A high third harmonic current content is especially typical of switch-mode power supplies. Since third harmonic current components do not cancel each other in the neutral of a three-phase system, increasing application of switch-mode power supplies has created a concern for overloading of neutral conductors, especially in older buildings where an undersized neutral may have been utilized.
SIMULATION RESULTS
The case study evaluates the effects of transformer connections to determine the harmonic current distortion levels on both the primary and secondary sides of the customer transformers. Figure 2 shows the simulated power supply current and the resulting current on the transformer primary due to the delta/wye connection that traps the zero sequence harmonics in the primary delta winding.
The secondary power supply current has a fundamental frequency value of 6.76 amps, an rms value of 8.10 amps, and a THD value of 66.12%. The highest component was the 3rd harmonic with a value of 62.30%. The resulting primary transformer current has fundamental frequency value of 0.15 amps, an rms value of 0.16 amps, and a THD value of 14.89%. The highest components were the 5th harmonic with a value of 12.93% and the 7th harmonic with a value of 6.39%.
Figure 3 shows the transformer derating and K-Factor calculations. The assumed eddy current loss factor (PEC-R) for the dry type 100 kVA transformer was 8%. A K-Rating of four would be sufficient for this application.
Figure 4 shows the transformer neutral current when supplying the power supply loads. The phase A power supply current is also shown for reference. The triplen harmonics add in the neutral to create a waveform that that consists of mostly 3rd harmonic (180 Hz) frequency. The rms value of the neutral current was 12.72 amps, with the highest components being the 3rd at 12.63 amps, the 9th at 1.41 amps, and the 15th at 0.25 amps. One mistake commonly made with this type of waveform is to use a THD value in percent. This is because the fundamental frequency component of the neutral current in a balanced system approaches zero amps, which leads to a THD value that approaches infinity.
Figure 5 shows the simulated HVAC #1 current and the resulting current on the transformer primary. The secondary current has a fundamental frequency value of 13.10 amps, an rms value of 24.12 amps, and a THD value of 154.58%.
Figure 6 shows the simulated HVAC #2 current and the resulting current on the transformer primary. The secondary current has a fundamental frequency value of 16.18 amps, an rms value of 18.57 amps, and a THD value of 56.44%.
Figure 7 shows the simulated point of common coupling (PCC) current at the utility/customer interface. The current has a fundamental frequency value of 3.73 amps, an rms value of 3.74 amps, and a THD value of 8.18%. The highest components were the 5th harmonic with a value of 3.99%, the 7th harmonic with a value of 4.30%, the 11th with a value of 4.05%, and the 13th with a value of 2.89%. The values of the triplen harmonics (e.g., 3rd, 9th, 15th, etc.) were negligible due to the fact that all of the transformers supplying the nonlinear customer loads have delta connected primary windings and also that all of the customer loads were balanced.

SUMMARY
This case study summarizes the results for a commercial facility harmonic evaluation. The case study evaluates the effects of transformers connections to determine the harmonic current distortion levels on both the primary and secondary sides of the customer transformers. The simulation results show the third harmonic neutral current and a K-Factor transformer derating analysis. The simulation results also highlight the effect of harmonic current cancellation that may occur in a facility which results in lower distortion at the point of common coupling.
REFERENCES
- Power System Harmonics, IEEE Tutorial Course, 84 EH0221-2-PWR, 1984.
- IEEE Recommended Practice for Monitoring Electric Power Quality,” IEEE Std. 1159-1995, IEEE, October 1995, ISBN: 1-55937-549-3.
- IEEE Recommended Practices and Requirements for Harmonic Control in Electrical Power Systems, IEEE Std. 519-1992, IEEE, ISBN: 1-5593-7239-7.
RELATED STANDARDS
IEEE Std. 519-1992
IEEE Std. 1159-1995
GLOSSARY AND ACRONYMS
ASD: Adjustable-Speed Drive
CF: Crest Factor
DFT: Discreet Fourier Transform
DPF: Displacement Power Factor
PCC: Point of Common Coupling
PF: Power Factor
PWM: Pulse Width Modulation
TDD: Total Demand Distortion
THD: Total Harmonic Distortion
TPF: True Power Factor
