Published by Electrotek Concepts, Inc., PQSoft Case Study: Distribution System Transient Measurement Data Evaluation, Document ID: PQS1012, Date: October 15, 2010.
Abstract: This case study presents a utility distribution system transient measurement data analysis. The distribution system included a number of feeders that supplied a mix of residential, commercial, and industrial customers. The causes of the transients measured during the monitoring period included capacitor bank switching, transformer energizing, single-phase faults, recloser operations, switch failures, and current-limiting fuse operations.
INTRODUCTION
A utility distribution system transient measurement data analysis case study was completed for the system shown in Figure 1. The 12.47 kV utility substation included a 30 MVA, 69 kV/12.47 kV step-down transformer and a number of distribution feeders that supplied a mix of residential, commercial, and industrial customers. There was a 6,000 kVAr, 12.5 kV capacitor bank at the substation bus that was energized using a synchronous closing control switch. In addition, each of the distribution feeders had a number of fixed or switched capacitor banks being used for power factor correction and voltage control.
The monitoring period was for one year and utilized power quality instruments that sampled voltages at 256 points-per-cycle and currents at 128 point-per-cycle. The sampling rate allowed characterization of low-to-medium frequency oscillatory transients. The measurement analysis was completed using the PQView® program. The causes of the transients measured during the monitoring period included capacitor bank switching, transformer energizing, single-phase faults, switch failure, recloser operations, and current-limiting fuse operations.
MEASUREMENT RESULTS
Figure 2 shows the measured voltage (per-unit) and current (A) waveforms during uncontrolled energization of the pole-mounted 600 kVAr capacitor bank on feeder #1. The measurement site was PQ2. The capacitor bank was switched on-and-off each day using time clock controls in an attempt to maintain a relatively constant voltage profile. The peak magnitude of the measured transient voltage was 1.09 per-unit and the principal frequency for the capacitor energizing waveform was approximately 650 Hz. The capacitor bank was energized using three single-phase mechanical oil switches with a pole span of approximately 3-5 cycles.
Typical voltage magnitude levels for switching distribution capacitor banks range from 1.3 to 1.5 per-unit and typical transient frequencies generally fall in the range from 300 to 1000 Hz. Power quality problems related to utility capacitor bank switching include customer equipment damage or failure, nuisance tripping of adjustable-speed drives or other process equipment, transient voltage surge suppressor failure, and computer network problems.
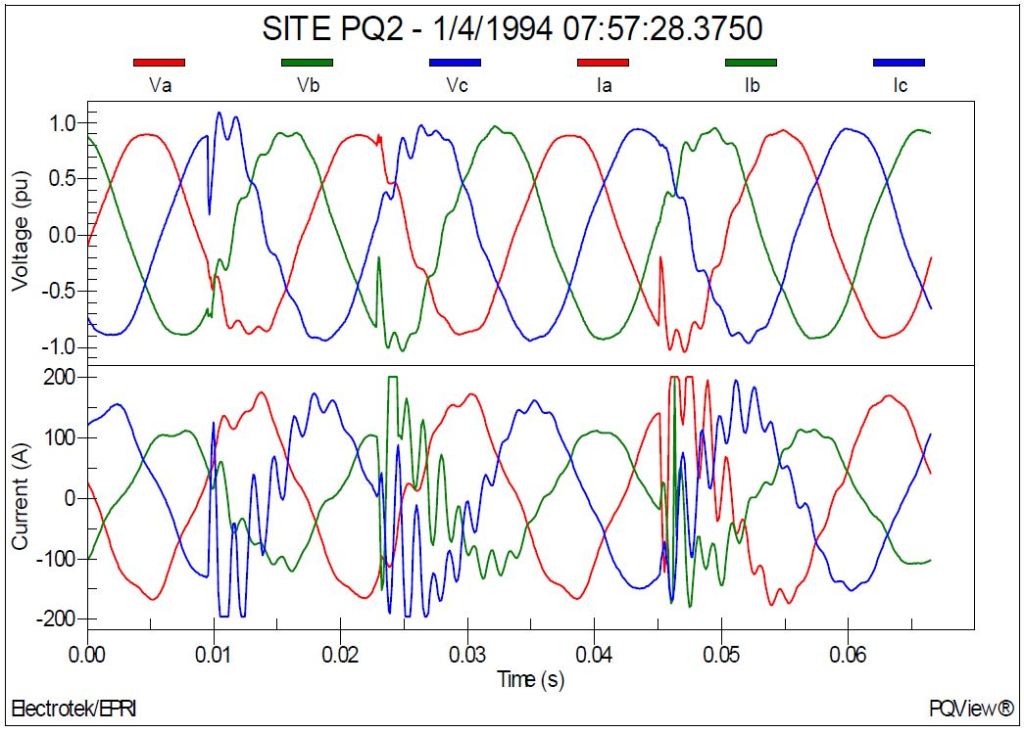
Figure 3 shows the measured current waveform during back-to-back capacitor bank switching on feeder 2. Energizing a shunt capacitor bank with an adjacent capacitor bank already in service is known as back-to-back switching. High magnitude and frequency currents will flow between the capacitor banks when the second capacitor bank is energized. The measurement site was PQ3. The waveform shows the current that flows between the two 1,800 kVAr capacitor banks when the second capacitor bank is energized with the first capacitor bank already in service. The magnitude of the peak current was 600 A and the principal frequency was about 2.0 kHz.
The high-frequency inrush current may exceed the transient frequency momentary capability of the switching device (e.g., ANSI Std. C37.06-2000) as well as the I2t withstand of the capacitor fuses. It may also cause false operation of protective relays and excessive voltages for current transformers (CTs) in the neutral or phase of grounded-wye capacitor banks.

Figure 4 shows the measured 12.47 kV distribution feeder current waveform before-and-after energization of the pole-mounted 900 kVAr capacitor bank on feeder #3. The capacitor bank was switched on-and-off each day at the same time using a time clock control. The measurement site was PQ4.
The peak transient current for the capacitor bank energization portion of the event was 460 A. Insertion of the 900 kVAr capacitor bank creates a harmonic resonance that results in higher levels of current distortion. The steady-state total harmonic current distortion (ITHD) after energization of the capacitor bank was 13.26%.
Utilities switch capacitor banks in-and-out of service routinely to provide voltage support and to improve power factor. One potential disadvantage of capacitor bank switching is the effect that such an operation can have on the topology of the system. Switching capacitor banks into mostly inductive circuits can tune the natural frequency of the circuit closer to harmonic frequencies that might be prevalent on the system. Obviously, this can be a significant problem, possibly resulting in severe voltage and current distortion, increased losses, and overheating of system equipment.
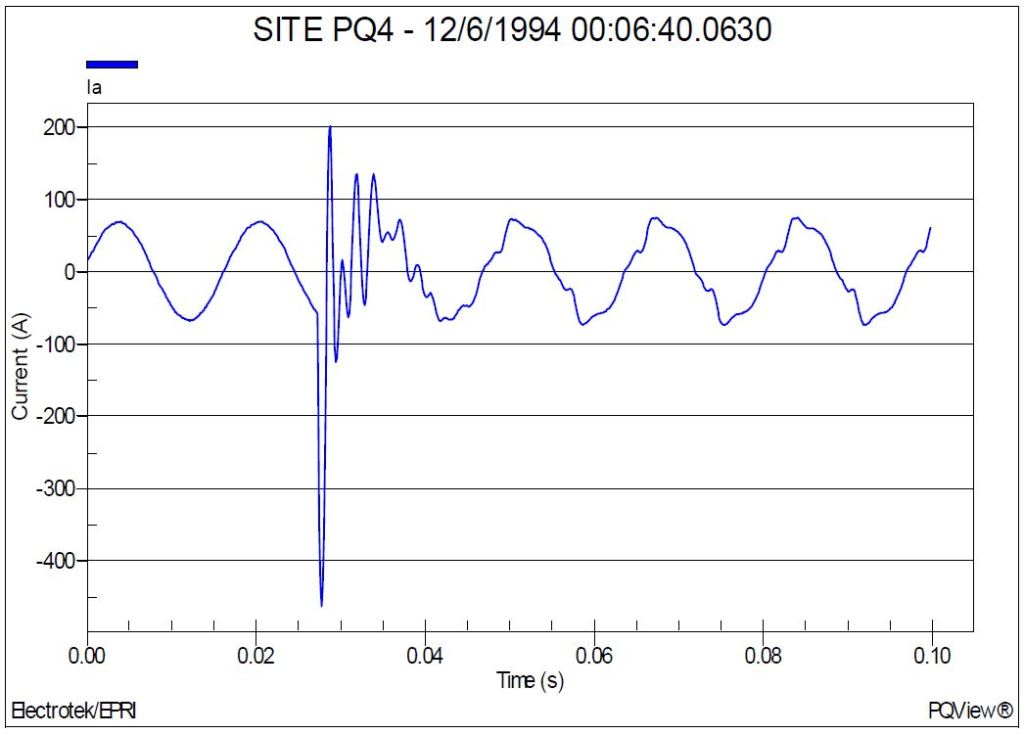
Figure 5 shows the measured voltage (per-unit) waveforms during energization of the substation 6,000 kVAr capacitor bank on feeder #1. The capacitor bank was switched using synchronous closing control. The measurement site was PQ1. The magnitude of the transient voltage at the substation bus was 1.06 per-unit.
Synchronous closing is independent contact closing of each phase near a voltage zero. To accomplish closing at or near a voltage zero (avoiding high prestrike voltages); it is necessary to apply a switching device that maintains a dielectric strength sufficient to withstand system voltages until its contacts touch. Although this level of precision is difficult to achieve, closing consistency of ±0.5 milliseconds should be possible. Previous research has indicated that a closing consistency of ±1.0 millisecond provides overvoltage control comparable to properly rated pre-insertion resistors. The typical transient overvoltage range for synchronous closing control would be between 1.05 and 1.20 per-unit depending on the capacitor bank rating and a number of other system parameters.
The success of a synchronous closing scheme is often determined by the ability to repeat the process under various (e.g., system and climate) conditions. Adaptive, microprocessor-based control schemes that have the ability to learn from previous events address this concern. The primary benefits of this capability are the control’s ability to compensate for environmental factors and the increased reliability (less maintenance) that can be achieved. Grounded capacitor banks are controlled by closing the three phases at three successive phase-to-ground voltage zeros (60° separation). Ungrounded banks are controlled by closing the first two phases at a phase-to-phase voltage zero and then delaying the third phase 90 degrees (phase-to-ground voltage zero).
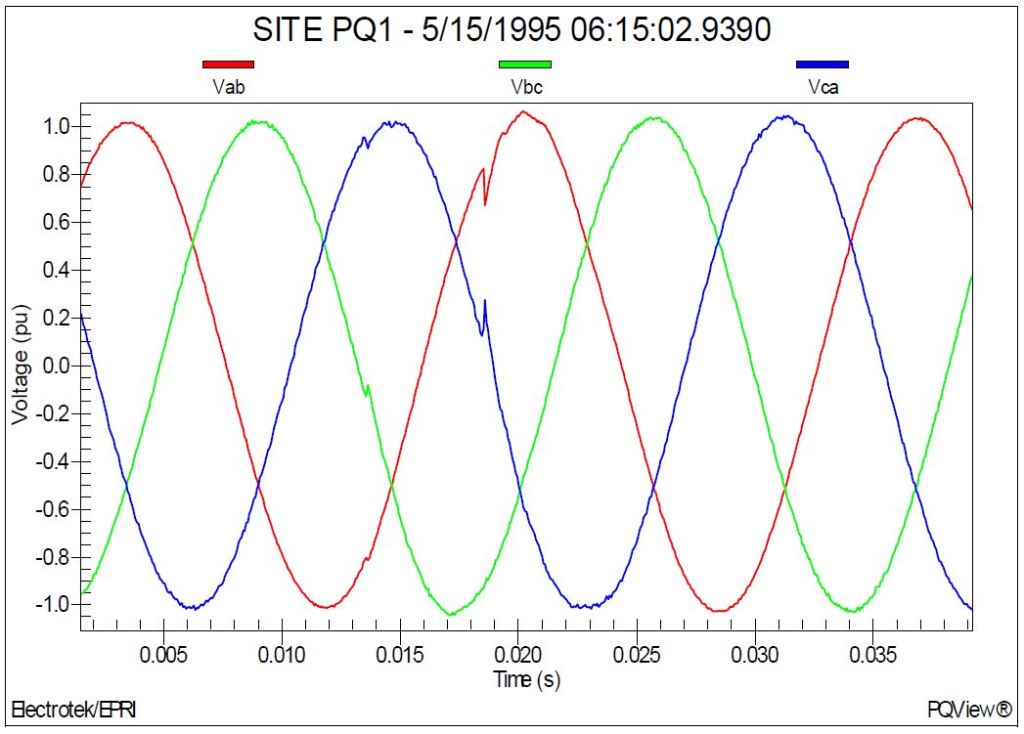
Figure 6 shows the measured voltage (per-unit) and current (A) waveforms during a ferroresonance event on feeder #4. The measurement site was PQ5. The magnitude of the ferroresonant voltage at the monitoring location was 1.42 per-unit. The cause of the ferroresonance event was an unbalanced operation caused by a single-phase fuse operation on a customer step-down transformer.
Ferroresonance is a term generally applied to a wide variety of interactions between capacitors and iron-core inductors that result in unusual voltages and/or currents. In linear circuits, resonance occurs when the capacitive reactance equals the inductive reactance at the frequency at which the circuit is excited. Iron-core inductors have a nonlinear characteristic and therefore a range of inductance values. This relationship may lead to a number of operating conditions where the inductive reactance does not equal the capacitive reactance, but very high and damaging overvoltages occur.
If high voltages accompany the ferroresonance, there could be electrical damage to both the primary and secondary circuits. Surge arresters commonly fail during this condition. Arrester failures are related to the heating of the arrester block, and at times, the failures can be catastrophic, with parts being expelled from the arrester housing. In a typical power system, ferroresonance occurs when a transformer becomes isolated on a cable section in such a manner that the cable capacitance appears to be in series with the magnetizing characteristic of the transformer. An unbalanced switching operation is required to initiate the condition. Ferroresonance cannot always be entirely avoided. However, steps can be taken to reduce the probability of occurrence.

Figure 7 shows the measured current (A) waveform during a transformer energizing event on feeder #4. The measurement site was PQ5. The peak magnitude of the primary inrush current at the monitoring location was 46 A and the duration of the event was approximately 10 cycles. The cause of the transformer inrush was a recloser operation during circuit restoration.
Energizing saturable devices (devices with magnetic cores), such as power transformers, results in inrush currents that are rich in harmonic components. The inrush current interacts with the system impedance vs. frequency characteristics to create a voltage waveform that can have significant harmonic components for the duration that the inrush current is present. Transformer inrush current typically decays over a period on the order of one second.
This phenomenon combines concerns for harmonic current distortion and transient voltages. The harmonics of concern are low order (dominated by the 2nd through the 5th harmonics). If the circuit has a high impedance resonance near one of these frequencies, a dynamic overvoltage condition results that can cause failure of arresters and problems with sensitive equipment.
This problem is typically limited to cases of energizing large transformers with large power factor correction capacitor banks (e.g., arc furnace installations or other large industrial facilities). The solution to problems with dynamic overvoltages is to make sure that the conditions causing the system resonance are not present when the transformer is energized. This could mean making sure a capacitor bank is out of service whenever a large transformer is energized.
Figure 8 shows the measured voltage (per-unit) waveform during the operation of a current-limiting fuse (type 25K CL) on feeder #4. The measurement site was PQ5. The maximum peak arc voltage for the event was approximately 140% (1.40 per-unit). The fault was cleared by the fuse in approximately ½ cycle.
Current-limiting fuses are often used in electrical equipment where the fault current is very high and an internal fault could result in a catastrophic failure. There are various designs, but the basic configuration is that of a thin ribbon element or wire wound around a form and encased in a sealed insulating tube filled with a special sand. The tube is constructed of stout material such as a fiberglass-epoxy resin composite to withstand the pressures during the interruption process without rupturing. The element melts in many places simultaneously and, with the aid of the melting sand, very quickly builds up a voltage drop that opposes the flow of current. The current is forced to zero in about ¼ cycle.
The main purpose of current-limiting fuse is to prevent damage due to excessive fault current. They have the beneficial side effect with respect to power quality that the voltage sag resulting from the fault is very brief. The voltage sag is so short that not many industrial processes will be adversely affected. Therefore, one proposed practice is to install current-limiting fuses on each lateral branch in the high fault current region near the substation to reduce the number of sags that affect industrial processes.
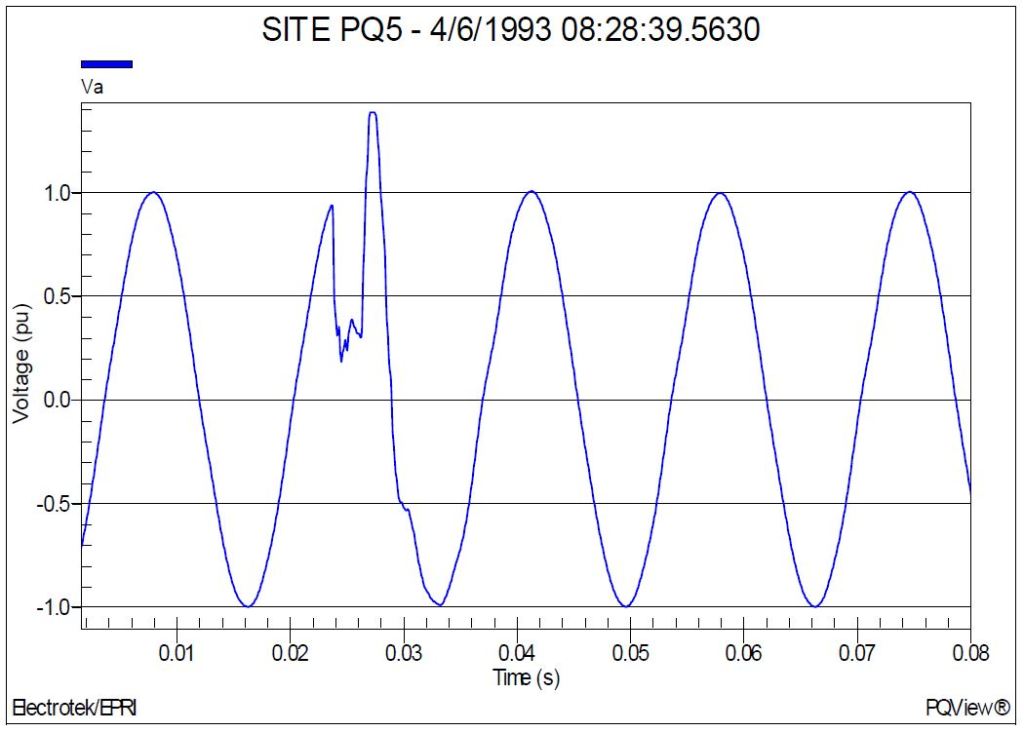
Figure 9 shows the measured current (A) waveform during an arcing fault on feeder #1. The
measurement site was PQ4. The fault occurred during a thunderstorm and it was cleared in
approximately 4 cycles by a recloser on an adjacent feeder.
Arcing faults are quite common on distribution and transmission feeders. These types of faults are usually caused by lightning strikes to the circuit, tree limbs contacting the circuit, or animals contacting the circuit. Arcing faults often contain a significant third harmonic component. Consequently, the arcing voltage waveform often has a “flat-top” appearance, resembling a square-wave. The arcing current typically exhibits a continuous ringing. This characteristic can be attributed to the ringing between the system inductance and capacitance as the voltage changes suddenly as occurs with the step change of a square-wave.
With respect to arcing faults, thunderstorms subject distribution systems to double jeopardy. Not only does the lightning associated with the storm create the potential for flashovers, but the wind associated with the storm increases the chance of tree limb contact. An example of an arcing fault voltage is shown in Figure 10, which shows a measured voltage waveform during an arcing fault on a feeder #3. The fault occurred during a storm that was caused by a tree limb being blown into one phase of the distribution line.
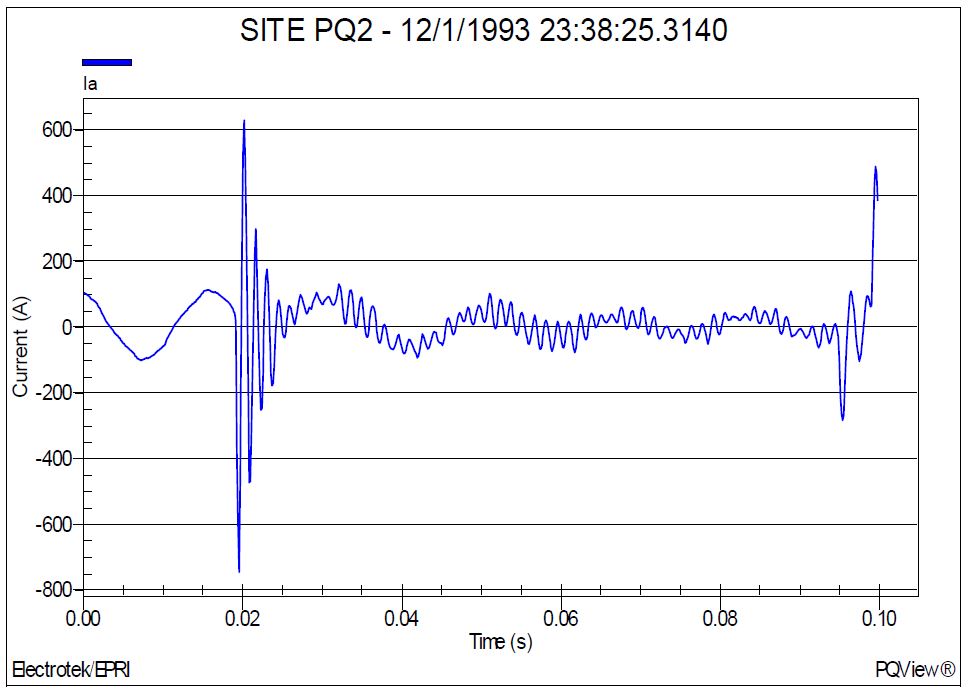

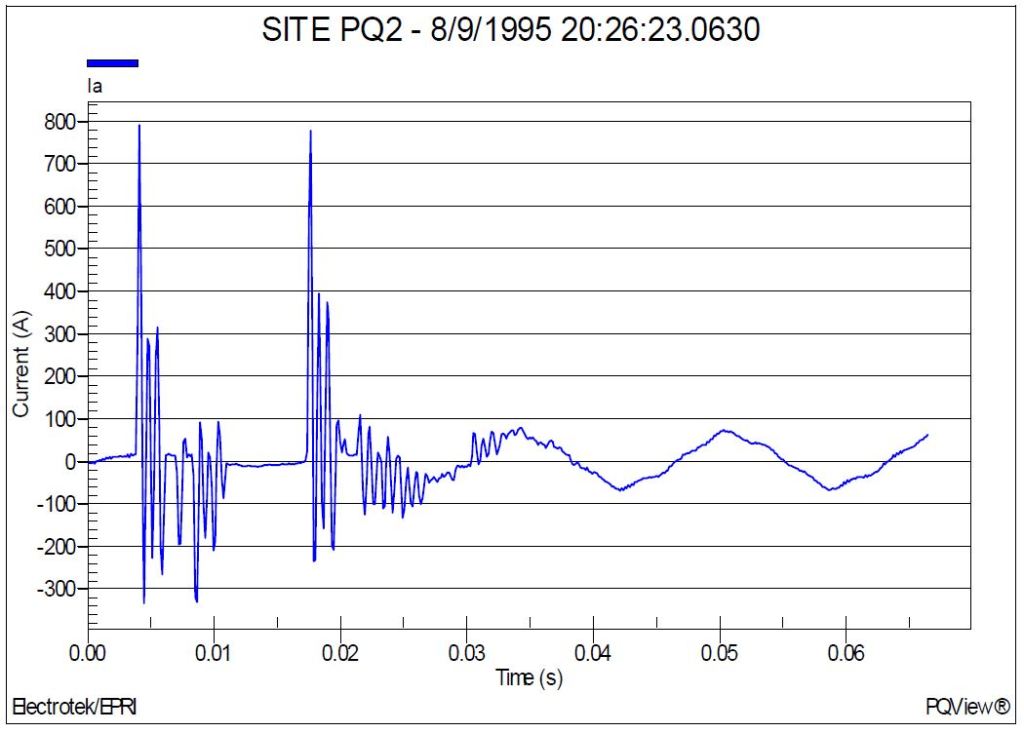
Figure 11 shows the measured current (A) waveform during a capacitor switch failure on feeder #1. The measurement site was PQ2. The maximum transient current magnitude for the event was approximately 790 A. Many similar transient waveforms were recorded at the monitoring site during a one-week period. These events showed that the switch performance had continue to deteriorate.
As the capacitor switch began to fail, abnormal events including arcing and pre-striking occurred. These were the initial warning sign that a more serious failure was about to occur. Closer examination of the waveform indicated that the pole of the switch did not properly close, possibly bouncing. This abnormal event resulted in two distinct energizations. First, the pole bounces, making a connection temporarily, but it does not latch. This results in an arc that extinguishes as the contacts pull apart. As the switch continues to close, however, the pole finally latches, and the capacitor bank was energized.
SUMMARY
This case study summarized a distribution system transient measurement data analysis. The causes of the transients measured during the monitoring period included capacitor bank switching, transformer energizing, single-phase faults, recloser operations, switch failures, and current-limiting fuse operations.
REFERENCES
- IEEE Recommended Practice for Monitoring Electric Power Quality,” IEEE Std. 1159-1995, IEEE,
October 1995, ISBN: 1-55937-549-3. - R.C. Dugan, M.F. McGranaghan, S. Santoso, H.W. Beaty, “Electrical Power Systems Quality,”
McGraw-Hill Companies, Inc., November 2002, ISBN 0-07-138622-X.
RELATED STANDARDS
IEEE Std. 1159, IEEE Std. 1100, IEEE Std. 446, ANSI Std. C84.1
GLOSSARY AND ACRONYMS
ASD: Adjustable-Speed Drive
CF: Crest Factor
DPF: Displacement Power Factor
PF: Power Factor
PWM: Pulse Width Modulation
THD: Total Harmonic Distortion
TPF: True Power Factor
