Published by Electrotek Concepts, Inc., PQSoft Case Study: Voltage Sags and Their Impact on Industrial Customers, Document ID: PQS0509, Date: September 30, 2005.
Abstract: This case study describes the impact of voltage sags on a utility and one industrial customer. Several utility measures are presented to minimize the customer’s exposure to voltage sags. However, these measures cannot completely eliminate the impact of voltage sags on sensitive equipment.
A case study is presented in this paper that includes measurement results that were used to characterize the voltage sags experienced on the utility system and in the industrial facility. As part of this case study, simulation results used to develop “area of vulnerability curves” for the industrial facility, mitigation equipment that was employed to improve the sensitive equipment’s ride-through capability, and the lessons learned from the systems approach analysis are included.
INTRODUCTION
In 1991, facility engineers started to monitor power quality. It did not take long to correlate equipment shutdowns and failures with incidents of lightning storms in the surrounding region. Distressed by the frequency of voltage sag occurrences and wishing to avoid an overwhelming capital expenditure in power conditioning equipment, the facility approached their electric utility for assistance.
In response to the customer’s request, the utility initiated a study of the electrical supply to the facility. The utility study concluded that the occurrences of voltage sags at the facility were indeed greater than normal. To remedy the problem, the facility and the utility took a unique team approach that deviated from traditional customer-utility relationships. In a cooperative effort between the customer and utility it was decided to apply a system approach to the facility’s power quality. In the system approach, the facility’s power distribution was evaluated from the point of generation through the point of use. The system approach involved several simultaneous efforts. These efforts and associated responsibilities included
- The evaluation of transmission line routing to the facility by the utility.
- The evaluation of tower and shield wire integrity and resistance by the utility.
- An evaluation of equipment sensitivity to voltage sags by the facility.
- An identification of truly critical equipment by the facility.
- More extensive and detailed monitoring by the facility and the utility.
An important part of the project was to identify specific voltage sag events and relate these events to equipment failures. To enhance the existing monitoring capability of the facility, the utility invited the facility to become a participating site in a nation-wide study of utility power quality. Participation in the study increased the facility’s monitoring capability to a total of 10 highly sensitive power quality monitors. Using these monitors, the facility recorded seven voltage sags in a one-year period. Lightning caused six of the seven voltage sags and five of the six sags resulted in equipment failures. Monitoring equipment allowed accurate plots to be made of voltage sag duration and magnitude. None of the lightning events caused a total loss of power to the facility. In fact, the worst sag lasted for 267 milliseconds and dropped the line voltage by 69%. Armed with this data it became clear that any remedial power conditioning equipment would have to maintain line voltage for only a very short duration.
Utility Enhancements
After reviewing the outage reports from the utility, it was determined that the feeders serving the facility were experiencing abnormally high fault rates compared to the system average during lightning storms. To alleviate this problem, the utility changed the way in which their system was supplied.
The utility changed their operations which resulted in very little double circuit feed (4 miles) to the industrial facility. By feeding the facility with two separate lines, the faults due to lightning strokes were reduced. The utility also used counterpoise to help eliminate the voltage sags and interruptions due to lightning flashovers.
Monitoring Results
A monitoring project was conducted where three locations inside the industrial facility were monitored for power quality disturbances. Figure 2 shows the locations of the monitors within the facility. Two of the monitors were installed on the 480 volts system while the third monitor was installed at the 13.8kV bus. The duration of this monitoring project was from June 1992 through December 1993.
Although the monitors installed can monitor for various power quality disturbances, only RMS variations (sags and swells), interruptions, and outages will be considered.
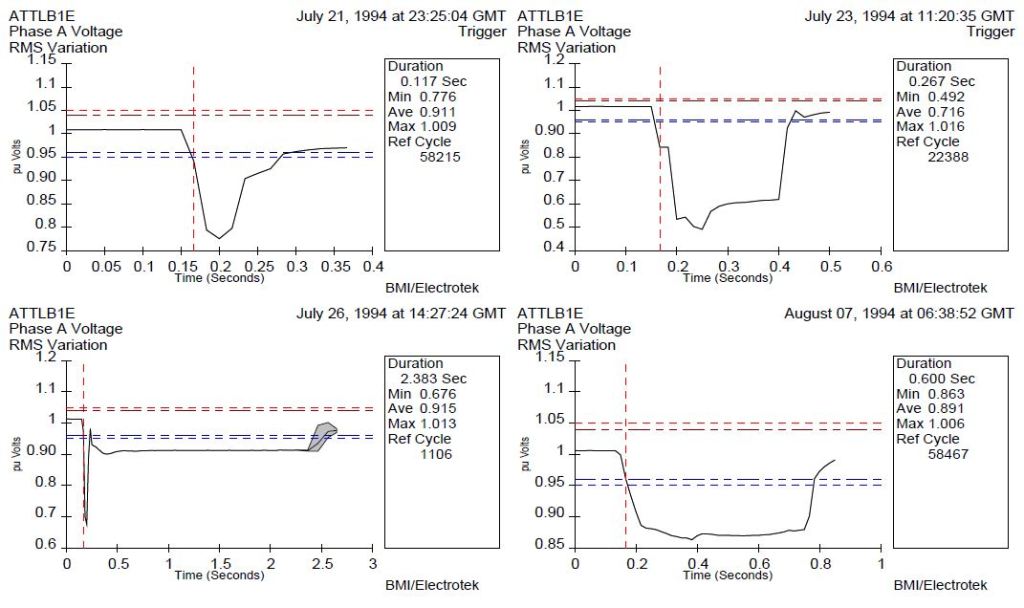
A typical voltage sag measured in the facility is illustrated in Figure 1. This voltage sag was measured at the 13.8kV bus. The voltage sag illustrated in Figure 1 lasted approximately 16 cycles and the sag magnitude was 0.29 per-unit.

Figure 2 illustrates all the RMS variations that were recorded at the facility (all three monitors, all phases) during the monitoring period. Figure 2 is known as a magnitude-duration scatter plot. It also incorporates information from the computer business equipment manufacturer’s association (CBEMA) curve. This curve is typical design curve for power conscious computer manufacturers and represents the design goals of a wide variety of electronic apparatus and computer manufacturers. [4]
By using the design goals of IEEE/ANSI 446-1987 [4] for evaluation purposes, then 62 of these events, 61 below and one above CBEMA, would have caused problems with equipment at the facility. However, the equipment within the facility is not all electronic or computer equipment and this CBEMA plot overlay is intended only as reference.

Customer Enhancements
As part of this case study, several measures to improve sensitive equipment ride-through capability were considered. Through past experience, the industrial customer had investigated the use of a battery backed UPS for their critical loads. In fact, they had installed approximately 125 kVA of UPS back up in their facility. However, due to the nature of the loads in the facility and their disparity, it was decided to investigate a different technology for supplying ride-through protection.
One such technology was the written pole motor-generator set (MG set). This technology provides 100 % output voltage to the rated load for up to 15 seconds with a zero voltage on the input [10]. This technology was decided on for several reasons:
- From the monitoring results, it can be seen that the average duration of voltage sags experienced at the facility were approximately 8 cycles (0.133 mS).
- Although the MG sets come in 15 kVA and 35 kVA units, they can be paralleled to achieve virtually any rating.
- Maintenance on UPSs is more critical, expensive, and time consuming than on the MG sets.
- Other critical loads are backed by UPS; however, a majority of other critical loads are motor based and therefore, the inertia inherent in motors was a significant advantage.
After deciding on the technology to be used, the size or rating of the equipment was determined. To accomplish this, a thorough survey of the plant was conducted and the total critical load was determined. The total critical load in the plant was determined to be 13 kVA.
With the amount of critical load to be fed from the MG set (13 kVA) and future expansion of the facility in mind, a 35 kVA MG set was selected. The MG was installed and all critical load was supplied via the MG set. After the installation of the MG set, it was discovered that the MG set performed better than expected. The MG set was capable of supplying the 13 kVA of load for approximately 28 seconds after total loss of power [2].
Customer Sensitivity
Through the use of the monitors installed in the facility, the customer has determined their sensitivity level to voltage variations. Figure 3 illustrates the customer’s sensitivity level along with the more recognized CBEMA levels. As can be seen from Figure 3, the facility’s voltage tolerance is more sensitive than the limits set forth by IEEE Std. 446, better known as the CBEMA limits.

There were four events during 1994 that would have caused misoperation of process critical equipment. Although the output of a MG set was not monitored, the customer has determined that these events would have caused problems at the facility without the use of MG sets. All the events were a result of thunder and lightning activity.
SUMMARY
A majority of the problems experienced at the industrial facility were lightning induced. The utility took all the measures possible to them to eliminate or reduce the voltage sags caused by lightning as listed below:
- Performed simulations to determine the effects of lightning on the transmission system.
- Performed simulations to determine fault levels at several locations throughout the transmission system.
- Installed counterpoise on lines with high footing resistance.
- Re-sectionalized the circuit feeding the facility to limit exposure to double circuit flashovers.
- Implemented a monitoring program to characterize the nature of voltage sags affecting the facility.
- Kept a log of all activity on the transmission system serving the customer.
As part of this study, the customer was asked to perform several tasks:
- Take simple site survey of their facility to out-line what equipment was critical to their operation.
- Install more sophisticated monitors than they had already installed. This enabled the characterization of the voltage sags experienced at the facility.
- Keep a log of disturbances that adversely affected the critical equipment within the facility.
- Re-configure the circuits feeding their sensitive equipment. Feed all sensitive loads from one circuit. This helped in the design of a protection scheme with the MG sets.
- Purchase and install MG set to serve their critical load.
By having the utility work with the customer and using a system approach to solving the problems encountered at the customer facility, a mitigation technology and system was quickly and efficiently developed and employed.
REFERENCES
- IEEE Std. 1159 “Recommended Practice for Monitoring Electric Power Quality,”.
- G. E. Beam, et al, “Power Quality Case Studies Voltage Sags The Impact on the Utility and Industrial Customers”, Conference Record of the 1993 PQA Conference, pp 5-1:1 – 5-1:7, San Diego, CA, 1993.
- D. D. Sabin, et al, “Preliminary Results from the EPRI Distribution Power Quality Project.” Proceedings: PQA ‘94 Conference, Amsterdam, Netherlands, October 1994.
- IEEE/ANSI Std. 446-1987. IEEE Orange Book, “Recommended Practice for Emergency and Standby Power Systems for Industrial and Commercial Applications.”
- IEEE Std. 1346, “Electric Power System Compatibility with Industrial Process Equipment,”
- IEEE Recommended Practice for Powering and Grounding Sensitive Electronic Equipment, IEEE std. 1100-1992, pg. 47, 1992.
- D. S. Dorr, “Power Interruption Study Discloses Frequency and Impact”, Power Quality Magazine, Vol. 3, No 5, pp. 8-10, 1992.
- B. M. Hughes, “Distribution Customer Power Quality Experience”, Conference Record of the 1991 IEEE Industry Applications Society Annual Meeting, pp. 1556-1563, 1991.
- M. F. McGranaghan, D. R. Mueller, M.J. Samotyj “Voltage Sags in Industrial Systems”, IEEE Transactions on Industry Applications, Vol. 29, No. 2 March/April 1993.
- Precise Power Corporation, The Precise Power “Written Pole” Motor, 1993.
- L.V. Bewley, Traveling Waves on Transmission Systems”, Dover Publications, Inc., New York, 1951.
- Larry E. Conrad, Chairman, “Proposed Chapter 9 for Providing Voltage Sags (Dips) in Revision to IEEE Std. 493, the Gold Book”, PSI Energy, Plainfield ID, 1993.
- EPRI Innovator RP2935-78.
GLOSSARY AND ACRONYMS
CBEMA: Computer Business Equipment Manufacturer’s Association
