Published by A. El Mofty K. Youssef, Alexandria Electricity Company , Alexandria – Egypt
SUMMARY
Power quality has become an increasing concern to Alexandria Electricity Company (AEC) for the last few years. Problems involving the quality of voltage to the customers are always an important point.
The increased concern of power quality has resulted in measuring power quality variations and characteristic disturbances for different industrial categories. The devices and equipments used in industry include microprocessor-based controls and electric devices that are sensitive to many types of electrical disturbances besides to actual interruptions.
Degradation of power quality is usually caused by load switching, system faults, motor starting, load variations, nonlinear loads, and intermittent loads and arc furnaces . Such disturbances give rise to surges, dips, harmonic distortions, interruptions, flicker and signalling voltages. AEC has already an extensive monitoring plan to help characterize system performance on a continuous basis . An important AEC quality problem service is the power disturbance log. This log is designed to help identify the causes of the equipment malfunction. The information in the log are date, time, list of equipment affected, length of outage and weather conditions. Accurate information will provide valuable clues towards a solution. A log helps to systematically and quickly uncover important information .
The paper presents analysis of the real time industrial electrical disturbances, power disturbance log and some suggestions to minimize or prevent inconveniences caused by power disturbances.
Three logs are designed to help identify the causes of the equipment malfunction, The data can be collected by using these logs. The data from the log can be used to identify any pattern. It is important to consider any recent changes in the factory at the time of the problem.
Log sheets are distributed to customers of AEC and the outcomes are summarized in this paper .
It has been found out that poor grounding and improper wiring give rise to internal problems. The check of wiring and measuring of earthing resistance are carried out The survey includes monitoring and analysis at the supply side and at 15 customer loads. The customers represent different industrial loads and are classified into metal, chemical, textile and food.
The dominating power quality disturbances are surges, dips and harmonics.
The worst dip has a depth of 97.02% that means 2.92% remaining voltage .
The measured voltage surges are almost between 5% and 10% in less than 20 ms . For the above mentioned cases the remedy was done by adjusting the tap changer of the distribution transformer. A few number of voltage surges are greater than 10% in less than 20 ms. In textile firm voltage surge suppressor was installed at one subbranch. The voltage profile before and after installing the surge suppressor are presented.
The full line of uninterruptible power system (UPS) and its power management software was installed in chemical firm to protect sensitive electronic equipment against power problems even in the most critical circumstances.
The electrical parameter profiles before and after installing UPS are presented . Good results have been obtained and power quality has been remarkably improved.
Tuned filter is available to isolate problem area and to mitigate the effects of harmonics. It is installed at textile firm .
Voltage dips and surges can cause light flicker .
AEC is awaring the new customers by this fact: “ THE MOST EFFECTIVE AND SUCCESSFUL METHOD OF PREVENTATION QUALITY DISTURBANCES IS TO ANTICIPATE AND ELEMENATE THEVVVVVU PROBLEMS DURING DESIGN ,CONSTRUCTION AND INSTALLATION “ and assist them to achieve that .
ABSTRACT
Power quality has become an increasing concern to Alexandria Electricity Company (AEC) for the last few years.
The increased concern of power quality has resulted in measuring power quality variations and characteristic disturbances for different industrial categories. The devices and equipments used in industry include microprocessor-based controls and electric devices that are sensitive to many types of electrical disturbances besides to actual interruptions.
Power quality disturbances are usually caused by load switching, system faults, motor starting, load variations, nonlinear loads, and intermittent loads and arc furnaces . These cause many electrical disturbances like surge, dip, harmonic distortions, interruptions, flicker and signaling voltages.
AEC has already an extensive monitoring plan to help characterize system performance on a continuous basis . An important AEC quality problem service is the power disturbance log. This log is designed to help identify the causes of the equipment malfunction. The information in the log are date, time, list of equipment affected, length of outage and weather conditions. Accurate information will provide valuable clues towards a solution. A log helps to systematically and quickly uncover important information.
The paper presents analysis of the real time industrial electrical disturbances, power disturbance log and some suggestions to minimize or prevent inconveniences caused by power disturbances.
The survey includes monitoring and analysis at the supply side and at 15 customer loads. The customers represent different industrial loads and are classified into metal, chemical, textile and food. By the use of protective devices some remedies are implemented against disturbances. Voltage profile before and after implementation is recorded
POWER QUALITY STANDARDS
The specific characteristics of supply voltage have been defined in standards, which are used to determine the level of quality with reference to : frequency, voltage level , wave shape and symmetry of the three phase voltage.
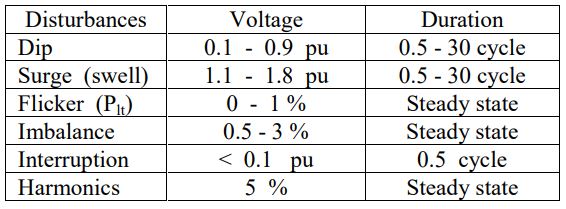
The IEEE 519-1992, IEEE 1159-1995 describe the compatibility level required by equipment connected to the network, as well as the limits of emissions from the devices, table (1) summarized the definition of disturbances. If these limits values are exceeded, the polluter may be requested to provide for corrective action.
Table (1) Power Quality Disturbances
POWER QUALITY STEPS
Power quality problems are pinpointed through four steps; Investigation, determination, analysis and prevention.
Investigation: A thorough investigation can help identify many power quality problems. Three logs are designed to help identify the causes of the equipment malfunction, shown in Log (1), Log (2) and Log (3). The data can be collected by using these Logs. The data from the log can be used to identify any pattern. It is important to consider any recent changes in the consumer network at the time of the problem. Log sheets are distributed to customers of AEC and the outcomes are summarized in table ( 2 ). The poor grounding and improper wiring are the main internal problems. According to reference [1] the ground resistance in small distribution substations, the usually acceptable range is from 1 to 5 ohm depending on local conditions .The check of wiring and measuring of earthing resistance are carried out and recorded in table ( 2 ) .
The dominated anomalies recorded from manufacturing system Log are :
- Damage of printed circuit board .
- Stop of pumps .
- Brownout without any production interruption.
- Stop of one or two lines of production .
- Failure of PC monitors.
- Microprocessor Lock-up
Table (2) Electrical disturbance Log and measured value of ER

Determinations: Requires monitoring and survey of the power supply to the affected loads. The objectives of the survey were to determine the power quality on AC supply at some industrial sites. The results would serve as a baseline against which future surveys could be compared to determine trends. Also the survey was intended to provide a statistically valid set of data reflecting the number and types of electrical disturbances. The survey includes monitoring at 15 industrial customer sites at their 380 volt service supply panels. These monitoring are carried out by MEMOBOX 800 energy and disturbance analyzers.
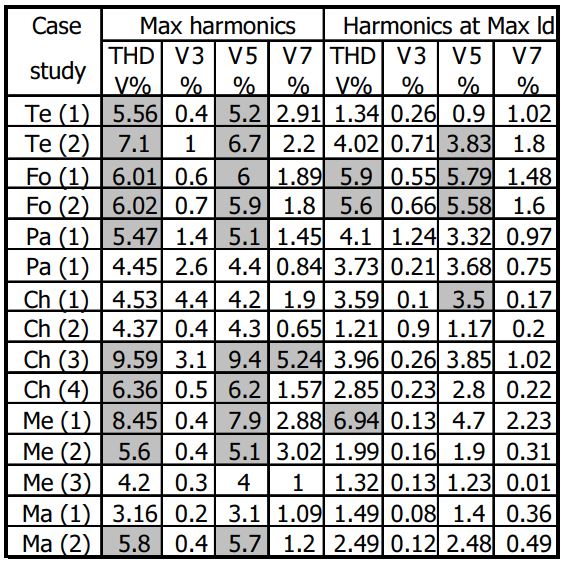
The measurement period is 7 days and 10 minutes intervals.Table ( 3 ) & ( 4 ) summarize measurement results of power quality disturbance in 15 case studies .
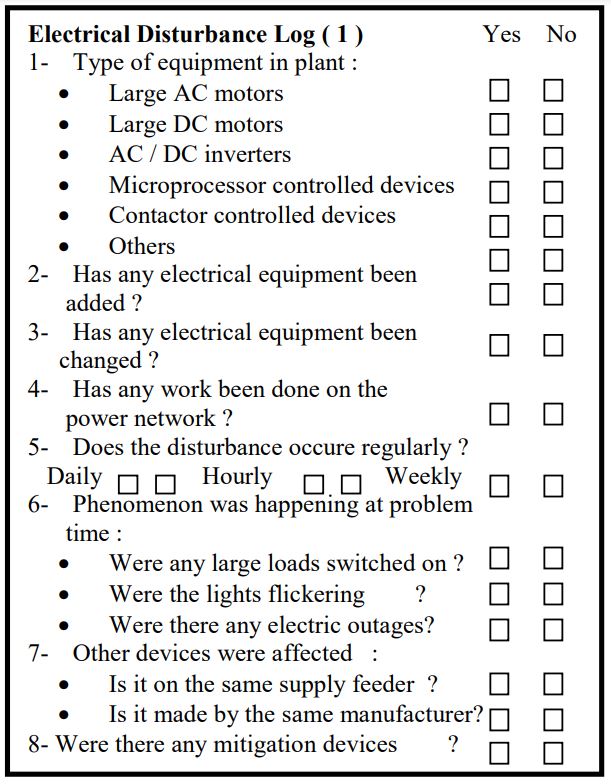
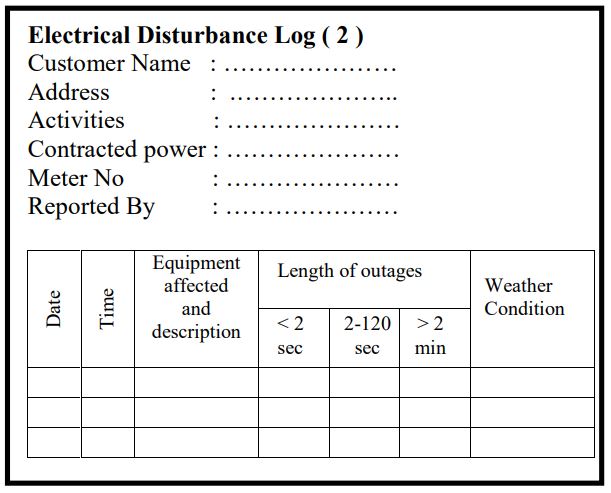

Table (3) Results of power quality measurement
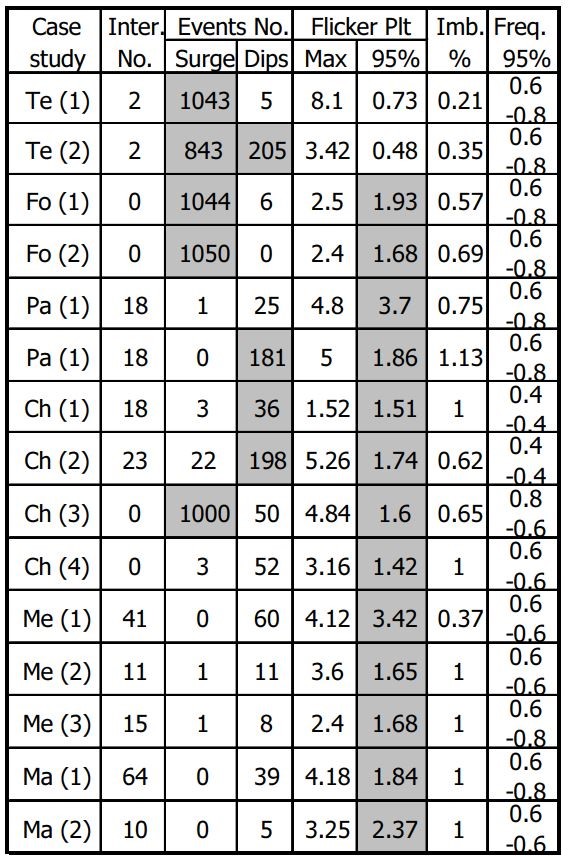
Table (4) Result of power quality measurement
Analysis and preventation: Following data collection, analysis of both recorded information and outcomes logs is necessary to chose the correct mitigation .Table ( 5 ) focus on the disturbances in each case study and the suggested mitigation Table ( 5 ) Disturbances and suggested mitigation for case studies .
Table ( 5 ) Disturbances and suggested mitigation for case studies .
1 – Case studies Te ( 2 ) ,Pa ( 2 ) , Ch ( 2 )
The voltage dips are the most important power quality problems affecting many types of industrial end-user. As industrial processes have become more automated, the equipment has become increasingly sensitive to these dips.
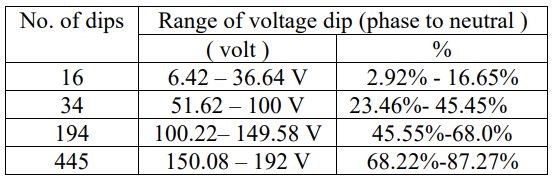
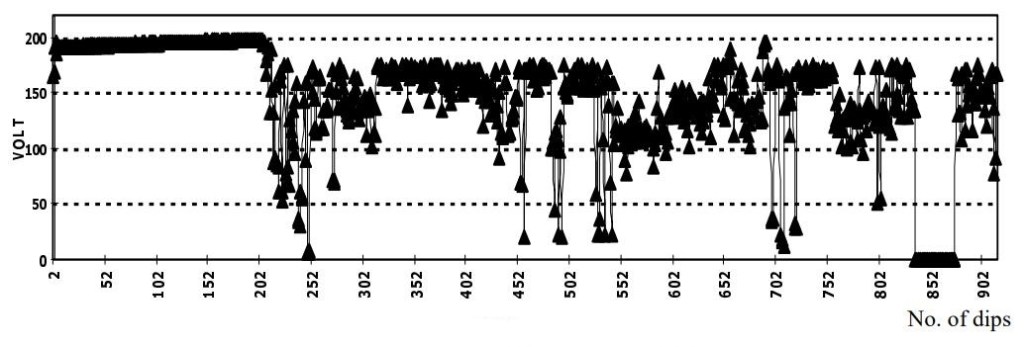
The voltage dips are caused by a remote fault somewhere on the power system, or caused by motor start inside the plant . Also large voltage deviations within the customers premises due to internal connection and wiring . The nominal service voltage for case studies is 3×380 / 220 V. Fig ( 1 ) represents the scatter plot of dips for 15 case studies, table ( 6 ) summarizes the characteristic of dips , number and values.
The worst dip has a depth of 97.02% ( about 213.6 V ) that means 2.92% ( about 6.4 V ) remaining voltage .
Table (6) voltage dips measurement
Even with a single line to ground fault on the primary of distribution transformer ( Delta Star vector group ), the voltage dip at the customer bus will be no lower than 33% normal value Vca[ 2 ] . Therefore from table ( 6 ) according to the value of voltage dips both motor starts and faults are responsible for causing the dips . With respect to voltage dips caused by up to 50 HP motor starts, the suggested recommendation is to install power conditioners. And for large voltage deviations within the customer’s network, must be taken into consideration by customers . In Te (2) , for example, the description of measured voltage dips are :
| No. of dips | Voltage dip% | Duration ms |
| 203 | 10% : 15% | < 20 ms |
| 1 | 15% : 30% | < 20 ms |
| 1 | 15% : 30% | 20 < 100 ms |
That means only one dip is out of standard. In general , mitigation is carried out by installing power conditioners or voltage regulators. The power conditioner typically include voltage regulator , surge protective device and shield insolation transformer.
2 – Case studies Te(1) , Te(2) , Fo(1) , Fo(2) , Ch(3)
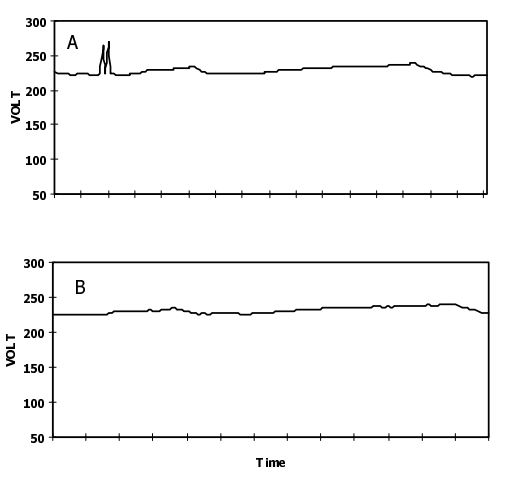
The voltage surges ( swells ) are caused by switching off a large load ( sudden load decrease ) . In Te(1) , Te(2) , Fo(1) , Fo(2) , Ch(3) the measured voltage surges are almost between 5% and 10% in less than 20 ms . For the above mentioned cases the remedy was done by adjusting the tap changer of the distribution transformer. A few number of voltage surges are greater than 10% in less than 20 ms. In Te(2) voltage surge suppressor was installed at one subbranch . Fig.(2) represents the voltage profile before and after installing the surge suppressor.
3 – Case study Ch ( 1 )
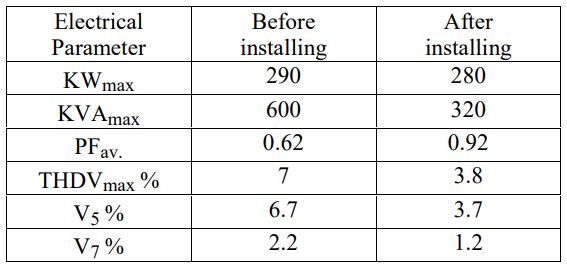
The Ch (1) firm has very sensitive electric equipments to power variation . The firm includes PC computers , large lazer printers , central air conditioners and telephone switching equipment. The full line of uninterruptible power system ( UPS ) and its power management software was installed to protect sensitive electronic equipment against power problems even in the most critical circumstances. This U36 SURWHFWV against all power problems failure, dip, transient , harmonic , and flicker ,
It’s specification is:
rating : 40kw
input voltage : 380 ± 20%
output voltage tolerance : ± 1%
Fig ( 3 ) shows the electrical parameter profiles before and after installing UPS . It is a good result , and the power became clean that can be key to successful operation
4 – Case study Te ( 2 )
When customers introduce harmonics into the power system, they can cause power quality problems for themselves and for other neighboring customers. Tuned filter is available to isolate problem area and to mitigate the effects of harmonics. Table (7) compromise between the electrical parameters before and after installing the filter.
Table (7) case study Te (2) before and after installing filter
5 – Case studies Me (2), Me (3), Ma (1), Ma (2) :
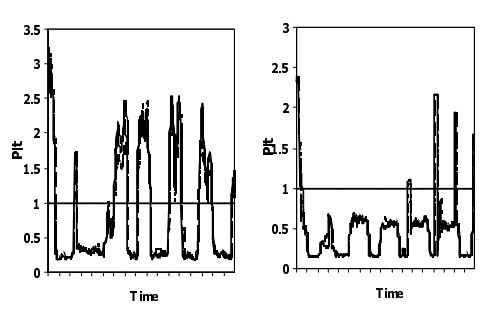
Flicker is a small amplitude change on voltage levels occurring at frequencies less than 25 HZ . Voltage dips and surges can cause light flicker . A voltage dip of 0.25 to 0.5% will cause a voltage flicker [ 3 ] .
It is a problem produced by industrial end – users that mostly affects residential and commercial end – users . to overcome flicker problems caused by it, it is necessary to install control equipment like static VAR system, that is generally expensive.
Fig ( 4 ) shows the long term flicker ( Plt ) profiles for Me ( 3 ) and Ma ( 2 ) as example .
Conclusion
Power quality is very important to operation of production processes. Power quality disturbances are often complicated due to interaction between various electrical equipment and systems both inside and outside different facilities.
Knowing the reasons of these disturbances is the way to the prevention of quality deterioration. There is a variety of ways to provide the needed power quality level, and the simplest and most economical method should be selected. The first and most common step in diagnosing quality disturbance is to begin having operation personal disturbance Logs. It will point directly to the problem or at least close to the possibilities . Then the monitoring can be focused and an effective troubleshooting strategies can be developed Therefore the analysis and solution will be carried out . The paper overviews analysis of real time industrial power quality disturbances. Recently , AEC is going ahead to extensive survey for power quality disturbances for large number of customers.
Also , AEC is awaring the new customers by this fact: “THE MOST EFFECTIVE AND SUCCESSFUL METHOD OF PREVENTATION QUALITY DISTURBANCES IS TO ANTICIPATE AND ELEMENAT THE PROBLEMS DURING DESIGN , CONSTRUCTION AND INSTALLATION “ and assist them to achieve that.

References :
[1] IEEE Guide For Safety in AC substation Grounding ANSI / IEEE Std 80-1986 .
[2] Effects of voltage sags in process industry applications . http:// http://www.pgnet.electrotek.com/
[3] Range of objectionable voltage flicker http:// http://www.burbank-utilities.com/
Source URL: http://www.cired.net/publications/cired2001/2_28.pdf
