Published by Electrotek Concepts, Inc., PQSoft Case Study: Distribution Feeder Voltage Sag Evaluation, Document ID: PQS0905, Date: October 15, 2009.
Abstract: This case study shows the results for simulations completed to evaluate the impact of a distribution feeder fault on the operation of a customer adjustable-speed drive during the resulting voltage sag and momentary interruption. The simulations for the case were completed using the PSCAD program. A voltage swell on the feeder primary is also illustrated. The potential solution of increasing the dc link capacitance for the adjustable-speed drive was shown to be effective for the simulated conditions.
INTRODUCTION
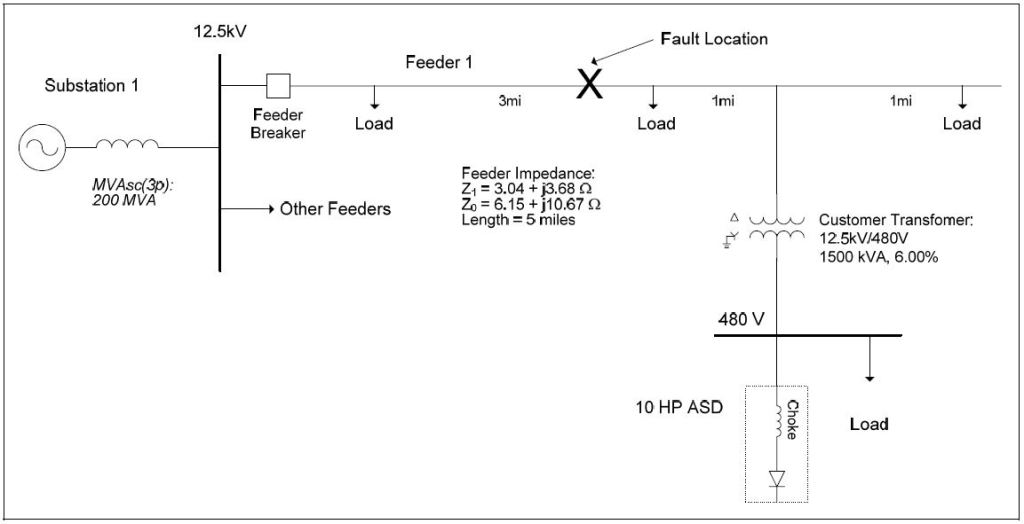
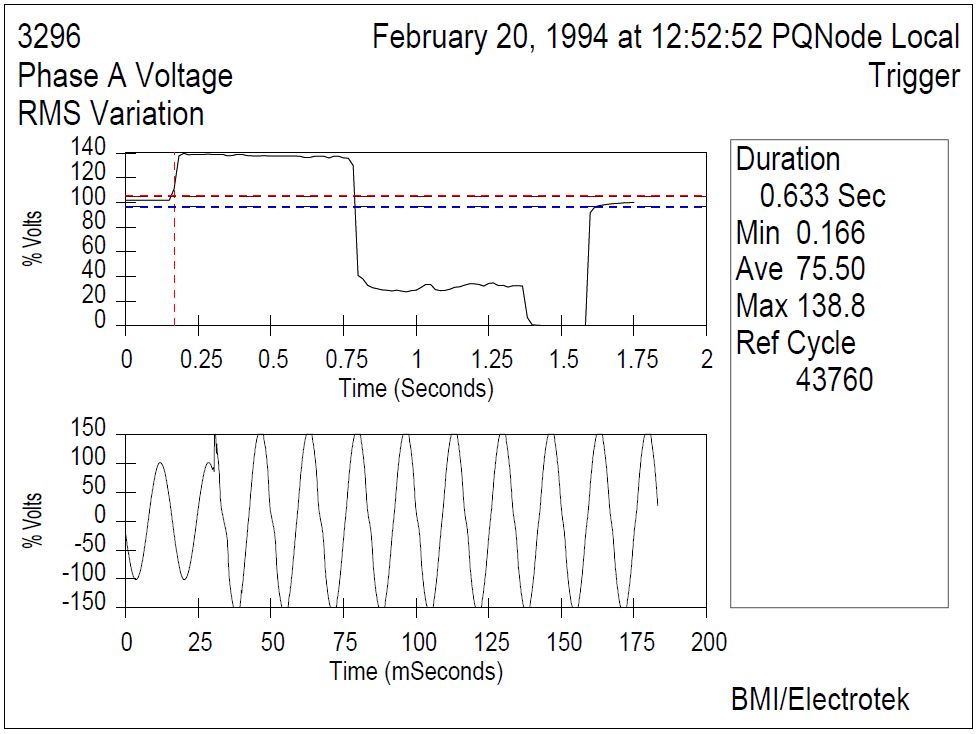
A distribution feeder voltage sag evaluation was completed for the system shown in Figure 1. The simulations for the case study were completed using the PSCAD program. The case involved simulating a voltage swell/sag/interruption event during a fault on the 12.5kV distribution feeder and then determining the dc link voltage for a typical customer adjustable-speed drive. An example of a representative measured voltage waveform is shown in Figure 2.
The accuracy of the simulation model was verified using three-phase and single-line-to-ground fault currents and other steady-state quantities, such as feeder and customer load currents. The circuit modeled for the case involved a 5-mile, 12.5kV distribution feeder supplying a 1500 kVA customer step-down transformer (12.4kV/480V).
The waveform shown in Figure 2 illustrates a voltage swell, a voltage sag, and an interruption. A voltage swell is an increase in rms voltage magnitude above 1.1 per-unit for a duration of 0.5 cycles to 1 minute. Voltage swells are much less common than voltage sags and the magnitudes are not usually severe.
The most common cause of a voltage swell is a single-line-to-ground fault. During a single-line-to-ground fault, the voltage magnitude on the unfaulted phases can increase due to the zero sequence impedance. On an ungrounded system, the voltage on the unfaulted phases can be as high as 1.73 per-unit. On most systems, the voltage swell is less than 1.40 per-unit.
The simulated event began as a single-line-to-ground fault for 4 cycles and then evolved into a phase-to-phase fault for an additional 3 cycles. The feeder circuit breaker opened after approximately 11 cycles and reclosed after a 4-cycle delay. These switching times were selected to approximate the characteristics from the measured waveform. During the single-phase fault, a voltage swell occurs on the other two healthy phases. A voltage sag occurred during the phase-to-phase fault and a momentary interruption occurred while the circuit breaker was open.
In addition to the voltage swell and voltage sag event on the distribution feeder primary, a customer transformer was modeled so the voltage on the 480-volt bus could be determined. A typical 10 hp adjustable-speed drive was included in the simulation model to determine the potential for nuisance tripping of the drive due to an undervoltage on the drive’s dc link. The oneline for the drive model is shown in Figure 3.
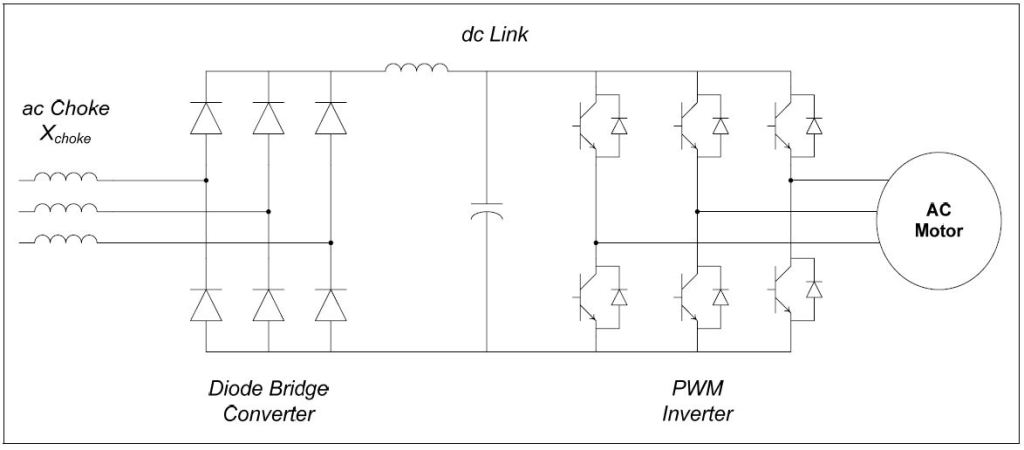
Voltage sags cause a decrease in the dc link voltage for an adjustable-speed drive. The drive will likely trip off-line if the voltage falls below the dc link trip voltage. During short duration voltage sags, it may be possible to support the dc link voltage using a larger dc link capacitor. The drive may also experience high inrush currents when the voltage is restored.
SIMULATION RESULTS
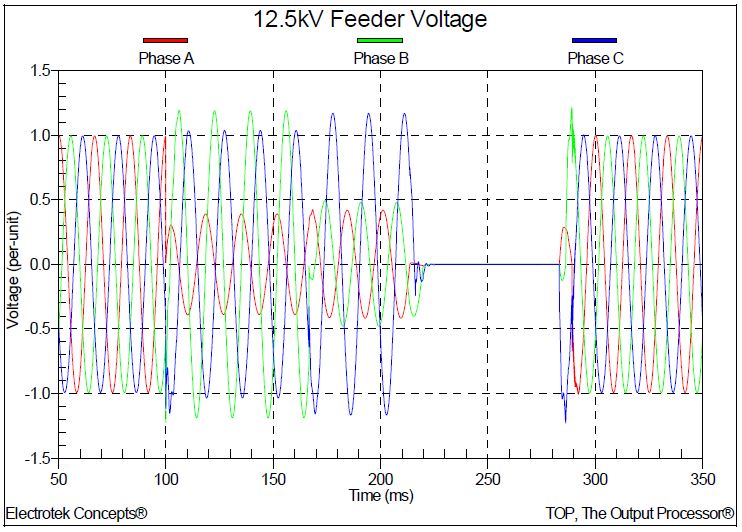
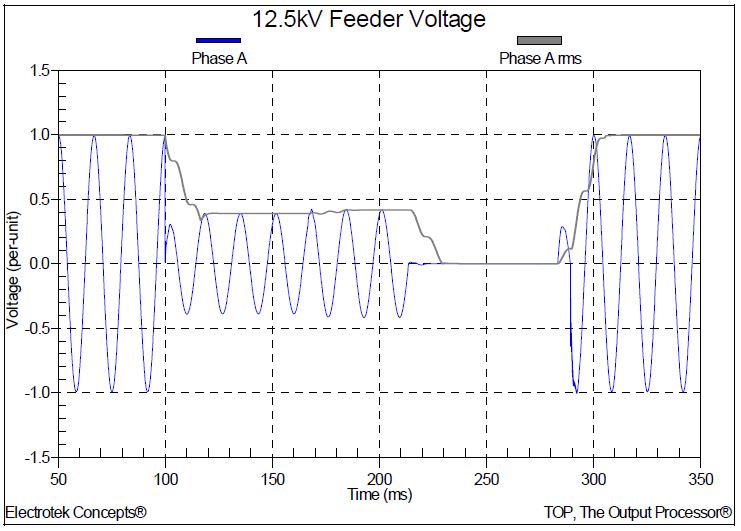
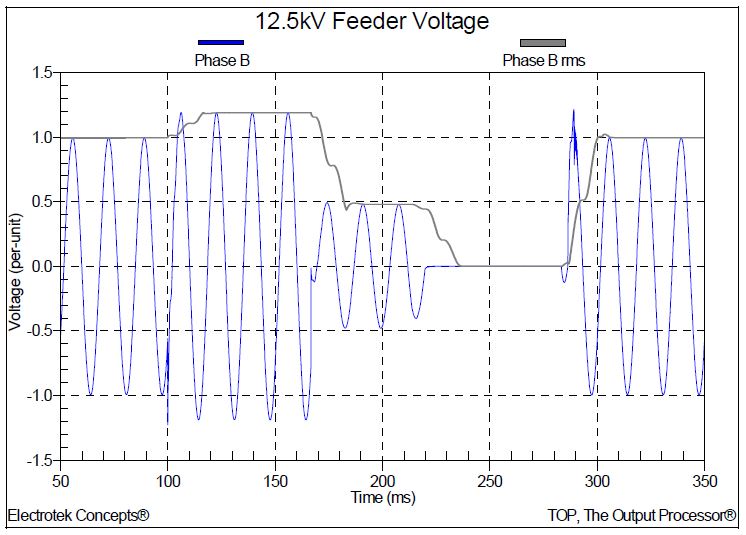
The simulated three-phase 12.5kV distribution feeder voltage is shown in Figure 4. The voltage swell, voltage sag, and momentary interruption are all contained in the one figure. The rms voltages for phases A and B are shown in Figure 5 and Figure 6, respectively. The rms voltage quantities were determined using a digital rms meter in the simulation program. The rms voltage characteristic of a voltage swell, followed by a voltage sag, followed by momentary interruption that was shown in Figure 2 is well represented with the simulation result shown in Figure 6.
The resulting three-phase 480-volt customer secondary bus voltage is shown in Figure 7. The 12.5kV/480V step-down customer transformer is connected delta/wye-ground. For a single-phase fault on the primary of a delta/wye-ground transformer, the secondary phase-to-ground voltages would be 0.58, 1.00, and 0.58 per-unit, respectively. This is illustrated in Figure 7 during the initial portion of the event.
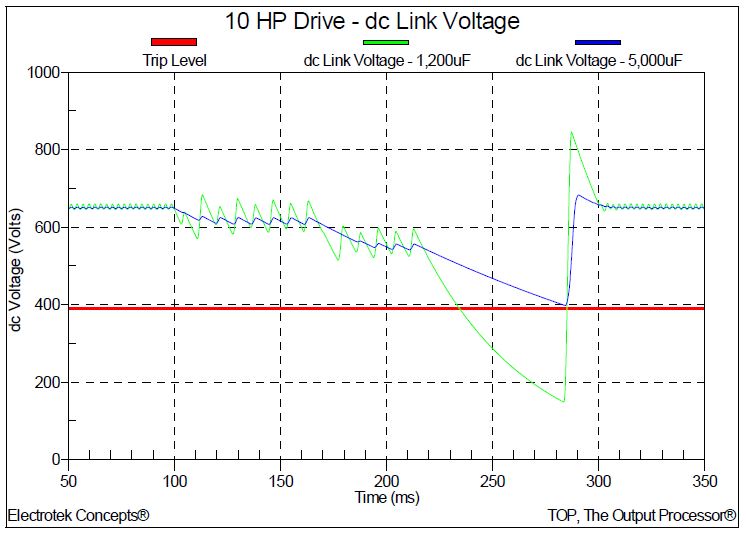
The resulting simulated dc link voltage for the typical 10 hp adjustable-speed drive is shown in Figure 8. The magnitude of the dc link voltage decreases during the voltage sag and momentary interruption. For this case, it was assumed that the dc bus low voltage trip voltage was 390 volts, which is 60% of the nominal 650-volt value.
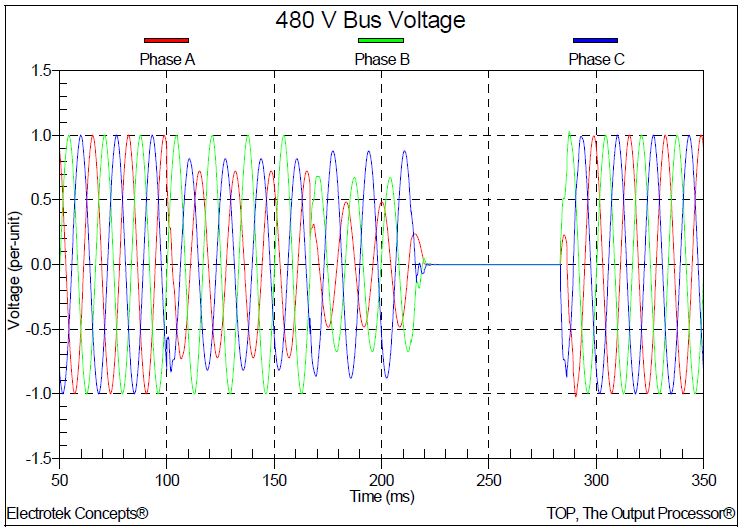

Figure 9 shows the simulation results for the case of increasing the dc link capacitance from 1,200μF to 5,000μF. The resulting simulated dc link voltage is slightly above the assumed undervoltage trip level so the drive does not trip for this condition.
SUMMARY AND CONCLUSIONS
This case study shows the results for simulations completed to evaluate the impact of a distribution feeder fault on the operation of a customer adjustable-speed drive during the resulting voltage sag and momentary interruption. A voltage swell on the feeder primary is also illustrated. The potential solution of increasing the dc link capacitance for the adjustable-speed drive was shown to be effective for the simulated conditions.
REFERENCES
- IEEE Std. 1159-1995, IEEE Recommended Practice on Monitoring Electrical Power Quality, ISBN 1-5593-7549-3.
- IEEE Std. 1159.3-2003, IEEE Recommended Practice for the Transfer of Power Quality Data, ISBN 0-7381-3578-X.
- TOP, The Output Processor®, Electrotek Concepts, Inc., http://www.pqsoft.com/top/
RELATED STANDARDS
IEEE Std. 1159.3, IEEE Std. 1159
GLOSSARY AND ACRONYMS
ASD: Adjustable Speed Drive
UPS: Uninterruptible Power Supply
PSCAD: Power Systems Computer Aided Design
