Published by Electrotek Concepts, Inc., PQSoft Case Study: Power Factor Correction, Document ID: PQS0312, Date: April 16, 2003.
Abstract: Low power factor because it means that you are using the facility’s electrical system inefficiently. It can also cause equipment overloads, low voltage conditions, and greater line losses. Most importantly, low power factor can increase total demand charges and cost per kWh, resulting in higher monthly electric bills. This document provides an overview of the concept of power factor, including impacts on the electrical distribution system, effects on power quality, benefits of improvements, and estimating financial savings.
This case presents the applications of low voltage power factor correction capacitors to improve poor power factor.
PROBLEM STATEMENT
A large plastics plant is paying a significant power factor penalty each month. The utility has informed the plant that correcting the overall plant power factor to 95% will eliminate the penalty.
A summary of previous utility bills is provided in Table 1.
| Month | kVA | kW | kVAr | Power Factor |
|---|---|---|---|---|
| Feb 1991 | 5880 | 4080 | 4234 | 0.694 |
| Mar 1991 | 5700 | 3900 | 4157 | 0.684 |
| etc. | ||||
| Dec 1991 | 6120 | 4200 | 4451 | 0.686 |
| etc. | ||||
| Average | 6079 | 4185 | 4408 | 0.689 |
PRINCIPLES OF POWER FACTOR CORRECTION
Why Improve the Power Factor
The application of power factor correction capacitors is generally motivated by the desire to save money. Most often, this is a direct response to utility power factor penalties. However, there are several other reasons that a customer might decide to apply power factor correction capacitors.
- Reduce electric utility bill
- Release system capacity
- Reduce current, (allowing additional load to be served)
- Reduce I2R losses
- Voltage control
While power factor correction alone is not a harmonic concern, it is nevertheless important to understand the relationship between capacitors and harmonic related problems.
Location for Power Factor Correction Capacitors
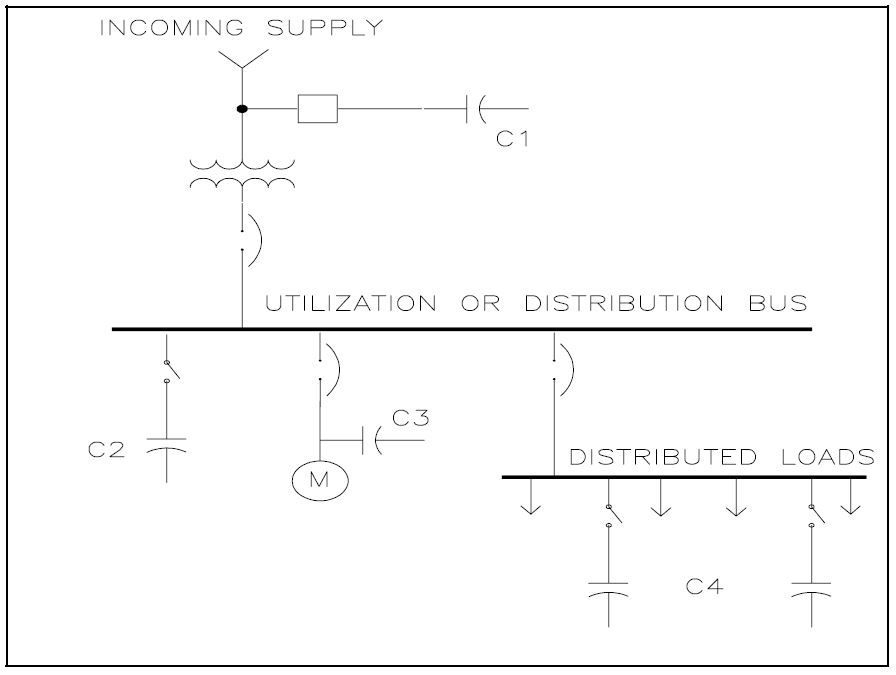
The benefits realized by installing power factor correction capacitors include the reduction of reactive power flow on the system. Therefore, for best results, power factor correction should be located as close to the load as possible. However, this may not be the most economical solution or event the best engineering solution, due to the interaction of harmonics and capacitors. Refer to Figure 1 for a oneline representation of possible placement options for power factor correction capacitors.
Often capacitors will be installed with large induction motors (C3). This allows the capacitor and motor to be switched as a unit. Large plants with extensive distribution systems often install capacitors at the primary voltage bus (C1) when utility billing encourages power factor correction. Many times however, power factor correction and harmonic distortion reduction must be accomplished with the same equipment. Location of larger harmonic filters on the distribution bus (C2) provides the required compensation and a low impedance path for harmonic currents to flow.
Evaluating the Effectiveness of a Capacitor Application
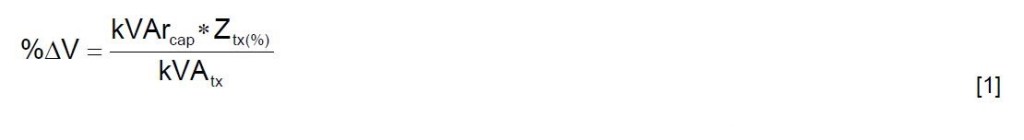
Several simple equations can be used to determine the effectiveness of power factor correction. The voltage improvement realized with the installation of capacitors is determined from:
where:
%ΔV = voltage rise (percent)
kVArcap = capacitor bank rating (kVAr)
kVAtx = step-down transformer rating (kVA)
Ztx = step-down transformer impedance (percent)
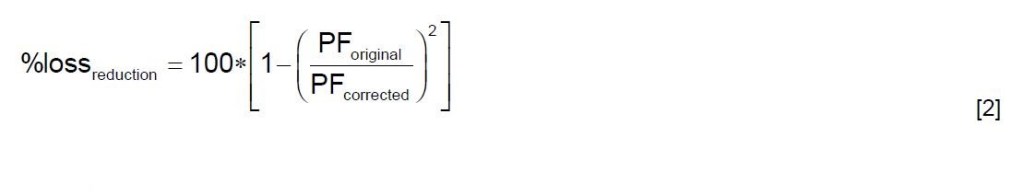
Although capacitors raise a circuit’s voltage, it is rarely economical to apply them in industrial plants for that reason alone. The reduction in power system losses is determined from:
where:
%lossreduction = reduction in losses (percent)
PForiginal = original power factor (per unit)
PFcorrected = corrected power factor (per unit)
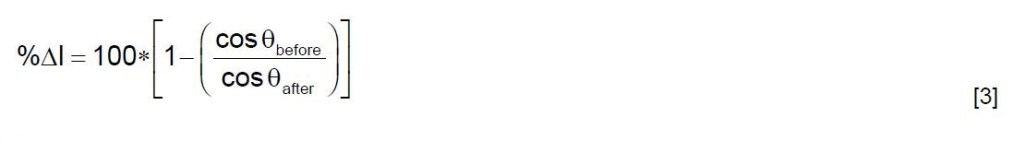
Financial return from conductor loss reduction alone is seldom sufficient to justify the installation of capacitors. It is an added benefit, especially in older plants with long distribution feeders. The optimum location of the power factor correction capacitors can be determined from a load flow analysis. However, it is important to remember that harmonic considerations are often more important than correction. Finally, the percent line current reduction can be approximated from:
where:
%ΔV = current reduction (percent)
θbefore = power factor angle before correction (degrees)
θafter = power factor angle after correction (degrees)
Displacement Power Factor vs. True Power Factor
The traditional method of power factor correction, both on the power system and within customer facilities has been the applications of shunt capacitor banks. This is based on the fact that most loads on the system draw a lagging current (partially inductive) at the fundamental frequency. Capacitors draw a leading current at the fundamental frequency and, therefore, can compensate for the current drawn by inductive loads (motors are the most important).
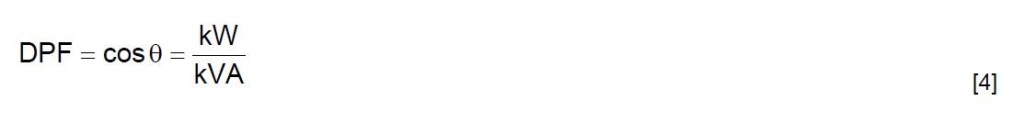
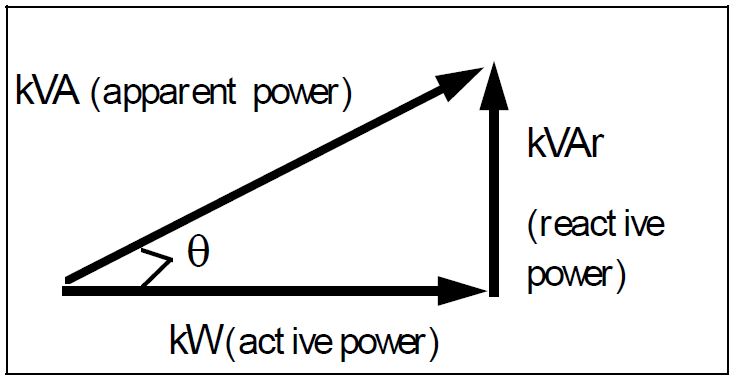
These characteristics of leading and lagging current are based on the assumption that loads on the system have linear voltage-current characteristics and that harmonic distortion of the voltage and current is not significant. With these assumptions, the power factor is equal to the displacement power factor (DPF). Calculation of the displacement power factor is completed using the traditional power factor triangle, and is summarized with the following relationship (shown in Figure 2):
Harmonic distortion in the voltage and/or current caused by nonlinear loads on the system changes the way power factor must be calculated. True power factor (TPF) is defined as the ratio of real power to the total volt-amperes in the circuit.
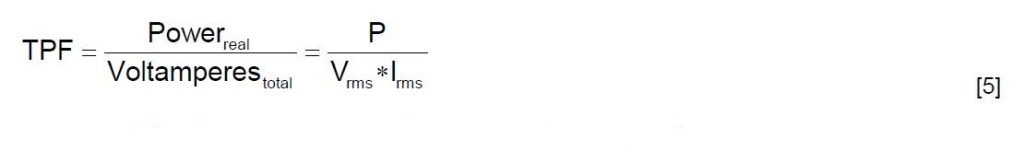
This is a measure of the efficiency with which the real power is being used. Since capacitors only provide reactive power (VArs) at the fundamental frequency, they cannot correct true power factor when there are harmonics present. In fact, capacitors can make true power factor worse by creating resonance conditions which magnify the harmonic distortion in the voltage and current.
Adjustable-speed drives (ASDs) using pulse-width modulation (PWM) technology are a particularly important example of the difference between true power factor and displacement power factor. These drives use a diode bridge rectifier to convert the ac power to dc. As a result, these drives have a displacement power factor very close to unity. However, the harmonic distortion of the input current can be very high. This low true power factor cannot be improved with capacitors. Harmonic filtering is the most common way of improving power factor for this type of load.
Displacement power factor is still very important to most industrial customers because utility billing for power factor penalties is almost universally based on displacement power factor. Metering used to measure power factor is based on VAr meters that are only responsive to the fundamental frequency components of the voltage and current. Therefore, utilities do not currently penalize customers for the inefficiencies introduced by harmonics in their loads.
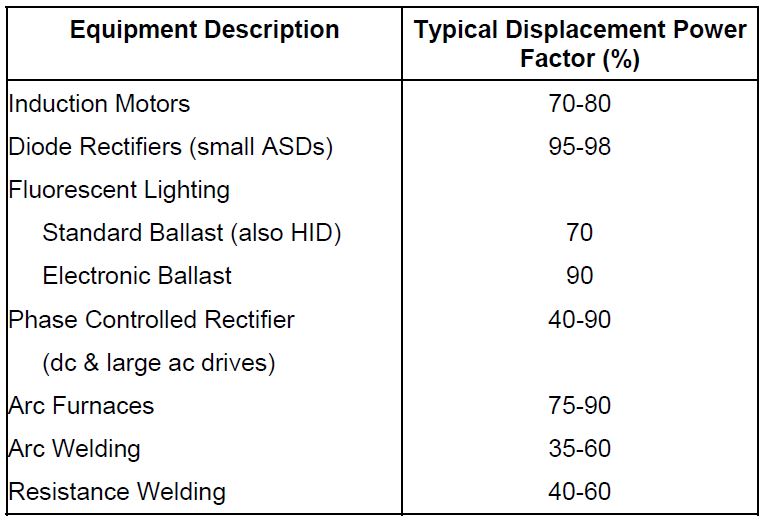
Typical Equipment Power Factors
The typical displacement power factor for individual equipment types is summarized in Table 2.
Motor Power Factor Correction Example
The following example illustrates the correction of a 500 HP induction motor with an assumed power factor of 85%. The customer desires correction to 95%. The assumption of HP = kVA is used to determine the following:
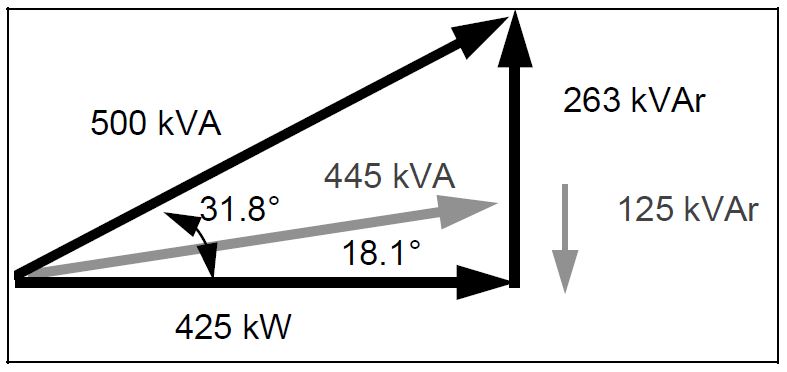
kVArrequired = (425) ∗ (tan31.8 – tan18.1) ≈ 125kVAr
where:
Original power factor angle = cos-1(0.85) = 31.8°
Desired power factor angle = cos-1(0.95) = 18.1°
Displacement vs. True Power Factor Example
The impact of harmonic distortion on power factor is illustrated using the PWM ASD current waveform shown in Figure 4.
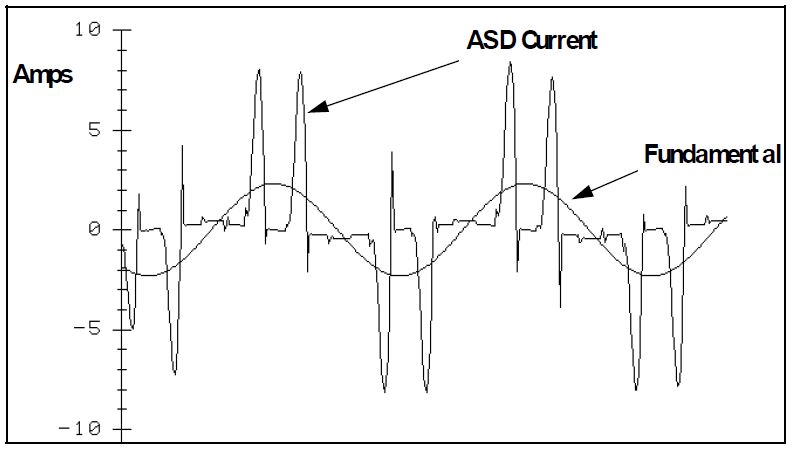
The rms current, for the drive waveform, is determined from the following equation:
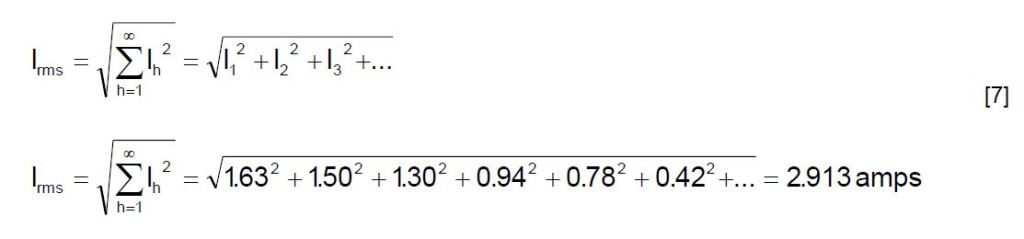
Note: Harmonic spectrum data obtained from Fast Fourier Transform (FFT) on measured waveform
The total harmonic distortion (THD), and crest factor (CF) for the current waveform are determined from:
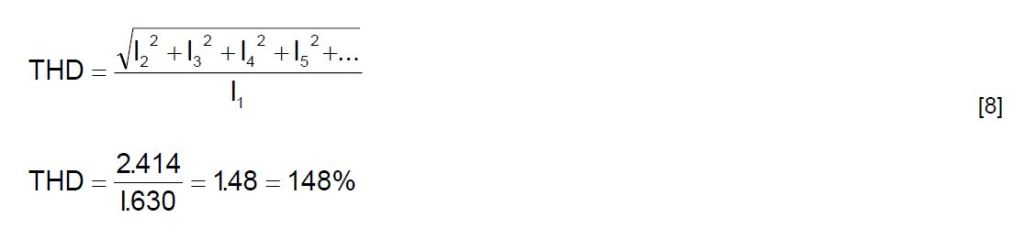
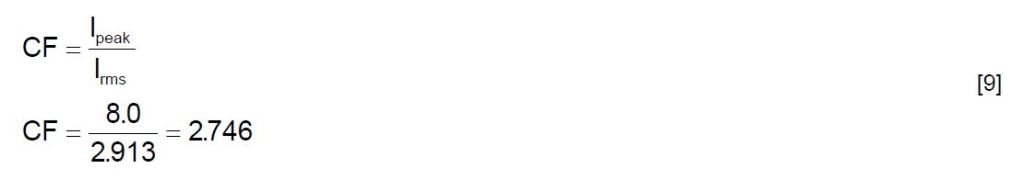
Note: Ipk obtained from measurement data.
Note: Crest Factor for a single-frequency sinusoidal wave (no distortion) is 1.412
For the drive current illustrated, it is assumed that the fundamental components of the current and voltage are in phase – displacement power factor = 100%. Actual values for waveforms of this type range from 95-98%. If we assume that the voltage distortion is negligible, the real power consumed is:
P = V1 ∗ I1 * cosθ = (480 V) (1.63 A) (1.0) = 782.4 W
The true power factor can then be determined from:
TPF = P / (Vrms ∗ Irms) = 782.4 W / (480 V * 2.913 A) = 0.56 = 56%
INDUSTRIAL PLANT POWER FACTOR CORRCTION
Recalling, from Table 1, the plant’s previous utility bills. The average power factor is corrected to 95% using the following method:
| Month | kVA | kW | kVAr | Power Factor |
|---|---|---|---|---|
| Feb 1991 | 5880 | 4080 | 4234 | 0.694 |
| Mar 1991 | 5700 | 3900 | 4157 | 0.684 |
| etc. | ||||
| Dec 1991 | 6120 | 4200 | 4451 | 0.686 |
| etc. | ||||
| Average | 6079 | 4185 | 4408 | 0.689 |
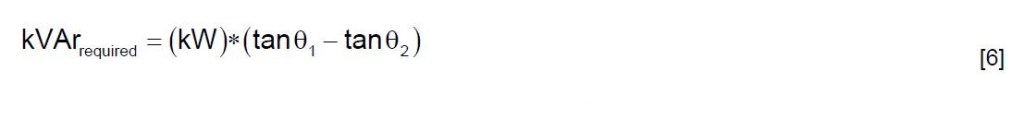
kVArrequired = (kW) ∗ (tanθ1 – tanθ2)
kVArrequired = (4185) ∗ (tan46.4 – tan18.1) ≈ 3000kVAr
where:
θ1 = cos-1 (4185 / 6079) = 46.4°
θ2 = cos-2 (0.95) = 18.1°
After the installation of 3000kVAr of power factor correction, the average load is:
Average kW: 4185kW
Average kVAr: 1408kVAr (4408-3000)
Average kVA 4416kVA
Average PF: 95.0%
SUMMARY
Power factor is a measurement of how efficiently a facility uses electrical energy. A high power factor means that electrical power is being utilized effectively, while a low power factor indicates poor utilization of electric power. Low power factor can cause equipment overloads, low voltage conditions, and greater line losses. Most importantly, low power factor can increase total demand charges and cost per kWh, resulting in higher monthly electric bills.
Low power factor is generally solved by adding power factor correction capacitors to a facility’s electrical distribution system. Power factor correction capacitors supply the necessary reactive portion of power (kVAr) for inductive devices. The principle benefit is lower monthly electric bills.
REFERENCES
IEEE Recommended Practice for Electric Power Distribution for Industrial Plants (IEEE Red Book, Std 141-1986), October 1986, IEEE, ISBN: 0471856878
IEEE Recommended Practice for Industrial and Commercial Power Systems Analysis (IEEE Brown Book, Std 399-1990), December 1990, IEEE, ISBN: 1559370440
IEEE Recommended Practice for Protection and Coordination of Industrial and Commercial Power Systems, March 1988, IEEE, ISBN: 0471853925
RELATED STANDARDS
IEEE Standard 1036-1992
GLOSSARY AND ACRONYMS
ASD: Adjustable-Speed Drive
CF: Crest Factor
DPF: Displacement Power Factor
PWM: Pulse Width Modulation
THD: Total Harmonic Distortion
TPF: True Power Factor
