Published by Terry Chandler, Director of Engineering, Power Quality Thailand LTD/Power Quality Inc., USA. January, 2001
E-mail: terryc@powerquality.org, terryc@powerquality.co.th
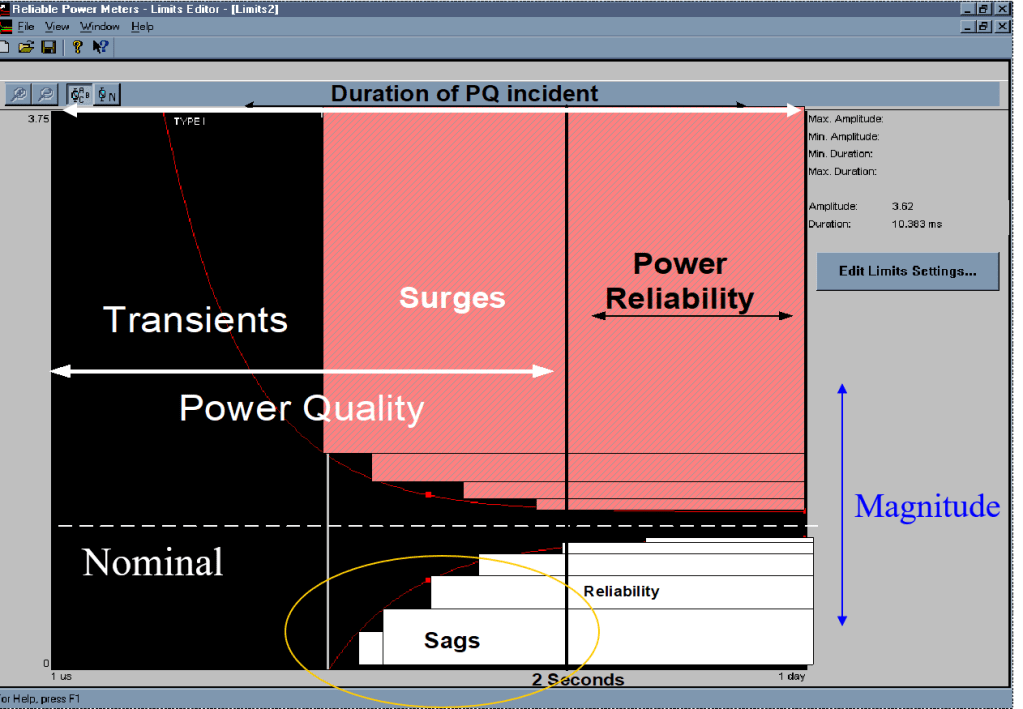
What is Power Quality?
- The characteristics of the supply voltage and the electrical system that affect the performance of the load.
- The characteristics of the load that affect the electrical system or other loads.
ITIC Curve

CBEMA Curve
Power Quality Parameters Utility Side
- RMS voltage, Sags and Surges
- Voltage transients (fast)
- Sinewave -waveshape
- Voltage imbalance
- Flicker
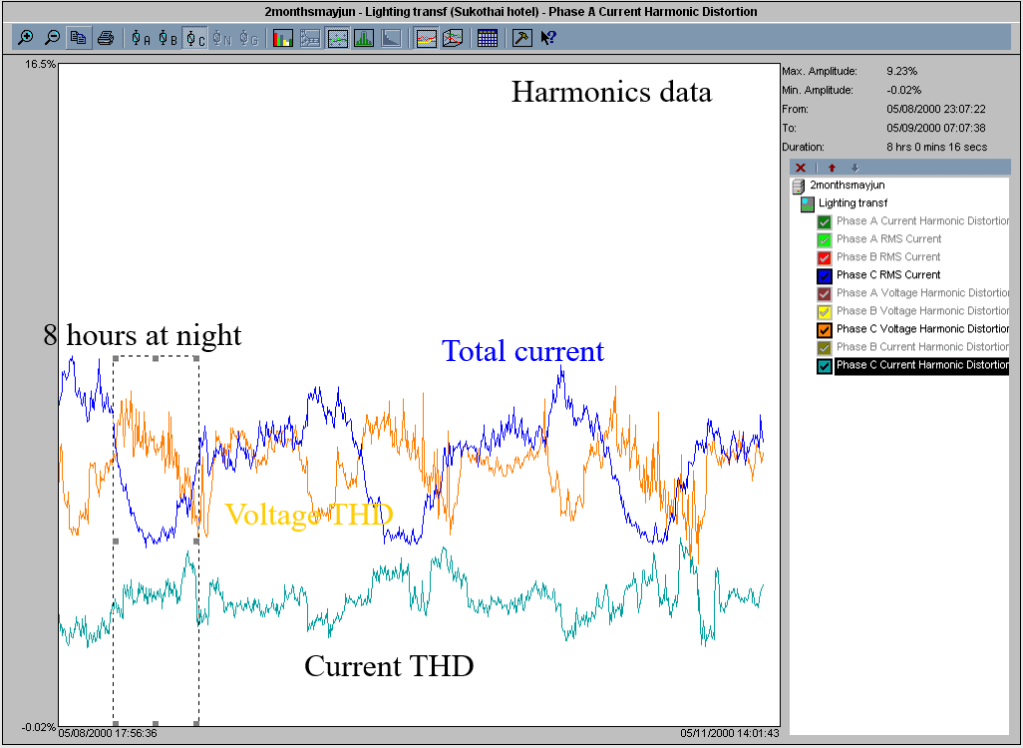
- Harmonics
Sag or Dip

Voltage Sag Utility

Power Quality Parameters User Side
- RMS voltage, Sag and surges local.
- Voltages transients
- Sinewave wave shape
- Voltage imbalance
- Flicker
- Electrical system design and construction.
- Grounding
- Harmonics
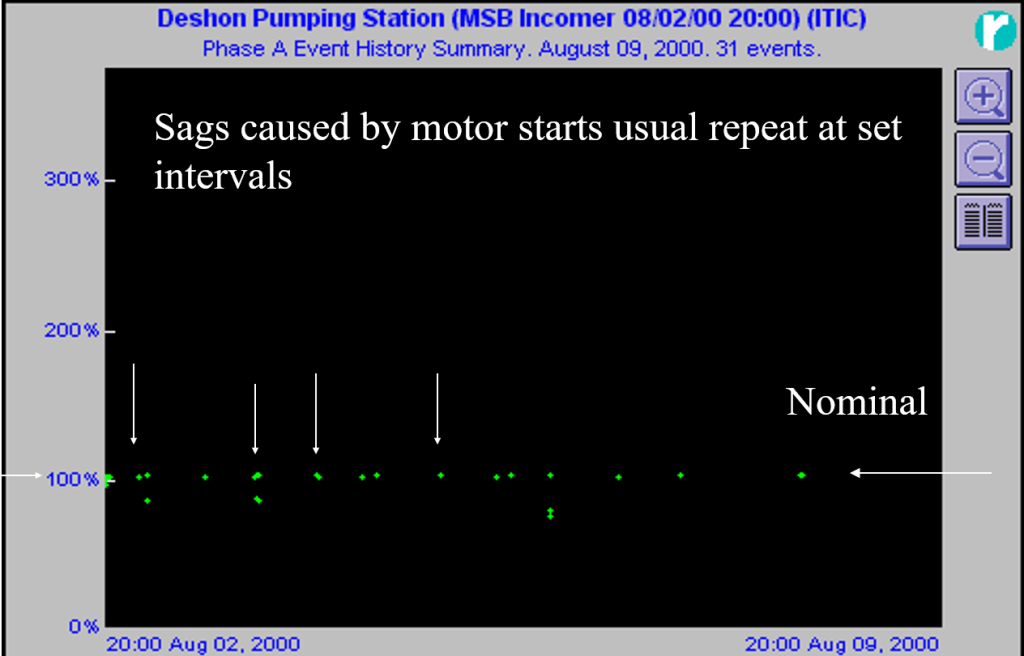
Sags Caused by Motor Starting
Welder Caused Sags

Fast Voltage Transients User
- Impulse .5 microseconds to less than .5 cycle
- Normal mode or Common mode
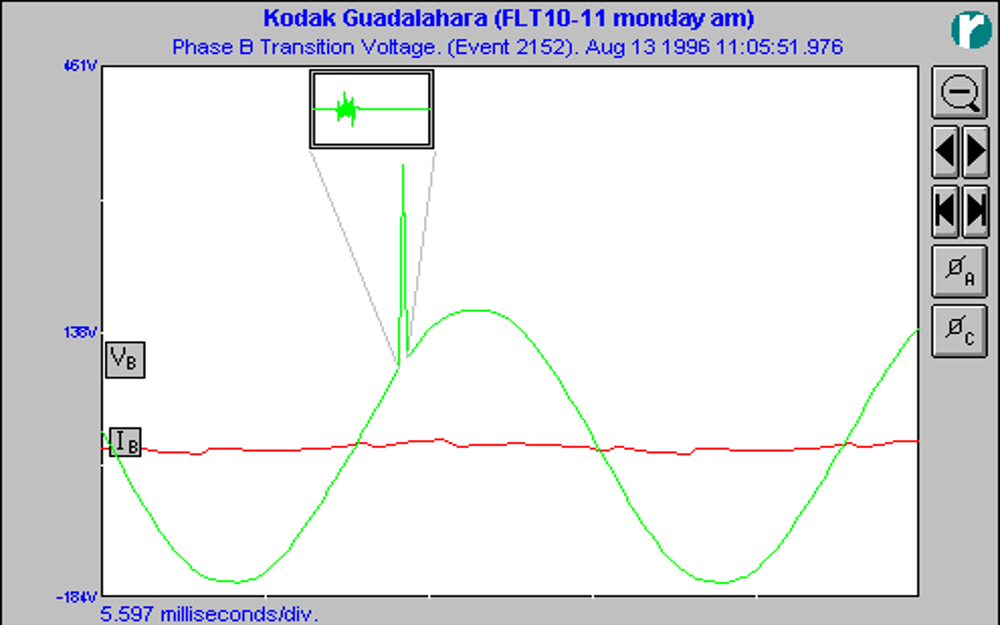
Fast Transient Detail
- Extremely fast Oscillatory

Wave shape incident (PF capacitor switching)

Voltage Sag and Surge User
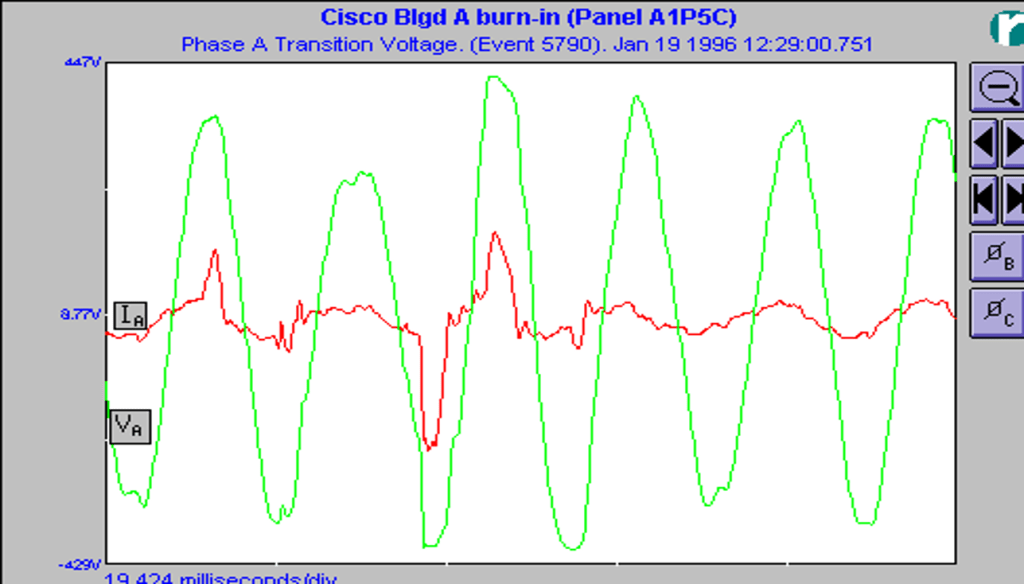
Voltage Common Mode Neutral to Ground

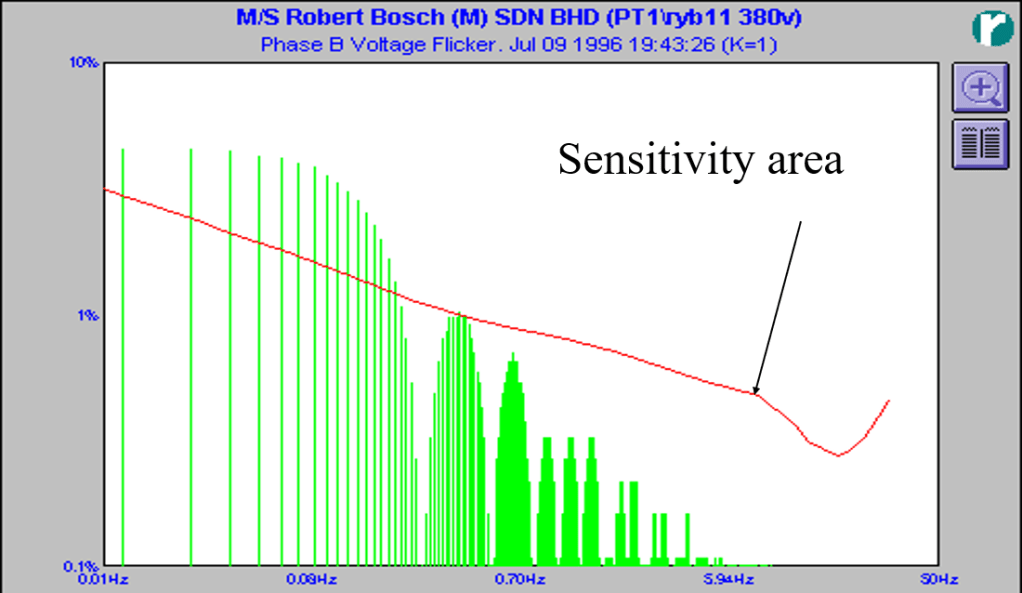
Flicker
- Voltage variation <25 Hz
Power Reliability vs Quality
- Power Reliability is the presence of voltage at the meter point.
- Power Quality is the value of the voltage (and other PQ parameters) as a percent of nominal at the meter.
Mr.Phil Sarikas , Intel Corporation 4/97
Source of the PQ Problem?
In PQI’s 20 + years of experience and data shows
- 90% of the PQ problems are on the customer side of the meter.
- 80% of the $ losses are caused by the 10% of the problems from the utility side of the meter.
- Majority of the problems from utility are voltage sags or short outages.
Sources of Power Quality Problems in Order of Frequency of Occurrence
- User loads (equipment interactions)
- User electrical system and grounding
- Weather related, lightning, wind, rain.
- Utility distribution
- Utility transmission
- Utility generation
Economics of Power Quality
The use of sensitive (electronic) equipment and controls increases the costs of typical power disturbances*
- 1970’s USA EST $10 million (interruptions)
- 1980’s USA EST $100 million
- 1990’s USA EST $ 1 billion (momentary)
- 2000’s Worldwide $10 billion (ALL)
- *EPRI estimates
Trends of PQ
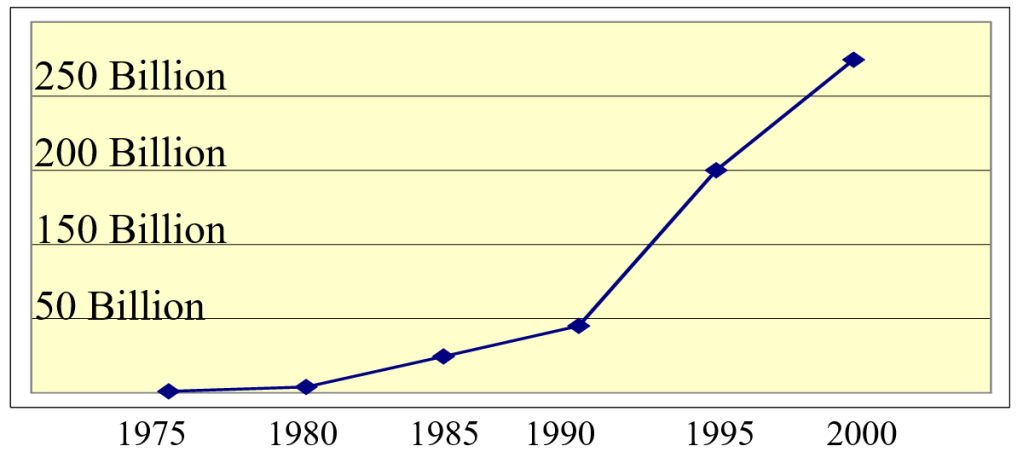
- Over $20 billion of power semiconductor products are installed annually.
- 30 percent of all power flows through power semiconductors now
- That will grow to 70 percent by 2010 (EPRI)
What Does That Mean?
The annual “cost of poor power quality” is $12 billion in US?
Semiconductor Sales
Losses to Industry, Estimates per event by EPRI.
Automotive $50,000 to $500,000
- Momentary interruptions stop production line.
- Costs $10million per year
Source: Electrical Power Research Institute
Losses in Semiconductor Manufacturing Wafer Fab
$250,000 and up per PQ event
- Texas Instrument , 1996 $312,000 cost,
– Loss revenue $1,000,000 - Intel , 1996 $500,000 to $1,000,000
– includes loss revenue cost. - 2000 2X (with 300 mm)Chemical industry
Chemical Industry
- $50,000 to $500,000
- In 1 year, Dupont saved $75M with PQ solutions.
- Risk of accident
- Risk of pollution
Source: Electrical Power Research Institute
Equipment Manufacturer
- Large compressor manufacturer
- $100,000 per event
- $1,700,000/year
- Latent defects that fail after deliver to the customer
Source: Electrical Power Research Institute
Table: 1993 Computer Losses in USA
| Cause | In millions of $ | # of reports |
| Theft | $1011 | 275,000 |
| Power Surge | $318 | 389,000 |
| Accidents | $246 | 276,000 |
| Misc. | #157 | 269,000 |
| Lightning | $86 | 91,000 |
Source: Safeware, The Insurance Agency
ISP Site Hosts
- Sites host computers/servers that host web pages
- Revenue can range from $1 to $10,000 per second
- Must have 99.9999999% reliability
Paper Manufacturer
- $30,000 2 second outage (Billington)
- Broken rolls
- Product quality issue
Source: Electrical Power Research Institute
Industry Losses 2001
- 13 Billion $ to 26 Billion $
- Frost and Sullivan 2001
- 114 million $ annual losses due voltage sags
Study by Sandia National Labs July 1998
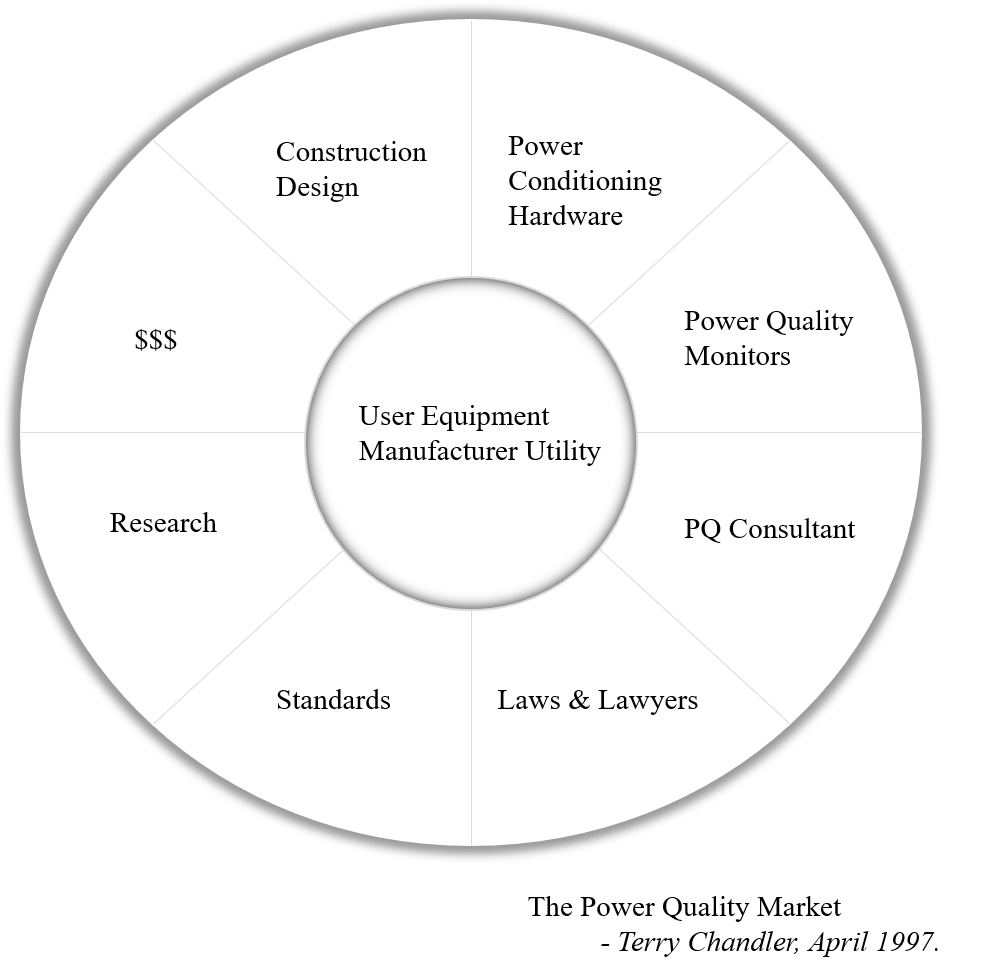
The Power Quality Market Place
What Determines the Acceptable Level of Power Quality?
- The load, as the technology of the loads change, the sensitivity to power quality changes.
- When studying PQ start with the requirements of the load.
The Increasing Cost of Power Quality Events
- Cost of Semiconductor fab 8 inch $1B, 1998.
- Semiconductor fab Y2K 12 inch ~ $3 Billion
- Continuous 7 x 24 operation
- Electronic controls replace electromechanical.
- Computing power moves from the computer room to the office and production floor.
Advances in Microelectronics
- 1970 2000 transistors per chip (.001joule)
- 1980 10,000 transistors per chip (.0001j)
- 1990 1,000,000 transistors per chip (.00001j)
- 2000 1,000,000,000 transistors per chip (.000,000,1 j)
(Approximate sensitivity level to disrupt)
Advances in AC to DC Power Supplies
- Power supplies advanced from linear transformer based to switch mode design.
- Voltage specification change
~ from +/-5% to 90V to 264V - Smaller, lighter
- Increase sensitivity to transients
- No common mode protection
Symptoms of Power Quality Problems
- Electronic controlled systems that stop unexpectedly
- Many system reboots required.
- Abnormal failure rate of electronic systems
- Transformers overheating
- Motors failing
- PF capacitors failing
What is the Typical PQ USA? (Voltage Sags from the Utility at USER level)
USA study 300 sites, 24 different utilities , 1993 to 1995, by EPRI.
- 6 million events (RMS sag of 10% or greater)
- 50 events >10% sag per year at typical site
- 20 events > 30% sag per year
- 4 power interruptions per year
Typical in Thailand?
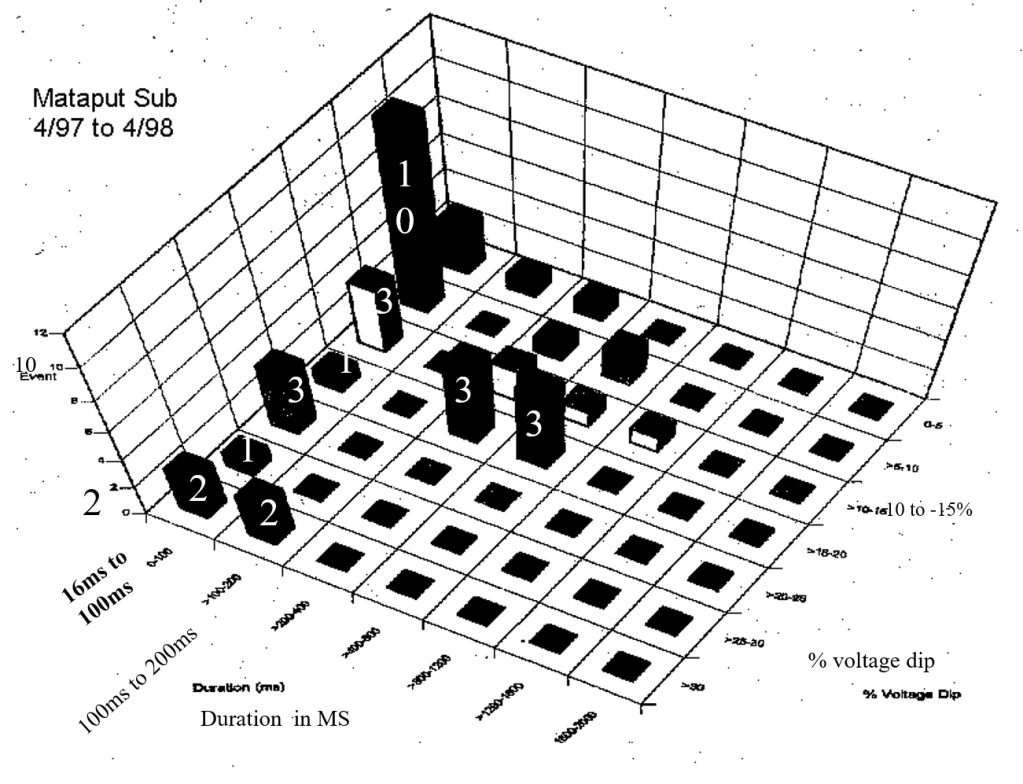
In Thailand Mataput Sub Typical
Sags
- 15 per year outside the “CBEMA Curve”
- 22 per year that probably affected sensitive electronic.
- 4 outages
Power Quality Malaysia (TNB)
At the transmission level 1-year 1998
- 132 kv 24 to 35 events
~ ave 97 ms, worst 1,292 milliseconds - 275 kv 11 to 19 events
~ ave 112 ms worst 485 milliseconds
The Challenge
If some industries need nine 9’s (99.9999999%)and other industries need four 9’s (99.99%) what should the utility plan to deliver to be the most cost effective power supplier?
Future
- Electrical system designs will focus more on the quality of power delivered to the load. The construction cost of retrofitting the electrical system is 2 to 5 times original build cost.
~ (PQI data shows, 50% + of PQ problems are related to the design and building of the electrical system)
Future II
- Equipment manufacturers will offer various levels of power quality acceptance at different price points.
- Utilities will offer various levels of Power Quality at different price points. Power Quality will be included in tariff structure.
- Critical nodes will be monitored or “PQ metered” continuously.
Future of the Power Quality
- The demands of increasing levels of PQ will continue until the electronic and process equipment designers recognize the need and implement design changes and their customers are willing to pay for them.
~ (New PQ standard for Semiconductor equipment)
Power Quality Inc.
- Distributor and Value-Added Reseller for Reliable Meters Inc in Asia.
- Power Quality training for utility engineers
- 20 + years’ experience in Power Quality
- PQ data analysis, site surveys, PQnetä
- Power Quality solutions at all levels
- Worldwide consulting on PQ problems
Please feel free to leave a question in the comments section or contact Terry Chandler, terryc@powerquality.org, terryc@powerquality.co.th
