Published by 1. Mahmood T. Alkhayyat1, 2. Mohammed Y. Suliman2, 3. Faisal Falah Aiwa3, Northern Technical University (1), (2), (3) Iraq
ORCID: 1. 0000-0001-6119-7845, 2. 0000-0002-1250-6362, 3. 0000-0003-1974-6614
Abstract. Power quality is mainly affected by any deviation in voltage, current, or frequency that results in damage, upset, or failure of end-use equipment. Non-linear loads like power electronics devices are the main causes of power quality problems. In this paper, we performed a comparison between DQ and PQ theory to control the shunt active power filter by using hysteresis and PWM techniques at different non-linear loads (controlled and uncontrolled rectifiers) in terms of the amount of improvement in the THD, power quality, and switching losses. The MATLAB / Simulink was used as a simulation tool to obtain a result for this paper.
Streszczenie. Na jakość energii wpływają głównie wszelkie odchylenia napięcia, prądu lub częstotliwości, które powodują uszkodzenie, niesprawność lub awarię sprzętu końcowego. Obciążenia nieliniowe, takie jak urządzenia energoelektroniczne, są głównymi przyczynami problemów z jakością energii. W artykule porównaliśmy teorię DQ i PQ w celu sterowania bocznikowym filtrem mocy czynnej za pomocą technik histerezy i PWM przy różnych obciążeniach nieliniowych (prostowniki sterowane i niesterowane) pod względem stopnia poprawy THD, jakości napięcia i strat przełączania. MATLAB / Simulink został wykorzystany jako narzędzie symulacyjne do uzyskania wyniku dla tego artykułu. (Bocznikowy aktywny filtr mocy oparty na PQ i DQ z technikami PWM i histerezy)
Keywords: shunt active power filter (SAPF), total harmonic distortion(THD), power quality, PQ and DQ theory.
Słowa kluczowe: filtr bocznikowy, jakość energii, obciążenia nieliniowe.
Introduction
In electrical power systems, power quality problems are becoming the main concern of power system engineers today. The main cause of degradation of power quality is harmonics, called harmonic distortion (HD). In an electrical distribution system, HD can be measured by using equation (1).
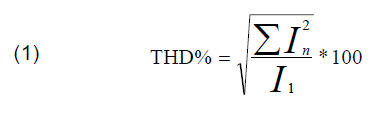
where: I is the electrical current, and n is the harmonic order (2, 3, 4, 5,…)
THD is increasing day to day due to the widespread use of non-linear loads [1]. Such as uncontrolled and controlled bridge rectifiers, phase-controlled converters, speed-controlled motor drives, televisions, led lamps, personal desktops, and uninterruptible power supplies(UPSs) [2]. These harmonics have some effects like reduction in a power factor, decrease in efficiency, power system voltage fluctuations, communications interference, circuit breaker malfunction, equipment heating, and breakdown and harm. Therefore harmonics can be considered as a pollutant that pollutes the entire power system [3]. Traditionally passive filters are used to reduce harmonics, but these filters have problems and disadvantages such as large size and weight, higher cost, fixed compensation, and resonance problems with loads. Therefore the electrical power system has required an emphasis on a power electronic solution, that is, active power filters (APF) [4].
APF is a very suitable solution for power quality problems for its smaller physical size and flexibility. Also, it is slightly lower in cost and operating loss compared to passive filter [5]. These filters eliminate voltage and current harmonics by improving the power factor and cancel out the negative and zero sequence components. APFs can be classified depending on inverter type voltage source (VSI) and current source(CSI) active filters. VSI active power filter is a favorite type because of its high efficiency, low cost, and lightweight [6]. APFs are also classified depending on the connection type into four kinds, shunt, series, hybrid, and universal [7].
Shunt active power filters (SAPF) shown in Fig. 1 based on voltage source inverter are proper solutions to reduce the current harmonics and improve power quality. The backbone of this filter is to utilize the power electronics technique to generate compensation currents components that eliminate the current harmonic components that result from non-linear load [8].

Many research works are conducted to improve the power quality depending on THD in the literature. The authors in [9] presented SAPF based on (dq0) detecting method with pulse width modulation (PWM) current control technique; to improve the power quality by reactive power compensation and harmonic filtering. The THD obtained from the source current was 2.35 %. The authors in [10] presented SAPF based on (PQ) theory with hysteresis current control technique. They reduced the THD of the source current from 25.24% to 0.81%. The research work in [11] used the SAPF based (PQ) theory to harmonic eliminator deals with the compensation of odd harmonics, reduces the THD, and improves the power quality. Simulation results show that the THD of the source current reduced from 26.5% to 3.6%.
Most of the previous methods did not address comparison between (PQ) and (DQ) method depending on PWM and hysteresis current control technique. Also, the effect of SAPF on different non-linear load current (controlled and uncontrolled rectifiers).
In this paper four control techniques are presented, (PQ) and (DQ) with hysteresis and PWM current control techniques to generate compensation current in the power system to mitigation the source current harmonics resultant from the non-linear load (controlled and uncontrolled rectifier) and improve the power quality by reducing the THD.
Shunt active power filter design
A. SAPF based on (PQ) theory
In this technique, the reference currents are estimated based on the active and reactive power components. Also, the reference current is used to generate the compensating current by switching the inverter [12]. This theory depends on a transformation from a stationary reference system in a-b- c coordinates to an α-β coordinates system [13].
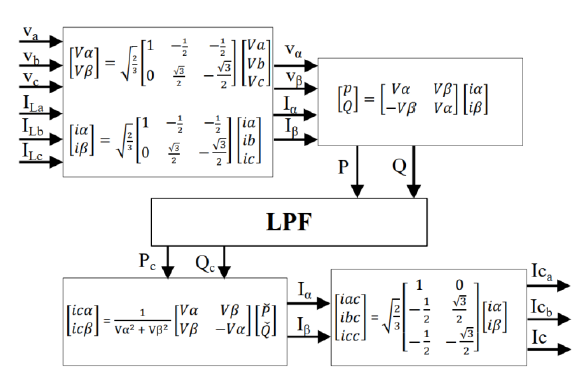
The three-phase system voltages and three-phase load current in the a-b-c coordinates are transforming to the α-β coordinates by using the Clarke transformations [14] as follows:

Then, calculate the value of instantaneous active and reactive power for the three-phase system as follows [15]:
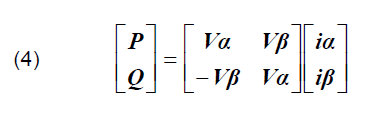
where: P is the instantaneous real power, Q is the instantaneous reactive power.
Observing equation (4), the P and Q can be put in the following form:

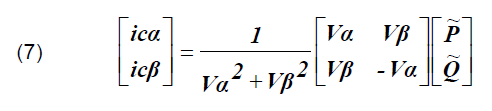
where: P̅ – is the DC part of P, and related to fundamental active current conventional, P̃ – is the AC part of P, and related with harmonic caused by the AC component of instantaneous real power. Also, Q̅ – is the DC part of Q, and related to the reactive power generated by the components fundamental currents and voltages, Q ̃ – is the AC part of Q, and related to harmonic currents caused by the AC components instantaneous reactive power.
The low pass filter was used to extract the oscillating parts of the real and reactive power. The compensated currents in α-β coordinates are calculated as follows:
Finally, these currents are transformed from α-β coordinates to the a-b-c coordinates as follows:

Then the three-phase compensation current is used as a reference signal for the SAPF controller. Fig. 2, shows the PQ theory block diagram [16].
B. SAPF based on (DQ) theory
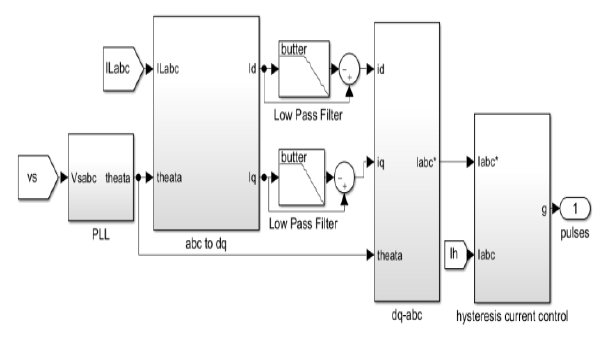
In this technique, the reference current is found based on the instantaneous active and reactive current components id & iq of the non-linear load.
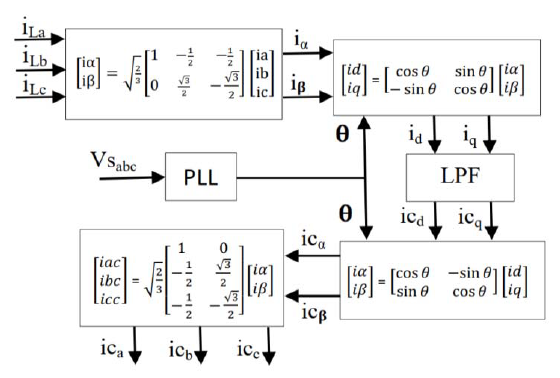
These reference currents are used to generate the switching state of the inverter. Clarke and park transformation is used to transform the non-linear load current from a-b-c coordinates to α-β coordinates, then the transformation to d-q coordinates as shown in Fig. 3, [17].
These transformations are defined by equations as follows:
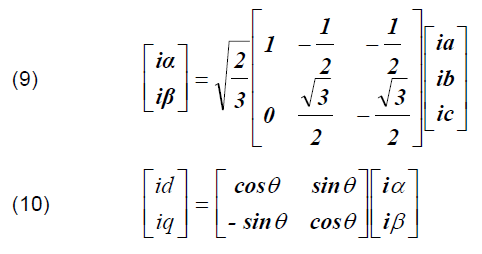
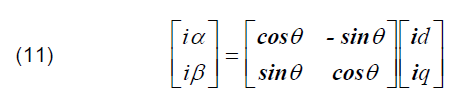
The Phase-Locked Loop (PLL) is used to obtain the phase angle (θ) and frequency of source voltage for the d-q transformation [18]. The d-q rotating reference frame is used to obtain the fundamental and harmonic currents. The resultant current is transformed to the DC component, while a harmonic component is transformed to the AC component. Thus, the AC components can be filtered out by a low-pass filter (LPF). Then, inverse transformation is used to transform the currents from two-phase synchronous frame d-q into two-phase stationary frame α-β as follows:
Lastly, transformation backs the currents from the two-phase stationary frame α-β to the three-phase stationary frame a-b-c and obtains the compensation reference currents ica, icb, and icc as follows.
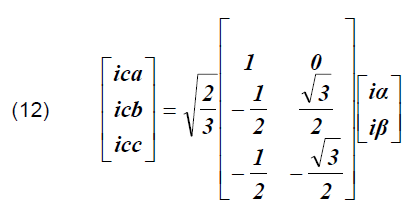
Fig. 4, shows the DQ theory of shunt active power filter(SAPF).
SAPF control techniques
The target of active power filter control is to generate suitable gate drive signals to switch MOSFETs based on estimated compensation reference signals. The performance of active power filters is affected significantly by the choice of control techniques [19]. The choice of the control technique is very important for getting high filter performance [20]. There are many kinds of control techniques, such as PI control, sinusoidal PWM, and hysteresis control [21]. In this work, two techniques are presented:
A. Hysteresis current control technique
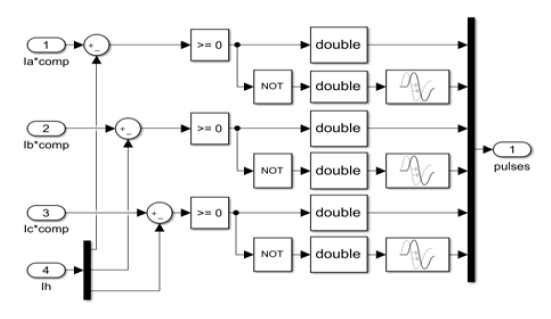
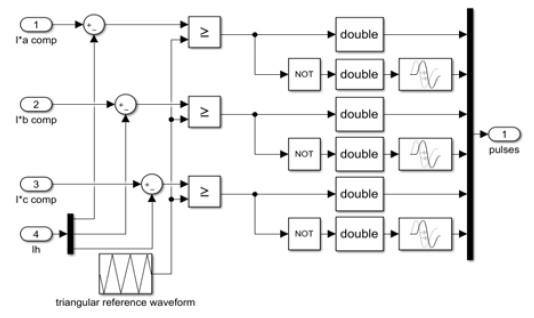
The switching signals of the active power filter switches are generated by comparing the compensation currents with feedback inverter currents [22], as shown in Fig. 5.
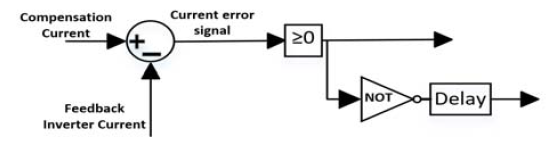
This controller is designed for three-phase. The switching logic for each phase is developed as follows, in case of the controlled current error signal is greater than or equal to zero, the upper switch of the inverter arm is turned on, while the lower switch is turned off. As a result, the current starts to flow. If the controlled current error signal is smaller than zero, the lower switch is turned on, and the upper switch is turned off. As a result, the electric current decays [23].
B. Pulse Width Modulation (PWM) current control technique
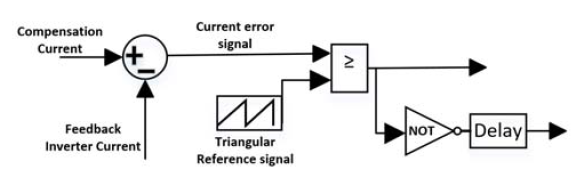
Switching signals to drive the MOSFETs of the inverter are generated by comparing the controlled current error signal with a triangular reference waveform. The reference signal must be selected such that, the current signal is continuously kept within the positive and negative peaks of the triangular waveform, or else the process of natural sampling no longer occurs and some intersections between the reference signal and an error signal will be lost. The result is that some switching pulses to the MOSFETs drive circuit will be dropped and inaccurate control [24].
The PWM current control technique is shown in Fig. 6.
Switching losses
To estimate inverter switching losses, the data of the switching devices, the MOSFET, given in [25], are considered. Inverter losses are divided into two categories, switching losses and conduction losses. Conduction loss is calculated using the actual currents flowing through the MOSFET [26]. Switching loss involves MOSFET turn-on plus turn-off losses (Psw) obtained using the following expressions:

Where: tsw(on) and tsw(off) are the MOSFET turn-on and turn-off times respectively from IRFP460N MOSFET [25], Isw(peak) is the peak current switched by MOSFET, f is switching frequency.
Simulation and results
To validate the proposed methodology, four cases have been investigated for different kinds of load by using the Matlab/Simulink power system toolbox. The simulation starts with R-L (linear) load connected to a three-phase three-wire balance system. Then, after 0.03 seconds, the non-linear load was added to generate the harmonics in the source current. In this study, the non-linear load considered was:-
a- Three phase full-bridge uncontrolled rectifier feed R-L load.
b- Three phase full-bridge full controlled rectifier feed R-L load as shown in Fig. 7.
Case 1 : SAPF based on PQ theory with hysteresis current control technique
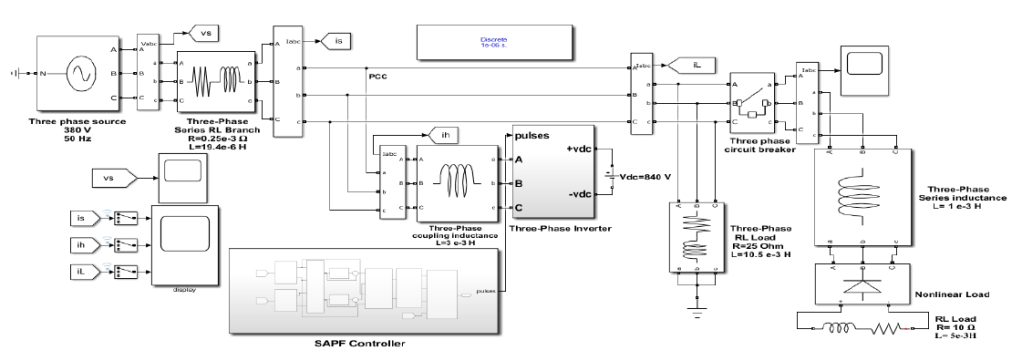
Fig. 8, shows the SAPF Simulink block diagram in Matlab. The PQ theory block diagram is shown in Fig. 9.
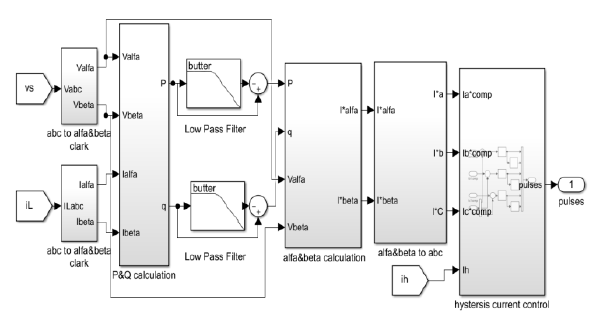
The hysteresis current control block diagram is shown in Fig. 10.
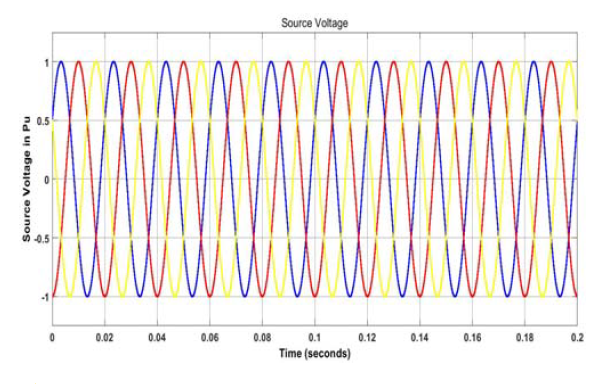
The simulation results of voltage, current, and THD are obtained by MATLAB software to analyze the effectiveness of SAPF with different non-linear loads. Fig. 11, presents the source voltage (VS) waveform with and without SAPF, in which it is found that there is no distortion.
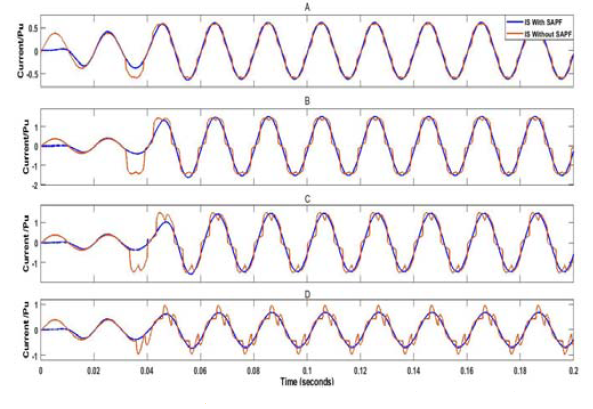
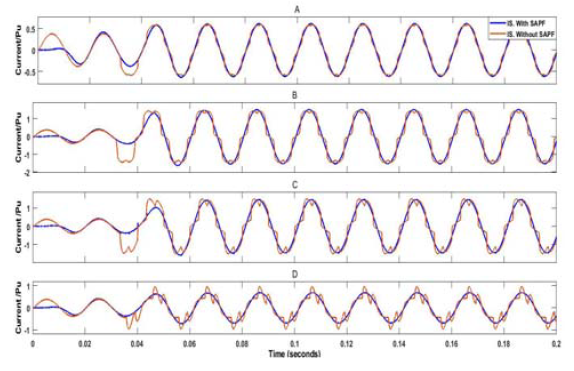
But in the waveform of source current (IS) at 0.03 second when the non-linear load was added caused distortion and increased the THD. The SAPF starts at 0.03 seconds to inject the electric current in the system at the PCC point to reduce the source current distortion and harmonic mitigation to improve the THD. Fig. 12, shows the source current waveform phase (a) with and without SAPF at 0.2 pu, 1 pu non-linear (uncontrolled) load current, and at 30°, 75° firing angles for (controlled) non-linear load.
In this case, the SAPF reduced the THD of source current from 10.9% to 0.46%, and from 19.38% to 0.19% at 0.2 pu, and 1 pu load current respectively. From 22.28% to 2.33%, and from 34.04% to 0.44% at 30°, and 75° firing angles respectively.
Case 2 : SAPF using PQ theory with PWM current control technique
Fig. 13, shows the PWM current control block diagram.
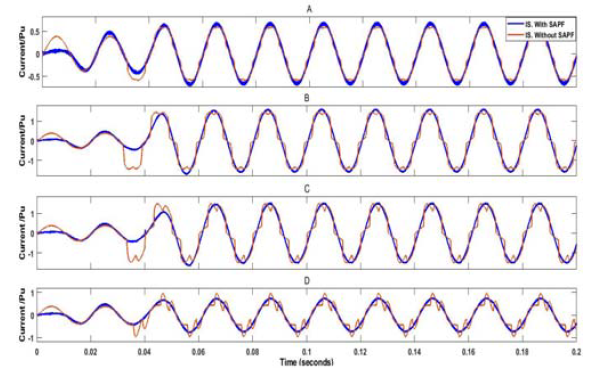
The triangular reference waveform frequency used is 10 kHz. The source current with and without SAPF at different non-linear loads is shown in Fig. 14.

This method, reduced the THD of source current from 10.9% to 3.47%, and from 19.38% to 1.54% at 0.2 pu, and 1 pu load current respectively. From 22.28% to 2.95%, and from 34.04% to 3.18% at 30°, and 75° firing angles respectively.
Case 3 : SAPF using DQ theory with hysteresis current control technique
The DQ theory block diagram is shown in Fig. 15.
The source current with and without SAPF at different non-linear loads is shown in Fig. 16.
This technique, reduced the THD of source current from 10.9% to 0.46%, and from 19.38% to 0.19% at 0.2 pu, and 1 pu load current respectively. From 22.28% to 2.33%, and from 34.04% to 0.44% at 30°, and 75° firing angles respectively.
Case 4 : SAPF using DQ theory with PWM current control technique
The source current with and without SAPF at different non-linear loads is shown in fig. 17.
In this technique, the SAPF reduced the THD of source current from 10.9% to 3.91%, and from 19.38% to 1.81% at 0.2 pu, and 1 pu load current respectively. From 22.28% to 3.23%, and from 34.04% to 3.56% at 30°, and 75° firing angles respectively.
Table (1) and Fig. 18, summarizes the effect of SAPF by using different techniques to the source current at different non-linear (uncontrolled rectifier) load currents.
Table 1. THD of source current at different load current with and without SAPF at different techniques
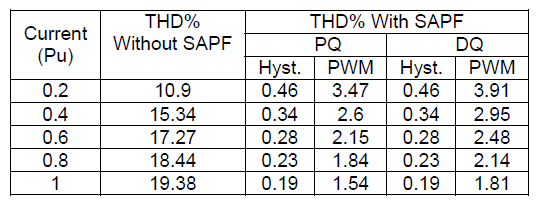
Table 2. THD of source current at different firing angles (α) with and without SAPF based on different techniques
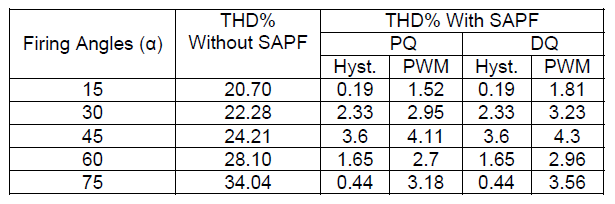
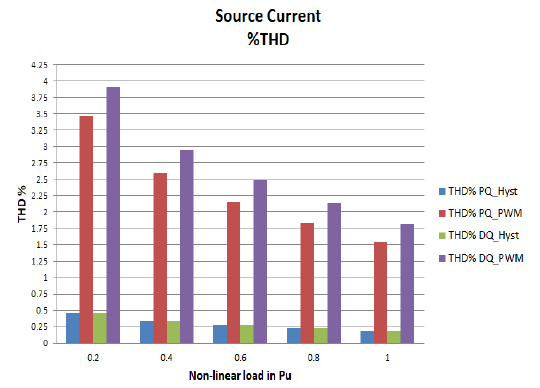
Table (2) and Fig. 19, summarizes the effect of SAPF by using different techniques for the source current at different firing angles (α) non-linear (controlled rectifier).
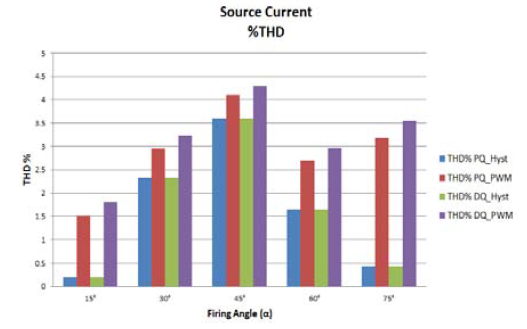
Table (3) shows the inverter MOSFETs switching frequency at different techniques of SAPF.
Table 3. SAPF inverter switching frequency.
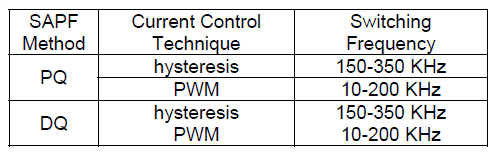
Fig. 20, shows the THD of source current with SAPF using PQ and DQ method with PWM techniques at different switching frequencies of MOSFETs inverter. The PQ method with PWM is more effective than the DQ method with the PWM technique at the same frequency but the switch losses are high.
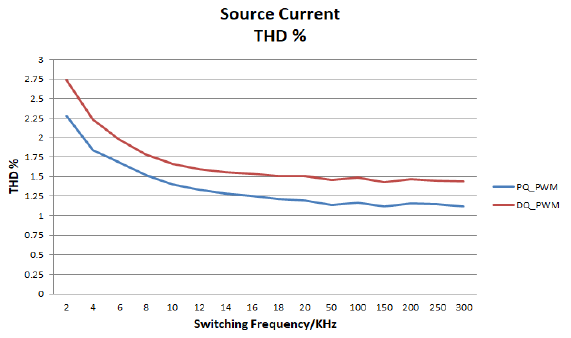
Fig. 21, shows the inverter MOSFETs switching losses (Psw) at different frequencies. The calculations are made theoretically by using equation (13).
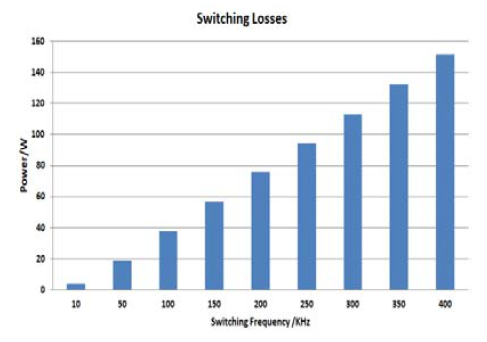
Fig. 22, shows the inverter MOSFETs switching losses (Psw) at different non-linear (uncontrolled) loads.
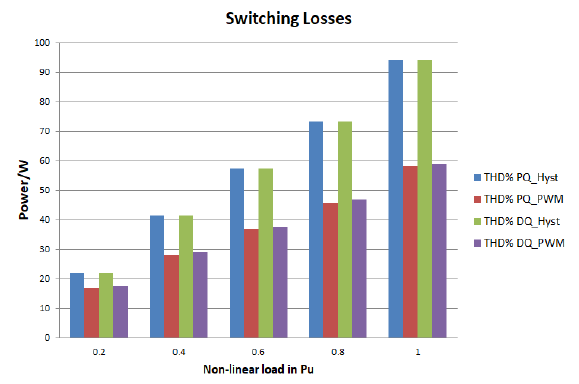
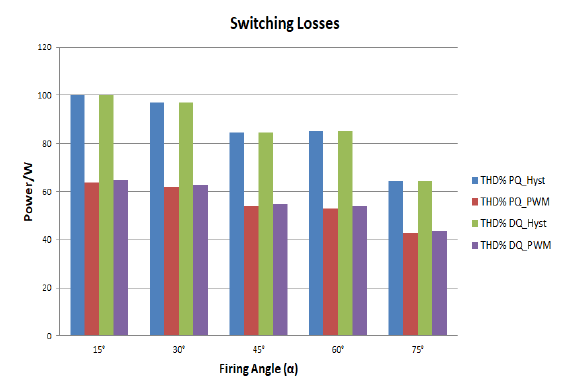
Fig. 23, shows the inverter MOSFETs switching losses (Psw) at different firing angle (α) non-linear (controlled) load.
Conclusion
The proposed work show the comparison between PQ and DQ theory with hysteresis and PWM techniques to controlling the SAPF to reduce the source current THD and improve the power quality. The PQ and DQ theory with hysteresis current control technique’s is reducing the THD from 19.38% to 0.19% at uncontrolled non-linear load, and from 34.04%to 0.44% at controlled non-linear load as shown in Fig. 18, and 19 respectively, but high power losses in inverter MOSFET switches because the high switching frequency about (150-350KHz) that shown in Fig. 22, and 23 respectively. The PQ and DQ with PWM technique are to reduce the THD to 1.54%, and 1.81% from 19.38% respectively at uncontrolled non-linear load, and to 3.18% and 3.56% from 34.04% respectively at controlled non-linear load. The PQ with PWM technique gives better results from DQ with PWM technique at a different switching frequency that shown in Fig. 20.
For future work, the experimental investigations can be made on SAPF by using Data Acquisition card to enter the real voltage and current signals in the LabView program and process them in real-time.
REFERENCES
[1] D. M. Soomro, M. A. Omran, and S. K. Alswed, “Design of a shunt active power filter to mitigate the harmonics caused by non-linear loads,” ARPN Journal of Engineering and Applied Sciences, 10 (2015), no. 19. pp. 8774–8782.
[2] B. UdayaSri, P. A. M. Rao, D. K. Mohanta, and M. P. C. Varma, “Improvement of power quality using PQ-theory shuntactive power filter,” International Journal of Research in Engineering and Technology, 03 (2016), no. 04. pp. 2083–2088, doi:10.15623/ijret.2014.0304083.
[3] C. Rejil and A. K. R, “Design and Simulation of Three Phase Shunt Active Power Filter Using SRF Theory,” Adv. Electron. Electr. Eng., 3 (2013), no. 6, pp. 651–660.
[4] N. Booma and S. R. Reddy, “Design And Simulation Of Hybrid Active Power Filter For Power Quality Improvement,” imanager’s J. Electr. Eng., 6 (2012), no. 2, pp. 16–21, doi: 10.26634/jee.6.2.2055.
[5] P. S. M. Niklesh Das1, “Power Quality Improvement of Three Phase System using Shunt Active Power Filter.” (2017), pp. 23–26.
[6] B. Abd El-Rahman, E. G. Shehata, A.-H. El-Sayed, and Y. S.Mohamad, “Performance Analysis of Active Power Filter Controllers for Harmonics Mitigation in Power Systems,” J. Adv. Eng. Trends, 39 (2020), no. 1, pp. 77–88, doi: 10.21608/jaet.2020.75203.
[7] E. K. Almaita, “Adaptive radial basis function neural networks-based real time harmonics estimation and PWM control for active power filters,” (2012), no. 5.
[8] M. Halawa, B. Abou-zalam, and A. Sobaih, “Power Quality Improvement Using a Shunt Active Power Filter Based on the Hysteresis Current Controller,” Int. Electr. Eng. J., 7 (2016), no.5, pp. 2266–2278.
[9] L. Kdqj et al., “Active power filter design for improving power quality,” (2015), pp. 22–24.
[10] S. S. Patil and R. A. Metri, “Power Quality Improvement Using Shunt Active Power Filter,” Ijireeice, 5 (2017), no. 3. pp. 23–26, doi: 10.17148/ijireeice.2017.5305.
[11] P. M. Priyadarshi, “Simulation Analysis of Harmonic Eliminator using PQ Theory,” Int. J. Res. Appl. Sci. Eng. Technol., 7 (2019), no. 6, pp. 1916–1920, doi: 10.22214/ijraset.2019.6321.
[12] SULIMAN, Mohammed Y.; FARRAG, M. Emad. Power balance and control of transmission lines using static series compensator. In: 2018 53rd International Universities Power Engineering Conference (UPEC). IEEE, (2018). p. 1-5.
[13] Hirofumi Akagi, Edson Hirokazu Watanabe, “INSTANTANEOUS POWER THEORYAND APPLICATIONS TO POWER CONDITIONING,” Wiley-IEEE Press; (2017) 2nd edition. no. 978-1-118-36210-5
[14] SULIMAN, Mohammed Y.; BASHI, Sinan M. Fast response SSSC based on instantaneous power theory.International Conference on Electrical Communication, Computer, Power, and Control Engineering (ICECCPCE), IEEE, (2013). p. 174-178.
[15] B. Berbaoui, C. Benachaiba, M. Rahli, and H. Tedjini, “An efficient algorithm to tuning Pl-controller parameters for shunt active power filter using ant colony optimization,” Prz. Elektrotechniczny, 87 (2011), no. 6, pp. 140–145.
[16] SULIMAN, Mohammed; FARRAG, Mohamed Emad; BASH, Sinan. Design of fast real time controller for the SSSC based on Takagi-Sugeno (TS) adaptive neuro-fuzzy control system. In: Renewable Energy and Power Quality Journal. (2014). No. 12.
[17] S. Po-Ngam, “The simplified control of three-phase four-leg shunt active power filter for harmonics mitigation, load balancing and reactive power compensation,” ECTI Trans. Electr. Eng. Electron. Commun., 13 (2015), no. 1, pp. 35–41.
[18] S. Ravindra, V. C. V. Reddy, and S. Sivanagaraju, “Design of Shunt Active Power Filter to eliminate the harmonic currents and to compensate the reactive power under distorted and or imbalanced source voltages in steady state,” Int. J. Eng. Trends Technol., 2 (2011), no. 3, pp. 20–24.
[19] L. Malesani, P. Mattavelli, and S. Buso, “Dead-beat current control for active filters,” IECON Proc. (Industrial Electron. Conf., 3 (1998), pp. 1859–1864, doi: 10.1109/iecon.1998.723020.
[20] Z. Salam, P. C. Tan, and A. Jusoh, “Harmonics mitigation using active power filter: a technological review,” Elektrika, 8 (2006), no. 2, pp. 17–26.
[21] M. Giesselmann, H. Salehfar, H. Toliyat, and T. Ur Rahman, “Modulation Strategies,” 408 (2001), doi: 10.1201/9781420037067.ch7.
[22] M. Giesselmann, E. Walters, and M. Giesselmann, “Inverters [89 paginas 07.02],” (2002).
[23] S. Mikkili and A. K. Panda, Power Quality Issues – Current Harmonics. CRC Press is an imprint of Taylor & Francis Group, an Informa business. (2018),no. 13: 978-1-4987-2963-5.
[24] T. S. Rathnayake, K. T. Rukshan, R. A. T. J. K. Rupasinghe, R. M. M. Ruwanthika, and J. P. Karunadasa, “Design and simulation of single phase active current harmonic filter,” (2014) 978–983, doi: 10.1109/ICCPCT.2014.7054957.
[25] H. P. Mosfet, “Irfp460N Irfp460N,” pp. 1–8.
[26] GUPTA, Rajesh; GHOSH, Arindam; JOSHI, Avinash. Control of 3-level shunt active power filter using harmonic selective controller. IEEE Power India Conference. IEEE, (2006). p. 7 pp.
Authors: Dr. Mahmood T. Alkhayyat, Lecturer in electrical power engineering, m.t.alkhayyat@ntu.edu.iq, +9647507514475; Assistant Professor Dr. Mohammed Y. Suliman, Specialization in Electrical Power Engineering , mohammed.yahya@ntu.edu.iq, +9647704116100; Faisal Falah Aiwa, Msc student, faisal.aiwa@ntu.edu.iq, +9647740854744.
Source & Publisher Item Identifier: PRZEGLĄD ELEKTROTECHNICZNY, ISSN 0033-2097, R. 97 NR 9/2021. doi:10.15199/48.2021.09.17
