Published by Kris Scicluna 1,* , Brian Azzopardi 1,2 and Kurt Spiteri 1,
(1) Institute of Engineering & Transport, Malta College of Arts, Science and Technology, PLA 9032 Paola, Malta; brian.azzopardi@mcast.edu.mt (B.A.)
(2) The Foundation for Innovation and Research—Malta, BKR 4012 Birkirkara, Malta
*Correspondence: kris.scicluna@mcast.edu.mt; Tel.: +356-7986-8731
Abstract: This paper presents a power quality analysis for multiple electric vehicle charging stations of the AC-Level 2 type in a real-life case study. The data was collected with a power quality analyzer that measured the main distribution system feeding nine 7 kW charging stations in a commercial site with light-duty vehicles in Malta, Europe. The relevance of this study to the specific case of Malta is accentuated by the topological challenges of the country; high density of road vehicles, with 18,000 vehicles for each square kilometer; and ambitious targets of reaching carbon neutrality by 2050. Data were collected over six days on an actual charging system with real-life charging patterns. Various results are presented in this paper, including three-phase system voltages and currents, individual harmonic voltage and current components, total harmonic distortion and total current demand distortion. These measurements were compared with standardized thresholds for low-voltage equipment used in public spaces, mainly as stated in IEEE 519-2014.
Keywords: electric vehicle; charging; power quality; harmonic analysis; Type 2 chargers; total harmonic distortion
1. Introduction
This paper presents a power quality (PQ) analysis for an electrical system with nine electrical vehicle charging stations of the AC-Level 2 type (unidirectional) in a real-life case study connected to a 400 V low voltage (LV) electrical grid. The data was collected with an experimental setup that consisted of a power quality analyzer sampling measurements on the main distribution system feeding the nine 7 kW charging stations in a commercial site with a fleet of light-duty service vehicles in Malta, Europe. The territory of Malta is relatively small, covering a total area of around 316 square kilometres (122 square miles). Despite its relatively small size, Malta is densely populated, with a population of over 500,000 people. The main island of Malta itself accounts for the majority of the land area, while the smaller islands of Gozo and Comino make up the rest of the national territory. The territory provides a possibly unique case to evaluate the effects of modern power electronics equipment on PQ.
The Malta Low Carbon Development Strategy [1] outlines the country’s goals for the reduction in greenhouse gas emissions through strategies in various sectors, including transportation, buildings, industry, waste management, water management and agriculture. The greenhouse gas (GHG) emissions per capita and GHG emissions per unit of gross domestic product (GDP) have been reduced significantly in Malta since 2014. Malta also stands below the European Union (EU) average in terms of GHG emissions per capita. However, further efforts in reducing GHG emissions are necessary to meet the following:
• 2030 targets under Regulation (EU) 2018/842 of the European Parliament and the Council binding annual GHG emissions reductions from 2021 to 2030 by Member States contributing to climate action to meet commitments under the Paris Agreement and amending Regulation (EU) No. 525/2013.
• Malta’s decarbonization plans, which are in line with those adopted by the EU of reaching climate neutrality by 2050.
A significant part of the strategy in the transportation sector identified in [1] is reliant on the electrification of vehicles and sourcing power for such vehicles through renewable methods. Malta has a high density of vehicles, with 18,000 vehicles for each square kilometre, translating to 1500 cars for every 1000 drivers. Hence, efforts in this area are expected to be highly impactful towards decarbonization goals.
The impact of renewable energy, which today is mostly driven by switching electronic power converters, in the particular case of Malta has already been investigated in [2–5] and the particular effects of electric vehicles on the grid were modelled in [6]. The island provides an interesting case scenario for the uptake of light-duty electric vehicles (EVs) since the electrical grid is predominantly a centralized one with the only distributed sources of generation being of the renewable type. Given the natural topological challenges to upgrading the electrical infrastructure, Malta relies on distribution systems and routes that were not originally designed for distributed generation and storage. Hence, the evaluation of EV charging infrastructure as presented in this paper is possibly of a more critical nature than in other countries with more extensive national boundaries and fewer infrastructural challenges.
Electric vehicle chargers are subdivided into three categories [7,8]: Level 1, Level 2 and Level 3. The charger levels differ mainly in terms of power, with a higher power associated with higher levels [9]. Level 1 charging, also known as opportunity charging, is typically powered using a single-phase supply with a maximum power rating of 1.9 kW. Level 2 charging, also known as primary charging, is typically supplied by a single- or three-phase source with a maximum of 19.2 kW. A wide range of brands oriented towards residential or small commercial sites fall under this category. Level 3 charging, also known as fast charging, is typically found in dedicated charging sites with expected power levels of up to 100 kW. A more detailed overview of the standards related to the EV chargers as set out by the Society of Automotive Engineers (SAE) is presented in [6].
Given that most EV charger topologies use non-linear circuits based on high-frequency switching of semiconductor devices [10–14], a degradation in power quality is expected to some extent; therefore, the impact on the electrical grid has been widely researched [3,15–18]. A high uptake of electric vehicle charging is expected to cause various power quality [15,19–21] issues, such as an under-voltage, a phase imbalance and increased harmonics [22]. The widely used typical EV charger Level 2 with a power rating of 7 kW, operated on a single-phase system is expected to have a maximum current demand of 30 amperes. This contributes to a significant part of the maximum permissible current demand on the low-voltage supplies available in most countries. For instance, in residential properties in Malta, where this study was conducted, a single-phase supply was capped at 40 amperes, while a three-phase supply was capped at 60 amperes per phase. Such a 7 kW charger would consume 75%of the available single-phase supply current and 16.6% of the available three-phase supply current. While current supply capabilities vary from country to country, Level 2 EV chargers with such power ratings are expected to consume a significant part of the available supply. Hence, given this significant contribution to the total load profile, if the power quality of such EV chargers is not according to the standard limits, significant effects on the grid can be expected. Such effects tend to include overheating of the transmission cables, increased eddy losses in supply-side transformers and thermal function of protective switchgear [23–25]. The main standard referred to in this paper is IEEE 519-2014 [26], which provides maximum limits for voltage and current power quality (PQ)-related parameters. Other commonly referred to documents also exist, such as the Engineering Recommendation G5/4-1 [27], which provides additional detailed limits for the individual odd/even harmonics.
This paper is subdivided as follows: Section 2 presents the research methodology applied for the data collection and analysis of the measurements necessary for the power quality (PQ) analysis. Sections 2.1 and 2.2 summarize relevant limits on the distortion parameters for voltage and currents in low-voltage three-phase systems as applicable to the system being studied in this case scenario. The actual experimental configuration used to collect the data is presented in Section 2.3. The measurements and results obtained are shown in Section 3. Various measurements are given, such as the system phase voltages, voltage total harmonic distortion, voltage individual harmonics, phase currents, current total demand distortion and current individual harmonics. A discussion of the results is presented in Section 4, while the conclusions and recommendations for further work are given in Section 5.
2. Research Methodology
The objective of the research methodology applied in this study was to investigate the power quality (PQ) characteristics of grid-connected electric vehicle (EV) Type 2 chargers and evaluate them with respect to established standards for voltage and current distortion. The methodology involved the collection of PQ data from these nine chargers and a subsequent comparison of the obtained results with the defined limitations that are mainly outlined in the IEEE 519-2014 standard. Section 2.1 of this paper provides a concise summary of the constraints imposed on voltage distortion, as specified in the aforementioned standard. Similarly, Section 2.2 presents an overview of the limitations of current distortion outlined in the same standard.
To conduct the experiments, a three-phase power quality analyzer was utilized, as described in Section 3.3. The setup was based on measurements from a distribution board that supplied nine Type 2 EV chargers, which were connected to the three-phase system being analyzed. This section provides a comprehensive description of the experimental configuration employed for the data collection. By employing this research methodology and experimental setup, this study aimed to provide valuable insights into the PQ characteristics of grid-connected EV Type 2 chargers. Through a comparison with standardized limitations, the findings of this study will contribute to a better understanding of the voltage and current distortion associated with these chargers and facilitate efforts to optimize their performance and compliance with PQ standards.
2.1. Limitations on Voltage Distortion
IEEE 519-2014 provides guidelines and limitations for voltage distortion in low voltage (LV) electrical power systems operating at voltages less than 1 kV. Voltage distortion refers to the presence of harmonics and other unwanted deviations from the ideal sinusoidal waveform in the voltage supplied by the grid typically at a fundamental frequency of 50–60 Hz (depending on the geographic location). These deviations can have detrimental effects on the performance of electrical equipment and can lead to power quality issues, as outlined in Section 1.
According to IEEE 519-2014, the individual harmonic distortion of the voltage waveform should be limited to less than 5% and the total harmonic distortion (THD) limited to 8% or less. Limits on the interharmonics are listed in Table A-1 of the same standard, with acceptable limits of 5% at 16 Hz. These limits aim to ensure that the voltage supplied to connected loads remains within acceptable bounds.
Harmonics are multiples of the fundamental frequency (typically 50 or 60 Hz) and can result from non-linear loads, such as power electronics, variable frequency drives and switch-mode power-supply-operated lighting. Interharmonics are non-integer multiples of the fundamental frequency and can result from various sources, such as arc furnaces, power converters and certain types of industrial equipment [28,29]. Interharmonics can have similar effects to harmonics.
The scope of having electrical systems that are compliant with the voltage distortion limits outlined in IEEE 519-2014 helps to maintain a high-quality and reliable power supply. Utilities, electrical system designers and equipment manufacturers follow these guidelines to ensure that the voltage distortion remains within acceptable limits.
2.2. Limitations on Current Distortion
Besides limitations on voltage, IEEE 519-2014 also provides guidelines and limitations on the magnitude of current harmonics. Table 2 within the standard provides different levels of harmonic limits depending on the ratio of the maximum short-circuit current at the point of common coupling (PCC) divided by the maximum demand load current at the fundamental frequency at the PCC under normal operating conditions (ISC/IL). Higher individual harmonics are applied at lower harmonics with a limit of 4% for the odd harmonics between h = 3 and h = 11 (ISC/IL) < 20. The maximum total demand distortion (TDD) at this level is 5%. For even harmonics, lower limits are allowed since these are typically not dominant components, with a capping of 25% of those set for odd harmonics. Since the ratio ISC/IL is dependent on the maximum load under normal operation conditions, harmonic limits are subject to the individual electrical installation and equipment configurations.
In this research, the ratio ISC/IL was assumed to be <20 (the most stringer level) based on a theoretical calculation. The ratio of ISC/IL was not experimentally determined due to instrumentation not being available at the time data was being collected. The theoretical calculation assumed a short-circuit current ISC that is less than 1000 amperes and the maximum load current to be equal to the rating of the MCB feeding the chargers (described in Section 2.3) of 100 amperes. This resulted in an ISC/IL that is less than 20. While short-circuit current ratings vary from one installation to another, it is unlikely to have currents higher by more than an order of magnitude due to the impedance of the conductor cables from the supply point to the EV charging stations. This assumption is further validated when the load demanded by the EV charging stations starts to increase, thus decreasing the overall ISC/IL ratio.
2.3. Experimental Setup
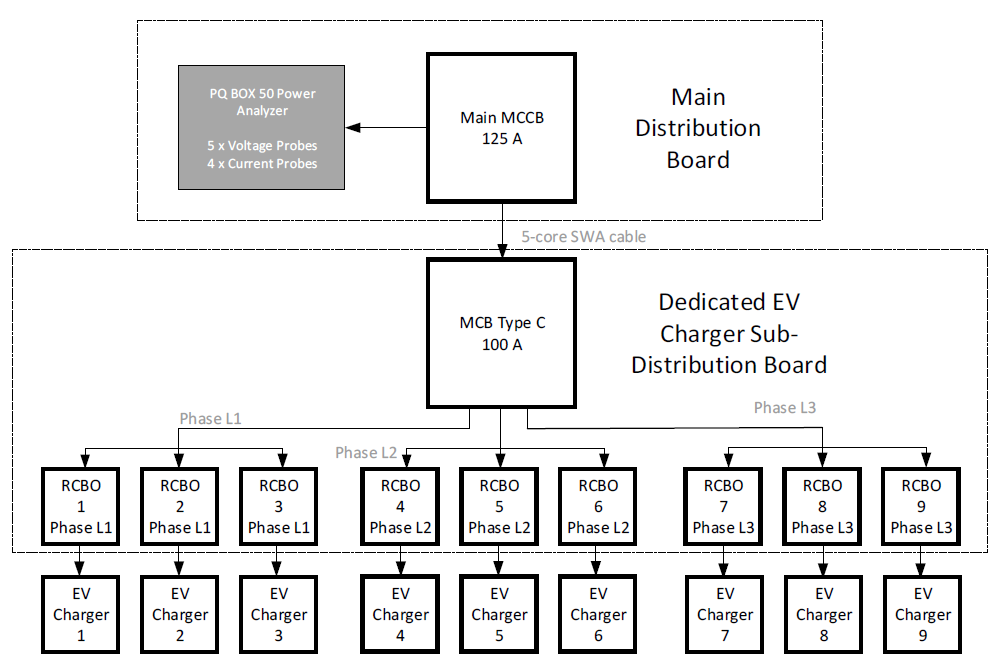
The measurements required to carry out the PQ analysis for this study were taken on a commercial EV charging setup with nine individual single-phase chargers rated at 7 kW (nominal voltage 230 V RMS, expected peak current 30 A RMS), as shown in Figure 1. The nine chargers were distributed with three for each phase. The dedicated EV charger sub-distribution board was protected by a 100 A Type C miniature circuit breaker (MCB) and nine individual 32 A 30 mA residual current breakers with overload (RCBOs), with one for each charger. The data was collected at the main distribution board on/after the EV circuit 125 A molded case circuit breaker (MCCB) using an A-Eberle PQ-BOX 50 instrument, which is suitable for individual voltage/current harmonic analysis up to the 50th harmonic.
The A-Eberle PQ-Box 50 instrument was chosen since it is a class-A mobile measurement device for outdoor operation, as per IEC 62586. The PQ-BOX 50 instrument was configured to measure four voltages (VL1, VL2, VL3 and VN with respect to the earth potential) and four line currents (IL1, IL2, IL3 and IN) at 5 s intervals. Experimental data were processed using the Light B1 licence on the dedicated A-Eberle WinPQ Mobile software. Due to limitations on the licence, only integer multiple harmonics were analyzed. Interharmonics were considered to be beyond the scope of this paper. The data obtained from the analyzer equipment was transferred to MATLAB in order to produce more detailed graphical representations, as shown in Section 3.
3. Results
In this study, the PQ data was collected using a PQ analyzer over six days, resulting in a dataset comprising measurements taken at five-second sample intervals. This duration was chosen to capture a substantial amount of data and provide a comprehensive understanding of the PQ characteristics of the commercial electric vehicle (EV) Type 2 setup under investigation. Such a dataset, which covered a total of 144 h, was gathered since it reflected real-life usage patterns and allowed for a more robust analysis.
It is important to note that during the data collection period, the commercial EV setup had recently been commissioned. As a result, the uptake of EV charging was limited, and the charging process did not reach full capacity at any given time. The dataset presented in this paper, therefore, consisted of a scenario where a maximum of one vehicle was being charged per phase. This setup allowed for the examination of different combinations involving a single vehicle charging on each phase.
While the dataset focused on single-vehicle charging scenarios, we acknowledge that in practice, multiple EV chargers are to be connected to the same phase. Recommendations and considerations for such situations are provided in Section 5 of this paper. By presenting these considerations, the study aimed to offer insights into the potential challenges and strategies for managing power quality issues that may arise when multiple chargers are connected to a single phase.
By having a dataset collected over six days to incorporate real-life usage patterns and considering different charging scenarios, this study provides a comprehensive analysis of the PQ characteristics of the commercial EV setup. The findings contribute to a better understanding of the impact of EV charging on power quality and offer valuable insights for planning and optimizing the integration of EV chargers with the electrical grid.
3.1. System Voltage Results
The system’s three-phase voltages VL1, VL2 and VL3 for the EV charging setup are shown in Figure 2. The voltage limits in Malta are bound within ±10% under steady-state normal operating conditions, as specified by the network code [30], which makes reference to EN50160:2021 [31].
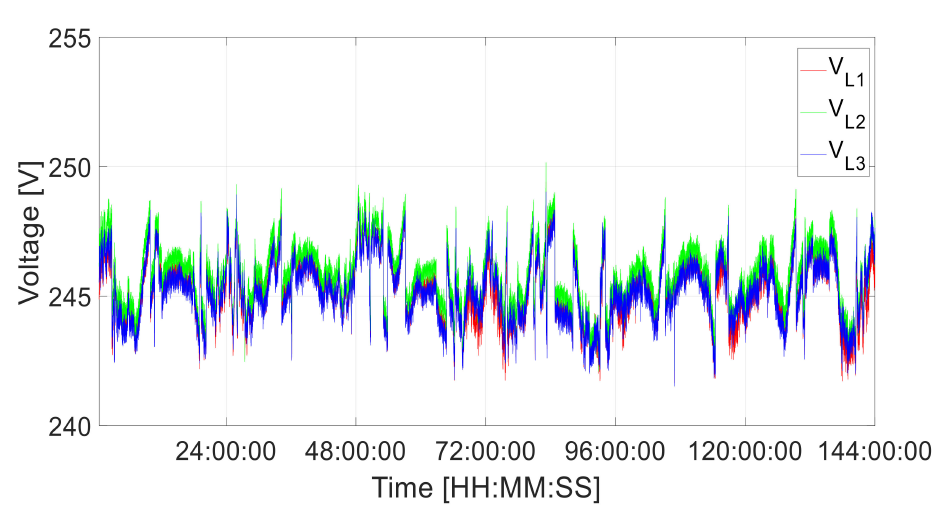
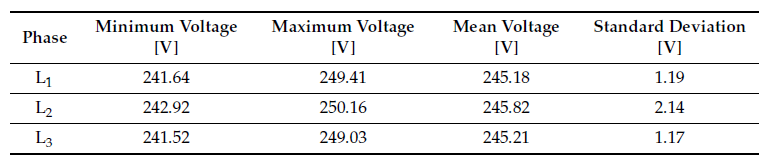
The voltages shown in Figure 2 for the three phases were within the 230 V ±10%, and therefore, the installation had no issues with over/undervoltage steady-state voltages. The minimum, maximum, mean and standard deviation voltages for each phase are given in Table 1.
Table 1. Voltage indicators in phase voltage for 6 days.
3.2. System Voltages Total Harmonic Distortion
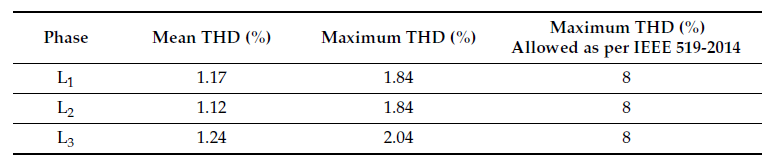
The total harmonic distortions (THDs) for the system’s three-phase voltages VL1, VL2 and VL3 are shown in Figure 3. The mean and maximum THD values for the period shown are listed in Table 2. All values were within the 8% limit specified in IEEE 519-2014 [26].
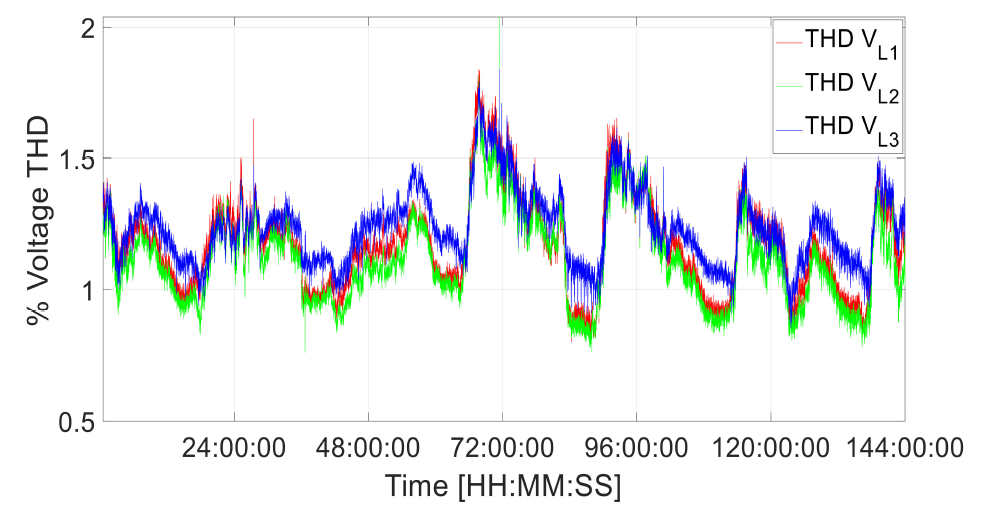
Table 2. Total harmonic distortion (%) in the phase voltage for 6 days.
3.3. System Voltage Harmonic Components
The harmonic voltages in phase L1 divided by the fundamental voltage expressed as a percentage are shown in Figure 4 for h = 3, 5, 7 and 9. These harmonics were observed to be the most significant contributors to the THD. Similar results were observed for phases L2 and L3. The mean and maximum values for the period shown are listed in Table 3. The maximum values were observed on the fifth harmonic, with a mean of 0.88% and a maximum of 1.34% of the fundamental. However, all values were within the 5% limit individual harmonic level specified in IEEE 519-2014 [26].
3.4. System Current Results
The system phase currents IL1, IL2 and IL3 in the three-phase cable feeding the EV charging setup are shown in Figure 5. As specified in Section 2, each charger was a single-phase 7 kW charger with a nominal phase voltage of 230 V RMS. This translated into a maximum phase current of approximately 30 A RMS.
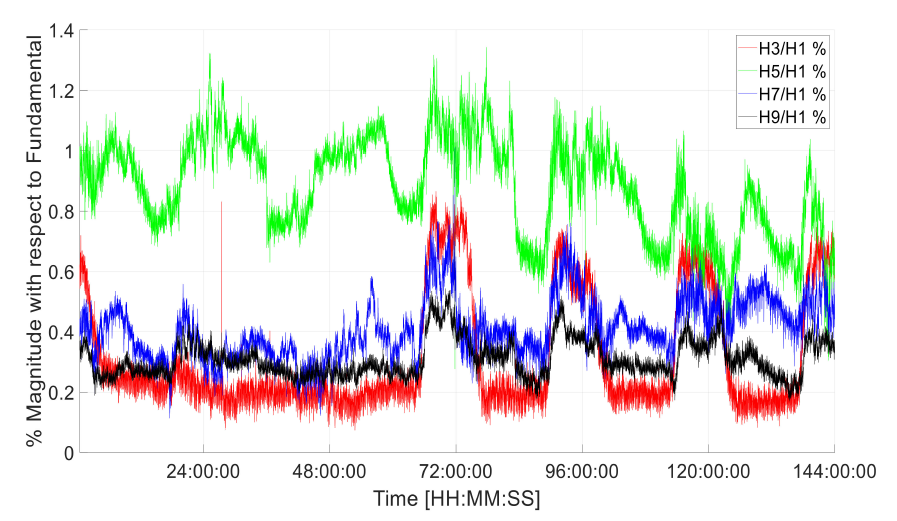
Table 3. Harmonic voltage/fundamental voltage for phase L1 for 6 days.

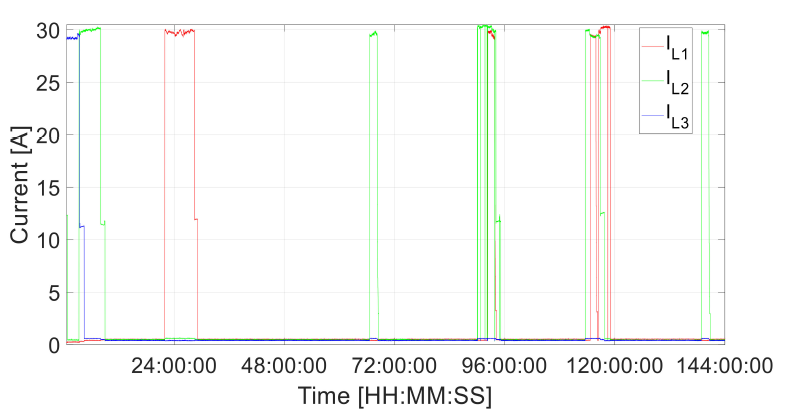
In Figure 5, the instances over which electric vehicle charging occurred can be clearly identified from the pulsating nature of the waveforms with maxima in the 30 A RMS region. This shows that only one charger in each phase was utilized at any given time. Therefore, although current measurements were taken on the supply side, these results also reflect the individual charger performance.
3.5. System Current Total Demand Distortion
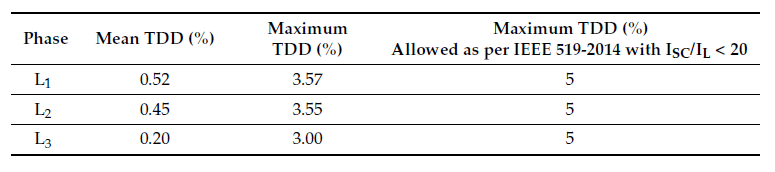
The total demand distortion (TDD) for the system voltages is shown in Figure 6. The mean and maximum THD values for the period shown are listed in Table 4. All values are within the 5% TDD limit specified in IEEE 519-2014 [26], assuming the most stringent level of ISC/IL < 20. The highest values were observed for L1, with a mean of 0.52% and a maximum of 3.57%.
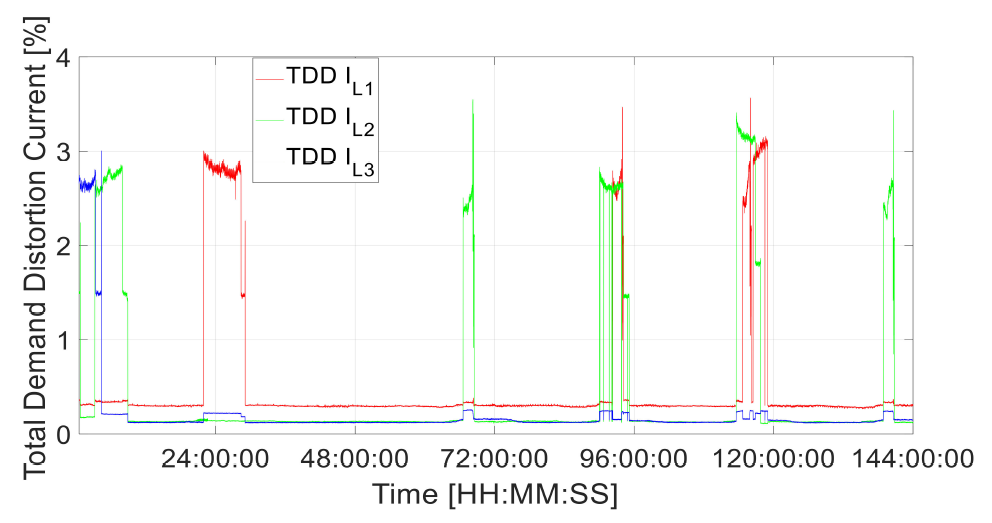
Table 4. Total demand distortion (%) in the phase current for 6 days.
3.6. System Current Harmonic Components
The harmonic current for phase L1 divided by the maximum current demand expressed as a percentage is shown in Figure 7 for h = 3, 5, 7 and 9. These harmonics were observed to be the most significant contributors to the TDD. Similar results were observed for phases L2 and L3.

The mean and maximum values for the period shown are listed in Table 5. The highest maximum value was observed for the third harmonic at 2.57% of the fundamental. However, all values were within the 4% limit individual harmonic level specified in IEEE 519-2014 [26].
Table 5. Harmonic current/maximum current demand for phase L1 for 6 days.

4. Discussion
Section 3 of this paper mentions the boundary condition that the results were derived from tests where a maximum of only one electric vehicle charger was utilized per phase. In Section 2.3, it was shown that each phase possessed the capability to accommodate three different chargers operating simultaneously. The rationale behind this limitation was rooted in the fact that the experimental results were gathered from an actual commercial system with a light vehicle fleet characterized by varying usage patterns. Additionally, it should be emphasized that the installation itself was relatively new, and its uptake had not yet reached full capacity.
To delve deeper into the power quality issues pertaining to the operation of multiple Type 2 chargers, the authors have planned future work involving data collection and power quality (PQ) analysis under higher load demand. The intention is to further scrutinize the effects associated with increased charger utilization.
In the forthcoming research, emphasis will be placed on investigating the power quality implications of having multiple Type 2 chargers in operation. This will encompass data collection techniques that involve subjecting the system to higher load demands, thereby facilitating a comprehensive analysis of power quality issues. By undertaking this future work, the aim is to enhance our understanding of the impact of increased charger usage on power quality and to provide valuable insights for the optimization and management of multiple chargers within the electrical grid.
The system voltage results for VL1, VL2 and VL3 in Section 3.1 were shown to be within the mandatory ±10%, which is the threshold at which the distributor must supply the voltage. The mean and standard voltages for phases L1, L2 and L3 shown in Table 1 did not indicate any issues in the voltage magnitude at the loading conditions present in this dataset. The THDs for the three-phase voltages were investigated in Section 3.2. The maximum THD on the voltage was noted on phase L3 at 2.04%, which was significantly less than the maximum THD allowed in IEEE 519-2014 of 8%. Individual voltage harmonic components normalized by the fundamental component are shown in Section 3.3 for harmonic numbers h = 3, 5, 7 and 9. The maximum harmonic percentage was observed at h = 5 at 1.34%, which is less than the maximum allowed in IEEE 519-2014 of 5%. This is also lower than the specific harmonic level in Engineering Recommendation G5/4-1 for h = 5, which is at 2%.
The system current results IL1, IL2 and IL3 given in Figure 5 in Section 3.4 show the load and usage patterns on the EV charging setup. A maximum charging current of 30 A per phase was observed with a reduced charging rate of about 13 A. These patterns indicate a single charger being used at any one time per phase. The TDD for the three-phase currents was investigated in Section 3.5. The maximum TDD was observed on phase L1, which was 3.57%, which is less than the maximum THD allowed in IEEE 519-2014 of 5% for ISC/IL < 20. The ratio ISC/IL < 20 was assumed since it is the most stringent in terms of harmonics. Individual current harmonic components normalized by the maximum demand are shown in Section 3.6 for harmonic numbers h = 3, 5, 7 and 9. The maximum harmonic percentage was observed at h = 3 at 2.57%, which is less than the maximum allowed in IEEE 519-2014 of 4%.
Furthermore, from the data presented in this paper, it is clear that the multi-charger setup in this case study was operating in an uncoordinated charging manner [32]. Uncoordinated charging occurs when charging is initiated whenever the user plugs in the vehicle and a sufficiently low state of charge is detected. Coordinated charging, however, which uses charge scheduling embedded with optimization algorithms, was shown to provide numerous advantages at the grid level [32,33]. Given the system’s current measurements in Section 3.4, coordinated charging could possibly also provide PQ benefits for single-phase chargers on a three-phase installation. This is mainly due to the reduction in fundamental neutral currents and neutral harmonics.
5. Conclusions
In this study, the boundary condition was that only one charger out of a possible three was utilized in each phase. Consequently, the current demand remained less than the expected maximum possible demand. However, since the total current drawn has an impact on both voltage and current power quality (PQ) parameters, it is essential to examine the EV station setup under load conditions closer to the maximum.
To investigate the changes in PQ resulting from different loading points, future work will be conducted on the same experimental setup discussed in Section 2.3. This will involve exploring various combinations of multiple chargers on different phases and assessing their effects on PQ. Additionally, the short-circuit current (ISC) will be measured experimentally using a loop impedance tester to obtain an accurate ISC/IL value. For this study, the ISC/IL ratio was assumed to be less than 20, representing the most stringent level.
While the results presented in this paper were based on the limitation of one charger per phase, they remain valid in illustrating the impact on PQ parameters of modern AC Level 2 chargers that are commonly found in residential and small commercial charging setups. As discussed in Section 4, the PQ parameters related to voltage and currents investigated in this study complied with relevant international standards.
Although the study’s boundary condition may have restricted the extent of the current demand, the findings still provide valuable insights into the PQ effects of AC Level 2 chargers. These results offer an understanding of the implications of PQ associated with residential and small commercial charging scenarios, contributing to the updated knowledge of entry-level EV charging infrastructure and its impact on power grids.
Moving forward, further investigations into the effects of increased loading operating points and variations in charger combinations will help to deepen the understanding of the operation of such Type 2 charging setups. This continued research is intended to contribute to the better operation of EV charging systems while ensuring compliance with international PQ standards.
References
1. Malta Low Carbon Development Strategy. Government of Malta, Ministry for the Environment, Climate Change and Planning, Malta. 2021. Available online: https://meae.gov.mt/en/Public_Consultations/MECP/PublishingImages/Pages/Consultations/ MaltasLowCarbonDevelopmentStrategy/Malta%20Low%20Carbon%20Development%20Strategy.pdf (accessed on 3 June 2023).
2. Franzitta, V.; Curto, D.; Rao, D. Energetic Sustainability Using Renewable Energies in the Mediterranean Sea. Sustainability 2016, 8, 1164. [CrossRef]
3. Micallef, A.; Spiteri Staines, C.; Licari, J. Renewable Energy Communities in Islands: A Maltese Case Study. Energies 2022, 15, 9518. [CrossRef]
4. Gabdullin, Y.; Azzopardi, B. Impacts of High Penetration of Photovoltaic Integration in Malta. In Proceedings of the 2018 IEEE 7th World Conference on Photovoltaic Energy Conversion (WCPEC) (A Joint Conference of 45th IEEE PVSC, 28th PVSEC & 34th EU PVSEC),Waikoloa, HI, USA, 10–15 June 2018; pp. 1398–1401. [CrossRef]
5. Bartolo, B.; Azzopardi, B.; Yesbol, G. Mitigation Solutions to High Penetration of Photovoltaics and Electric Vehicles Integration in Malta. In Proceedings of the 12th Mediterranean Conference on Power Generation, Transmission, Distribution and Energy Conversion (MEDPOWER 2020), Online Conference, 9–12 November 2020; pp. 150–153. [CrossRef]
6. Azzopardi, B.; Gabdullin, Y.; Simkoniene, G. Impacts of electric vehicles on low-voltage distribution networks in Malta. In Proceedings of the 13th Mediterranean Conference on Power Generation, Transmission, Distribution and Energy Conversion (MEDPOWER 2022), Valletta, Malta„ 7–9 November 2022; Volume 2022, pp. 551–553. [CrossRef]
7. Yilmaz, M.; Krein, P.T. Review of Battery Charger Topologies, Charging Power Levels, and Infrastructure for Plug-In Electric and Hybrid Vehicles. IEEE Trans. Power Electron. 2013, 28, 2151–2169. [CrossRef]
8. Pareek, S.; Sujil, A.; Ratra, S.; Kumar, R. Electric Vehicle Charging Station Challenges and Opportunities: A Future Perspective. In Proceedings of the 2020 International Conference on Emerging Trends in Communication, Control and Computing (ICONC3), Lakshmangarh, India, 21–22 February 2020; pp. 1–6. [CrossRef]
9. Su, W.; Eichi, H.; Zeng, W.; Chow, M.Y. A Survey on the Electrification of Transportation in a Smart Grid Environment. IEEE Trans. Ind. Inform. 2012, 8, 1–10. [CrossRef]
10. Khaligh, A.; Dusmez, S. Comprehensive Topological Analysis of Conductive and Inductive Charging Solutions for Plug-In Electric Vehicles. IEEE Trans. Veh. Technol. 2012, 61, 3475–3489. [CrossRef]
11. Singh, B.; Singh, B.N.; Chandra, A.; Al-Haddad, K.; Pandey, A.; Kothari, D.P. A review of single-phase improved power quality AC-DC converters. IEEE Trans. Ind. Electron. 2003, 50, 962–981. [CrossRef]
12. Musavi, F.; Eberle,W.; Dunford,W.G. A High-Performance Single-Phase Bridgeless Interleaved PFC Converter for Plug-in Hybrid Electric Vehicle Battery Chargers. IEEE Trans. Ind. Appl. 2011, 47, 1833–1843. [CrossRef]
13. Kushwaha, R.; Singh, B. A Modified Luo Converter-Based Electric Vehicle Battery Charger with Power Quality Improvement. IEEE Trans. Transp. Electrif. 2019, 5, 1087–1096. [CrossRef]
14. Watson, N.;Watson, R.; Paterson, T.; Russell, G.; Ellerington, M.; Langella, R. Power Quality of a bidirectional Electric Vehicle charger. In Proceedings of the 2020 19th International Conference on Harmonics and Quality of Power (ICHQP), Dubai, United Arab Emirates, 6–7 July 2020; pp. 1–5. [CrossRef]
15. Dubey, A.; Santoso, S. Electric Vehicle Charging on Residential Distribution Systems: Impacts and Mitigations. IEEE Access 2015, 3, 1871–1893. [CrossRef]
16. Gray, M.K.; Morsi, W.G. Power Quality Assessment in Distribution Systems Embedded with Plug-In Hybrid and Battery Electric Vehicles. IEEE Trans. Power Syst. 2015, 30, 663–671. [CrossRef]
17. Leou, R.C.; Su, C.L.; Lu, C.N. Stochastic Analyses of Electric Vehicle Charging Impacts on Distribution Network. IEEE Trans. Power Syst. 2014, 29, 1055–1063. [CrossRef]
18. Sivaraman, P.; Sharmeela, C. Chapter 5—Power quality problems associated with electric vehicle charging infrastructure. In Power Quality in Modern Power Systems; Sanjeevikumar, P., Sharmeela, C., Holm-Nielsen, J.B., Sivaraman, P., Eds.; Academic Press: Cambridge, MA, USA, 2021; pp. 151–161.
19. Clement-Nyns, K.; Haesen, E.; Driesen, J. The Impact of Charging Plug-In Hybrid Electric Vehicles on a Residential Distribution Grid. IEEE Trans. Power Syst. 2010, 25, 371–380. [CrossRef]
20. Baraniak, J.; Starzy ´nski, J. Modeling the Impact of Electric Vehicle Charging Systems on Electric Power Quality. Energies 2020, 13, 3951. [CrossRef]
21. Wang, L.; Qin, Z.; Slangen, T.; Bauer, P.;Wijk, T.v. Grid Impact of Electric Vehicle Fast Charging Stations: Trends, Standards, Issues and Mitigation Measures—An Overview. IEEE Open J. Power Electron. 2021, 2, 56–74. [CrossRef]
22. Wang, X.; Blaabjerg, F. Harmonic Stability in Power Electronic-Based Power Systems: Concept, Modeling, and Analysis. IEEE Trans. Smart Grid 2019, 10, 2858–2870. [CrossRef]
23. Kazibwe, W.E.; Ringlee, R.J.; Woodzell, G.W.; Sendaula, H.M. Power quality: A review. IEEE Comput. Appl. Power 1990, 3, 39–42. [CrossRef]
24. Qin, Z.; Wang, L.; Bauer, P. Review on Power Quality Issues in EV Charging. In Proceedings of the 2022 IEEE 20th International Power Electronics and Motion Control Conference (PEMC), Brasov, Romania, 25–28 September 2022; pp. 360–366. [CrossRef]
25. Srivastava, M.; Goyal, S.K.; Saraswat, A.; Shekhawat, R.S.; Gangil, G. A Review on Power Quality Problems, Causes and Mitigation Techniques. In Proceedings of the 2022 1st International Conference on Sustainable Technology for Power and Energy Systems (STPES), 26. Srinagar, India, 4–6 July 2022; pp. 1–6. [CrossRef]
26. IEEE Std 519-2014 (Revision of IEEE Std 519-1992); IEEE Recommended Practice and Requirements for Harmonic Control in Electric Power Systems. IEEE: New York, NY, USA, 2014; pp. 1–29. [CrossRef]
27. Engineering Recommendation G5/4-1. 2005. Available online: https://www.nienetworks.co.uk/documents/d-code/ distribution-system-security-and-planning-standard/ena_er_g5_issue_4_amendment_1_(2005).aspx (accessed on 3 June 2023).
28. Emanuel, A.E.; Langella, R.; Testa, A. Limiting low frequency interharmonic distortion and voltage fluctuations. In Proceedings of the IEEE PES General Meeting, Minneapolis, MN, USA, 25–29 July 2010; pp. 1–6. [CrossRef]
29. Testa, A.; Langella, R. Power system subharmonics. In Proceedings of the IEEE Power Engineering Society General Meeting, San Francisco, CA, USA, 16 June 2005; Volume 2233, pp. 2237–2242. [CrossRef]
30. The Network Code. 2013. Available online: https://www.enemalta.com.mt/wp-content/uploads/2018/05/Network-Code- EMC-Approved-October-2013-1.pdf (accessed on 3 June 2023).
31. EN 50160:2001; Voltage Characteristics of Electricity Supplied by Public Distribution Systems. CENELEC: Brussels, Belgium, 2001.
32. Clement, K.; Haesen, E.; Driesen, J. Coordinated charging of multiple plug-in hybrid electric vehicles in residential distribution grids. In Proceedings of the 2009 IEEE/PES Power Systems Conference and Exposition, Seattle, WA, USA, 15–18 March 2009; pp. 1–7. [CrossRef]
33. Mukherjee, J.C.; Gupta, A. A Review of Charge Scheduling of Electric Vehicles in Smart Grid. IEEE Syst. J. 2015, 9, 1541–1553. [CrossRef]
Author Contributions: Conceptualization, K.S. (Kris Scicluna); software, K.S. (Kris Scicluna); validation, K.S. (Kris Scicluna), B.A. and K.S. (Kurt Spiteri); formal analysis, K.S. (Kris Scicluna), B.A. and K.S. (Kurt Spiteri); investigation, K.S. (Kris Scicluna), B.A. and K.S. (Kurt Spiteri); resources, K.S. (Kris Scicluna), B.A. and K.S. (Kurt Spiteri); data curation, K.S. (Kris Scicluna); writing—original draft preparation, K.S. (Kris Scicluna); writing—review and editing, K.S. (Kris Scicluna) and B.A.; project administration, B.A.; funding acquisition, B.A. All authors have read and agreed to the published version of the manuscript.
Funding: This work was supported in part by the European Commission H2020 TWINNING Networking for Excellence in Electric Mobility Operations (NEEMO) Project under grant 857484.
Data Availability Statement: At this moment the raw data presented in this paper is not available publicly beyond what presented in graphical form in this paper.
Conflicts of Interest: The authors declare no conflict of interest.
Source & Publisher Item Identifier: Energies 2023, 16, 5673. https://doi.org/10.3390/en16155673. URL: https://www.mdpi.com/1996-1073/16/15/5673
