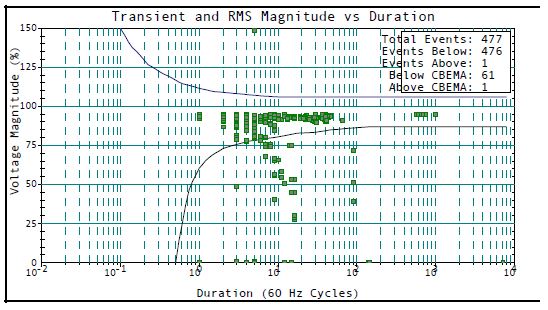
Previous Image Next Image figure-2-magnitude-duration-scatter-plot-for-all-the-monitors-in-the-facility-1992-1993