Published by 1. Wichet THIPPRASERT, 2. Annop RUPDEE, Department of Electrical Engineering, Faculty of Engineering, Rajamangala University of Technology Lanna Chiang Rai, 99 Sai Khao, Phan, Chiang Rai, 57120, Thailand. ORCID: 1. https://orcid.org/0000-0002-7773-4331; 2. https://orcid.org/0000-0002-1657-870X
Abstract. This research is aimed to test the high voltage (HV) polymeric insulators to study Electrical Performance and deterioration at the insulator’s surface under the wheel test conditions. The samples of this research are four new silicone rubber with fiber-reinforced plastic rod insulators, FXB 22/70 model 22 kV that randomized from the commercial market in Thailand. The experiments in this research are the IEC/TR 62730 standards HV polymeric insulators for indoor used tracking wheel test. The results found that the samples’ resistance before and after the wheel test of 30,000 cycles has the lower resistance of 10 mm distance on the samples of 37.0 and 7.76 GΩ, respectively. The sample resistances were higher than 2 MΩ resistances, less than 3 mm erosion depth, and no punctured on the shed, housing, or interface that the criteria of the IEC/TR 62730 standards are accepted. Further, the hydrophobicity of the samples before and after the treatment were reduced from HC 1 to HC 6 that classified use STRI’s guide. The average leakage currents of the first 10,000 and 30,000 cycle’s wheel test were 0.037 mA and 0.074 mA, respectively. While, after 6,000 cycles of the test, the thermography showed that the areas at the end of insulator near the ground terminal were higher temperature than other, else after 30,000 cycles test, the insulator’s temperatures were higher at the core rod. Furthermore, the 1000x SEM photography shown that the three punched samples of the insulator’s surfaces of the new were smooth. After 15,000 cycles, the skins have aging than more and deeper textures after 30,000 cycles testing. Besides, the Fourier transform infrared spectroscopy found that the ATH of the samples before and after the treatment was reduced from 3,445.4 cm-1 to 3,367.8 cm-1, while other composites were not significantly different. Also, the results of low frequency dry flashover voltages of new and tested samples were 133.8 and 140.0 kV, respectively. The low frequency wet flashover voltages of before and after the wheel tested was 115.5 and 107.3 kV, respectively. Finally, the impulse flashover voltage test shown that the positive “polarity lightning impulse voltages of the new and tested samples were 235.4 and 231.53 kV, and the negative” polarity lightning impulse voltages were 261.9 and 256.4 kV, respectively.
Streszczenie. Niniejsze badanie ma na celu przetestowanie izolatorów polimerowych wysokiego napięcia (WN) w celu zbadania wydajności elektrycznej i pogorszenia się powierzchni izolatora w warunkach testu koła. Próbki z tego badania to cztery nowe gumy silikonowe z izolatorami prętowymi z tworzywa sztucznego wzmocnionego włóknami, model FXB 22/70 22 kV, które zostały losowo wyselekcjonowane z rynku komercyjnego w Tajlandii. Eksperymenty w tych badaniach to zgodne z normą IEC/TR 62730 polimerowe izolatory wysokiego napięcia do badań metoda karuzelowa w pomieszczeniach. Wyniki wykazały, że rezystancja próbek przed i po teście kołowym 30 000 cykli ma mniejszą rezystancję odległości 10 mm na próbkach odpowiednio 37,0 i 7,76 GΩ. Rezystancje próbki były wyższe niż rezystancje 2 MΩ, głębokość erozji mniejsza niż 3 mm i brak przebicia na osłonie, obudowie lub interfejsie, zgodnie z kryteriami normy IEC/TR 62730. Co więcej, hydrofobowość próbek przed i po obróbce została zmniejszona z HC 1 do HC 6, które sklasyfikowano według przewodnika STRI. Średnie prądy upływu pierwszego testu koła 10 000 i 30 000 cykli wynosiły odpowiednio 0,037 mA i 0,074 mA. Podczas gdy po 6000 cykli testu termografia wykazała, że obszary na końcu izolatora w pobliżu zacisku uziemienia miały wyższą temperaturę niż inne, w przeciwnym razie po 30 000 cyklach testu temperatury izolatora były wyższe na rdzeniu pręta. Co więcej, fotografia 1000x SEM pokazała, że trzy próbki wycięte (przygotowane) powierzchni nowego izolatora były gładkie. Po 15 000 cykli skóra starzeje się bardziej i głębsze tekstury po 30 000 cyklach testowania. Poza tym spektroskopia w podczerwieni z transformacją Fouriera wykazała, że ATH próbek przed i po obróbce zmniejszyło się z 3445,4 cm-1 do 3367,8 cm-1, podczas gdy inne kompozyty nie różniły się istotnie. Również wyniki napięć suchego przeskoku niskoczęstotliwościowych próbek nowych i badanych wyniosły odpowiednio 133,8 i 140,0 kV. Napięcia przebicia mokrego o niskiej częstotliwości przed i po badanym kole wynosiły odpowiednio 115,5 i 107,3 kV. Wreszcie, test napięcia udarowego przeskoku wykazał, że dodatnie „napięcia udaru piorunowego polaryzacji nowych i badanych próbek wyniosły 235,4 i 231,53 kV, a ujemne” napięcia udaru piorunowego polaryzacji wyniosły odpowiednio 261,9 i 256,4 kV. (Wydajność elektryczna izolatora kompozytowego zgodnie ze standardowym testowaniem IEC / TR 62730 dla systemu dystrybucji 22 kV)
Keywords: Composite Insulator, Tracking Wheel Test, Electrical Performance.
Słowa kluczowe: Izolator kompozytowy, Metoda karuzelowa, Właściwości elektryczne.
Introduction
Insulators play important role for proper performance of transmission and distribution lines for power systems. Insulators are varied by design, types of voltages and types of material used for production of insulators. The exact insulators are installed in appropriate power system based on type of voltage. The insulators work in outdoor; they endure some influences which come from rain, fog, snow, sunlight, pollution, corrupt electric dust and salinity in the air. Therefore the basic demands of insulator are that they own enough electric insulated strength; they can support stated mechanical load; they can endure disadvantage environment and atmosphere effect. The tremendous growth in the application of non-ceramic composite insulators is due to their advantages over the traditional ceramic and glass insulators. The advantages are light weight, resistance to vandalism, better performance in the presence of heavy pollution in wet conditions and better withstand voltage [1] than porcelain insulators.
Withstand ability of insulators under polluted conditions are some of the most important factors, which determine the insulation level of distribution system.
The continuous operation of distribution system mainly depends on the environment and weather conditions, insulation design, which may cause flashover on polluted insulators leading to system outages, if the design is inadequate. Most insulators are used outdoors, on high voltage overhead distribution lines and in substations, and are required to withstand extreme changes in environmental conditions[1],[2].
Therefore to guideline for solving problems above, in this work to study electrical performance of HV polymer insulation for tracking indoor and outdoor applications and erosion by testing wheels used to provide general indications about the quality of design and materials related to stresses that occur in pollution environments. This test is based on the IEC 62730 standard.

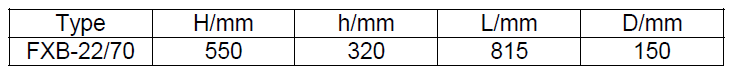
Table 1. Parameter of tested Composite Insulators
Test Specimens
The test specimen is a FXB-22/70 composite insulator, Its structural parameters and structure schematic diagram are shown in Fig. 1 and Tab. 1, H is the structure height, h is arc distance, L is creepage distance, and D is diameter distance.
Tracking Wheel test and Test Procedure
The IEC method is based on simultaneous testing of four specimens, mounted on a “wheel”, as shown in Fig. 2. During the test the specimens go in one cycle through four positions, where they remains stationary for approximately 40 s. In the first part of the cycle, the insulator is dipped into a saline solution. The second part of the test cycle permits the excess saline solution to drip off the specimen. In the third part the specimen is connected to a power frequency voltage. In the last part of the cycle the surface of the specimen that has been heated by the arcing discharges is allowed to cool. The main test parameters are listed in Tab. 1. The IEC standard [3] required that the total test voltage will be 28.6 V/mm multiplied by the creepage distance. The creepage distance of the tested composite insulator was estimated as 815 mm.
This test was performed at 20 ± 5 °C salinity and 1.40 kg/m3 ± 0.06 kg/m3 under 23.3 kV electrical stresses in accordance with the wheel test of IEC/TR 62730 [3]. This is a well-established standard technique, and the data presented is specifically applicable to the polymeric insulators and silicone rubber materials [2].

1) Water Tank 1.6 m3 2) Composite Insulators 3) High Voltage
4) Structure 5) HV Bussing 6) Motor and Control set
For salt solution will need to change the salt solution used to dip insulators 1 times a week so that each week there is a break (Interruption period) for checking insulators. During this test break must not exceed 1 hour and will not be included in the total testing period. In addition, there can be 1 longer period of normal suspension than 60 hours and 1 additional test period The additional wheel for 3 times the total duration of the test stop test report must record all test intervals. In Fig. 3 is shown model of test setup according to IEC standard[3],[4].
Table 2. Test parameters in standard IEC test procedure [3]

Results Analysis and Discussion
During the initial phase of the study involving the accelerated aging tests performed on the 22 kV composite insulators, the level of salt deposition on the surface of insulators was low. The parameters to be studied and analysed like the dissipation factor and leakage current showed low values. However, from the transition periods up until the completion of 30,000 cycles, the polymer insulators showed considerable changes in the above mentioned parameters.
Insulation Resistance Surface of Composite Insulator Measurement
The surface insulation resistance was measured under 4 cases; Top, Middle, Bottom and Overall. In each case, the measurement was made between 2 points and follows; Top, Middle and Bottom: Two adjacent points at the top or Middle or Bottom of the insulator, with 5 mm to 10 mm spacing interval. And Overall: The topmost and the bottommost points of the test object, as shown in Fig. 4. At ambient temperature 29.2 °C, Relative humidity 70.1 % and atmospheric pressure 100.858 kPa.

According to IEC/TR 62730 Standard the test is regarded as pass, if on both test specimens: Not tracking, (a Meg Ohm-meter shall be applied along any suspect path, using 1 kV DC or higher. The probes shall be between 5 mm to 10 mm a part. A resistance of less than 2 MΩ shall constitute failure), For Composite Insulators: erosion shall not reach the core and in any case the erosion depth shall be less than 3 mm, resin insulators: erosion depth is less than 3 mm. And not shed, housing or interface is punctured [3].
Table 3. Insulation resistance surface
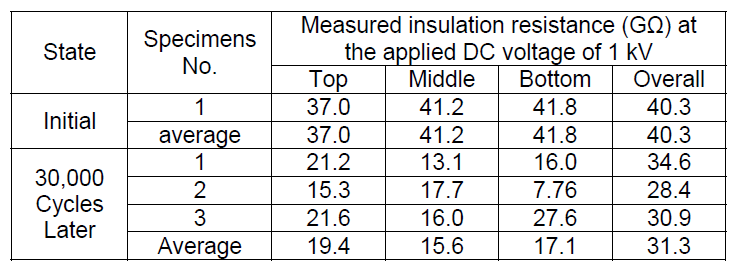
Surface insulation resistance testing of composite insulator at Top, Middle, and Bottom or Overall, it is reduced more than 68.2 percent’s of Middle specimens shown in Tab. 3. When observed and analyzed by SEM technique to evaluate the performance and degradation of Composite Insulators in Fig.5 and Fig. 6. The result showed in Fig. 6 the EDAX spectra of untreated fresh sample without pollution (a) and after test 30000 cycle (b). Fig. 6 (b) present chemical composition analysis then treated insulator sample, found that the surface sample increase oxygen percentage and the carbon percentage decreased compared with the bulk samples. It was hypothesized and demonstrated that the methyl groups were oxidized into O-H groups in these surface structure regions with moisture (H2O) and surface composite insulator was the backbone polymer was formed by chain of carbon atom which carbon had decreased from electrical discharge.

The other chemical content of external pollutant materials collected from the surface. This material includes elements such as calcium, aluminum and iron.
Additionally, detached material from the insulator’s steel grading ring, such as zinc from the galvanization layer and iron, is also present. Environmental salts such as chloride, and magnesium are also present. These pollutants, in the presence of moisture, contribute greatly to the increase in the conductivity of the insulator surface, hence increasing frequency of corona discharges. Deterioration in insulation properties and increase in surface conductivity of the insulator cause increasing corona discharge intensity and frequency. Such increase in conductivity is mainly due to accumulated contaminants such as salts, earth materials and other pollutants [5],[6],[7].
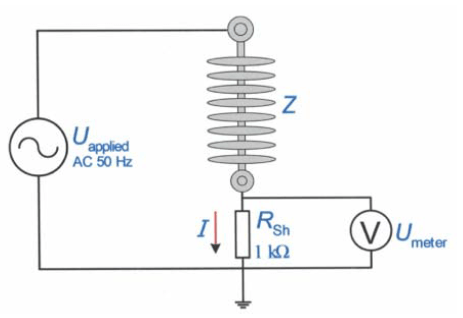
Impedance measurement of Composite Insulator
Impedance measurement of composite insulators testing at ambient temperature 29.6 C, relative humidity 69.1 % and atmospheric pressure 100.885 kPa.
At 30,000 cycles testing, insulation resistance of composite insulator reduced by 11.69% shown in Tab. 4. It is deterioration in insulation properties and increase in surface conductivity of the insulator cause increasing corona discharge intensity and frequency. Such increase in conductivity is mainly due to accumulated contaminants. When receiving high voltage therefore causing some discharges Resulting in an increased leakage current which results in the heat of the contaminated wet insulation surface in Fig.8.

p1 (a) And after test 30,000 cycles: p2 (b)
Table 4. Impedance measurement of composite insulators at 30,000 cycles testing
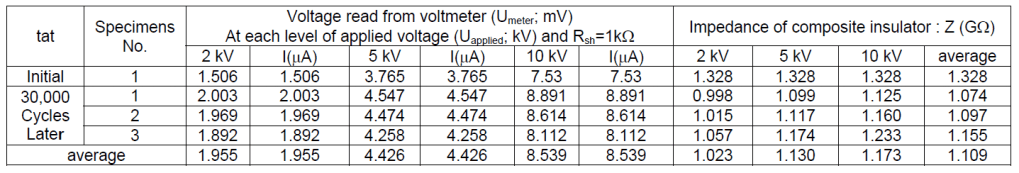
Table 5. Power-frequency Dry flashover voltage test

Table 6. Power-frequency Wet flashover voltage tests
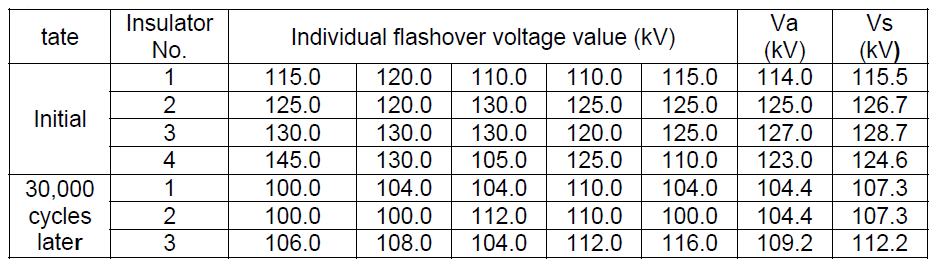
where :Va : Average value of voltage under actual test condition; Vs : Voltage under standard atmospheric condition
Table 7. Lightning Impulse Wet Flashover Voltage Test

Where V50 : Calculation of 50% disruptive voltage, Va : V50 Under actual test condition; Vs : V50 Under standard atmospheric condition

At 30,000 cycles testing, insulation resistance of composite insulator reduced by 11.69% shown in Tab. 4. It is deterioration in insulation properties and increase in surface conductivity of the insulator cause increasing corona discharge intensity and frequency. Such increase in conductivity is mainly due to accumulated contaminants. When receiving high voltage therefore causing some discharges Resulting in an increased leakage current which results in the heat of the contaminated wet insulation surface in Fig.8.
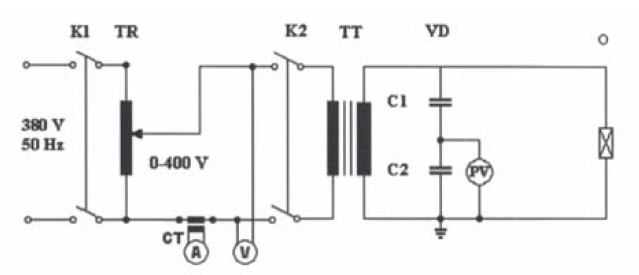
Power frequency Flashover Voltage Test
According to IEC Standard[3]. Fig.9 test circuit consist of K1: Circuit breaker, KM2-F-800 Frame, KM2-T500 Trip unit, TR: Regulating transformer “HIPOTRONICS, INC” 380/0- 400V, CT: Current transformer 100T, W/R 365/U core, ratio 500/5 A, A: Ammeter for output regulating transformer “WESTON” type 1944, 5 A, W/0-500 VAC, V: Voltmeter for output regulating transformer “API” type 7045-50Ua, 5A, W/0-500 VAC, K2: Secondary contactor “ASEA” EG 315 size 5, TT: Testing transformer “HIPOTRONICS, INC” model 7300-150,150 kVA, 400V/0-300 kV, VD: Voltage divider, bushing “LAPP” style POC-A, C1 = 382 pF ,C2 = 2146 pF, PV: AC Peak voltmeter “API” type 7045-50Ua, W/0-60/120/320 kV and O: Object under test.
Lightning Impulse Wet Flashover Voltage Test
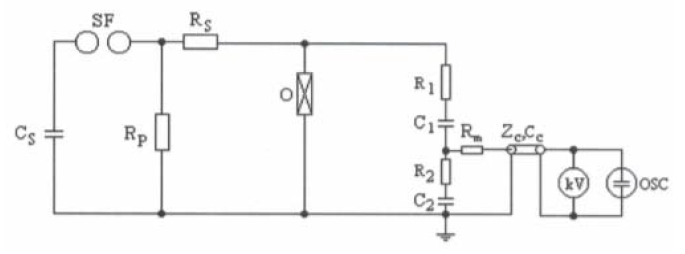
Lightning impulse wet flashover voltage test circuit consist CS: Charging capacitor, SF: Spark gap, RP: Parallel resistor, RS: Series resistor, CL: Load capacitor, O: Test object, R1: H.V. arm resistor of voltage divider, C1: H. V. arm capacitor of voltage divider, R2: L.V. arm resistor of voltage divider, C2: L.V. arm capacitor of voltage divider, Rm: Matching resistor 75 Ω, ZC: Measuring cable “ZUHNER” 75 Ω 30 m, CC: Measuring cable capacitance 67 pF/m, kV: Impulse peak voltmeter “HAEFELY” Model SV642, OSC: Digitizing recorder “High Volt” Model “HiRES Digital Recorder” in Fig.10. At 100.712 kPa, 30.3°C, atmospheric pressure 100.7 kPa, Humidity 71.0 %, 0.905 inHg, 21.9 g/m3. Calculation of 50 % disruptive discharge voltage V50.
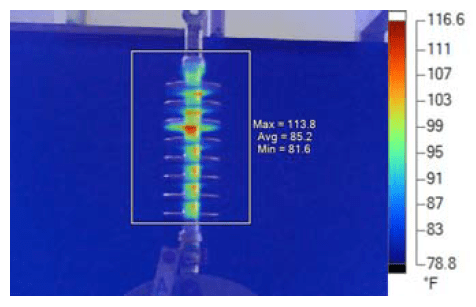
Electrical Discharge Phenomenon
During the test cycles, the contaminant deposition occurs on the surface of the polymer insulator. This causes an increase of leakage current and electric discharge which results in corona discharge and heating of the wet contaminated insulator surface by inequalities due to the mold shown in Fig. 11 and Fig.12. The dielectric loss of the surface layer of silicone rubber under alternating electric field is the main cause of local temperature rise of the composite insulator.

During the application of the test voltage the leakage current causes the evaporation of water on part of the surface. This causes dry band arcing on the surface of the polymer insulators. Frequent occurrence of such electrical discharge causes erosion and tracking of composite insulators. The results showed that the composite insulator would appear abnormal heating under the ageing condition of high temperature, high humidity and salt fog[6],[7].
Electrical Performance Testing
At 30,000 cycles Test, in order to check up the specimens electric character, the dry power flashover, the wet power flashover and the impulse power test are carried out to them shown in Fig.13-15 respectively. The results shown in Tab. 5-7, the surfaces of the samples have no obvious crack and dilapidation. Though after 30,000 cycles test, all samples still rather higher electromechanical properties.

The dry power flashover and wet power flashover test results are shown in the Tab. 5 and Tab. 6. After 30,000 cycles test , the dry flashover is close to that’s the former, hut the wet flashover decrease about 17.8% on the average, which is still higher than the 22 kV the voltage of which were put on the samples during the cycles test shown in Tab. 6.
The wet flashover voltage decreased linearly under the improved multi-stress ageing condition, while the hydrophobicity of the shed showed a nonlinear ageing characteristics, whose change rate increased gradually. The hydrophobicity loss caused by moisture absorption of silicone rubber causes the static contact angle cannot reflect the wet flashover characteristics of the composite insulator directly.


Lightning Impulse Flashover Voltage Test
Typical lightning impulse discharge processes of composite shown in Fig. 15. The flashover channel of the composite insulator is a convex arc and outward slightly in the air around the insulator and the discharge path of the composite insulator is in the air gap. All the samples passed through the impulse power test, which were put on the impulse power with positive polarity and negative polarity five times respectively shown in Tab.7.
Conclusion
In this paper to study electrical performance of HV composite insulator for tracking indoor and outdoor applications and erosion by testing wheels at 30,000 cycles later testing. The conclusions are given as follows:
1. Insulation resistance surface testing of Composite Insulator is reduced more than 68.2%. These pollutants such as calcium, aluminum and iron, in the presence of moisture, contribute greatly to the increase in the conductivity of the insulator surface, hence increasing frequency of corona discharges. Deterioration in insulation properties and increase in surface conductivity of the insulator cause increasing corona discharge intensity and frequency. Such increase in conductivity is mainly due to accumulated contaminants such as salts, earth materials and other pollutants. The dielectric loss of silicone rubber after moisture absorption can effectively reflect the moisture absorption characteristics and the dielectric properties of the material after moisture absorption.
2. Hydrophobicity of a material can be described using SEM technique to evaluate the performance and degradation of the material. The surface of the sample become very rough, and defects such as minute holes and cracks appeared, and large amount of minute particles adhered. Because surface conductivity of the insulator cause increasing corona discharge intensity and frequency.
3. Leakage current is directly proportional to hydrophobicity loss. The more is the hydrophobicity loss, the more the leakage current become, see e.g.[1],[2],[6],[7]. The dielectric loss of the surface layer of silicone rubber under alternating electric field is the main cause of local temperature rise of the composite insulator.
4. Power frequency dry and wet flashover voltage test. The dry flashover is close to that’s the former, but the wet flashover decrease about 17.8% on the average. The wet flashover voltage decreased linearly under the improved multi-stress ageing condition, while the hydrophobicity of the shed showed a non-linear ageing characteristics, whose change rate increased gradually.
5. Lightning impulse flashover voltage test, all the samples passed through the impulse power test.
Acknowledgements – This research was supported and funded by faculty of engineering, Rajamangala university of technology Lanna Chiang Rai, Chiang Rai, Thailand.
REFERENCES
[1] Rahul C, Studies on Silicone Rubber Insulators used for High Voltage Transmission (Master’s Thesis, Department of Electrical Engineering, Indian Institute of Scienc, 2017), 4-5.
[2] Kuffel E, Zaengl W.S, and Kuffel J, High Voltage Engineering: Fundamentals” 2nd Ed., Newnes, (2000), 522-528.
[3] “IEC/TR 62730” HV polymeric insulators for indoor and outdoor use tracking and erosion testing by wheel test and 5000 h test, (2012).
[4]. “IEC 62217” Polymeric insulators for indoor and outdoor use with a nominal voltage greater than 1000V – general definitions, test methods and acceptance criteria, 2012.
[5] Thong-Om S, Payakcho W, Grasaesom J, Oonsivilaiand A and Marungsri B, Comparison Ageing Deterioration of Silicone Rubber Outdoor Polymer Insulators in Artificial Accelerated Salt Fog Ageing Test, World Academy of Science, Engineering and Technology International Journal of Chemical, Molecular, Nuclear, Materials and Metallurgical Engineering, 5(2011).
[6] Zhang Z, Liang T, Jiang X, Li C, Yang S, and Zhang Y, Characterization of Silicone Rubber Degradation Under Salt-Fog Environment With AC Test, IEEE Trans., 7(2019), 66714 -66724.
[7] Chengrong L, Xiaoming H and Linjie Z. Image, Analysis on the Surface Hydrophobicity of Polluted Silicone Rubber Insulators. International Conference on Condition Monitoring and Diagnosis, Beijing, China (2008), 1-4.
Authors: Asst.Prof.Wichet THIPPRASERT, Department of Electrical Engineering, Faculty of Engineering, Rajamangala University of Technology Lanna Chaing Rai, Chiang Rai, Thailand. Annop RUPDEE, Working toward M.Eng. in Electrical Engineering, Department of Electrical Engineering, Faculty of Engineering, Rajamangala University of Technology Lanna Chiang Rai, Chiang Rai, Thailand.
Source & Publisher Item Identifier: PRZEGLĄD ELEKTROTECHNICZNY, ISSN 0033-2097, R. 98 NR 2/2022. doi:10.15199/48.2022.02.08
