Published by Felix KALUNTA1, Tolulope AKINBULIRE2, Frank OKAFOR3, Federal Institute of Industrial Research, Lagos (1), University of Lagos (2,3)
Abstract. A hybrid technique for the analysis of series resonance in power network with aggregate harmonic sources is hereby presented. It involves the identification of resonant modes using admittance scan and computation of network currents at the generated harmonic frequencies with cable capacitance included by the creation of dummy loops. The computed cable currents when compared with the corresponding current capacity indicate the amplification of current during resonance.
Streszczenie. Przedstawiono hybrydową technikę analizy rezonansów szeregowych w sieci elektroenergetycznej z zagregowanymi źródłami harmonicznych. Polega ona na identyfikacji modów rezonansowych za pomocą skanowania admitancji i obliczania prądów sieci przy generowanych częstotliwościach harmonicznych z uwzględnieniem pojemności kabla poprzez tworzenie pętli pozornych. Obliczone prądy kabla w porównaniu z odpowiednią pojemnością prądową wskazują na wzmocnienie prądu podczas rezonansu. (Analiza rezonansu szeregowego w sieciach dystrybucyjnych z zagregowanymi źródłami harmonicznych)
Keywords: kron reduction; loop admittance scan; loop current analysis; series resonance.
Słowakluczowe: rezonans szeregowy, analiza prądu, harmoniczne.
Introduction
In a radial network involving capacitor banks and nonlinear loads, there is the possibility of series resonance at some frequencies generated by the harmonic producing load leading to current amplification and overloading of power installation [1]. Harmonic filters which are deployed to block the injection of harmonics have proved to be insufficient in curbing the menace of series resonance. Hence, additional precautionary measure like de-rating of all the equipment exposed to resonance threat has been recommended by researchers as a way of accommodating the residual harmonic currents left behind after harmonic filtering [2, 3]. Wrong choice of tuning frequencies is a major cause of deficiency in the deployment of filters because research is still ongoing to develop suitable corrective measures for series resonance [4]. Available techniques such as impedance scan, modal analysis and modal sensitivity method have proved efficacious only for parallel resonance analysis. Some research results on the adaptation of modal analysis to series resonance computations are available in literature [5,6]. However, such method is complicated, and focused only on the determination of network resonant modes without investigating the impact of dominant harmonic frequencies generated by the non-linear loads. The challenge now is to determine the actual frequencies at which series resonance may occur and the level of amplification attained when aggregate harmonic sources are involved.
This paper adopts a combination of admittance scan [7] and mesh current analysis in harmonic domain to determine the indices that characterize series resonance. The method is based on the idea that the occurrence of series resonance depends on the magnitude of harmonic currents generated by the non-linear loads as well as the frequency response characteristics of the network elements. The loop admittance scan is modified by creating dummy loops to represent the inclusion of cable capacitance, in order to capture the dominant frequencies with greater accuracy. The resonant modes whose frequencies coincide with the dominant harmonics generated by the non-linear load are selected as the desired tuning frequencies of the filter. Subsequently, the cable currents are evaluated at each of these dominant frequencies to determine the effective root mean square current as well as the amplification factor. This is necessary for the de-rating of network equipment exposed to series resonance threat.
Procedure for the series resonance analysis
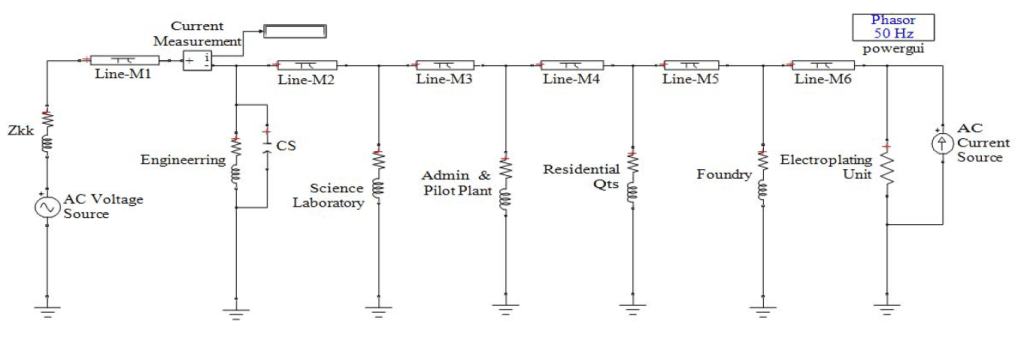
The radial power network in Fig.1 belonging to the Federal Institute of Industrial research Oshodi, Lagos, Nigeria is used as the case study for the demonstration of the proposed method [8]. The equivalent circuit is shown in Fig.2 for more illustration.

The characteristic parameters of the network elements required for the resonance analysis are listed as follows.
Public Utility Supply Ratings: 11kV, 1MVA, 50Hz, Internal connection: Yg, Source resistance=0.893Ω, Source inductance= 16.58 x 10⁻⁶H.
Cable Parameters: Current rating = 170A, Insulation thickness = 5.6 mm, CSA=70 mm2, Resistance/ph/km= 0.54Ω, Inductance/ph/km=8.02 x 10-3H, Capacitance/ph/km = 5.6 x 10⁻⁶ F
Load Parameters: The power utilization at each load centre are presented in Table1, while Table 2 shows the harmonic spectrum of electroplating equipment emanating from the Fourier Transform of the three phase full wave rectifier current performed in a Matlab Simulink environment.
The procedure is hereby outlined. (i) An isolated circuit of the aggregate non-linear load (the electroplating unit) connected directly to the power supply is simulated to determine the instantaneous current vector.
This vector is subjected to Discrete Fourier Transform, and subsequently the harmonic magnitudes are expressed in percentage of the fundamental (see Table 2).
Table 1. Total Power consumption at each load centre
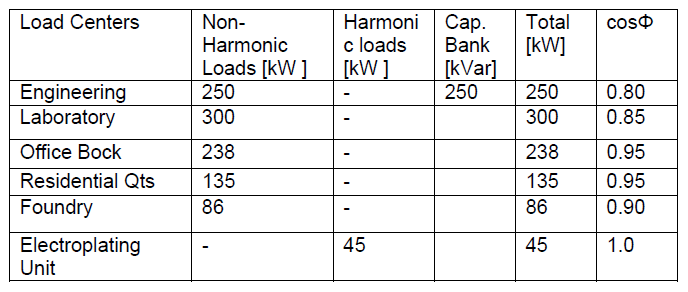
Table 2. Harmonic table for the three phase 6-pulse rectifier used in the Electroplating unit

(ii) The aggregate non-linear load is represented by a harmonic voltage source in series with its load impedance. The voltage magnitudes are calculated at the dominant frequencies in Table 2 using equation (1).
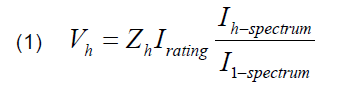
Z – impedance of non-linear Load at h-th frequency; Irating – Current rating of non‐linear load; Ih-spectrum – harmonic Current at h‐th frequency; I1 –spectrum – fundamental current of the non‐linear load, h – harmonic order
(iii) The detailed procedure for conducting admittance scan is described in [7]. The network is partitioned along the point of common coupling between the consumer distribution network and public utility supply. The consumer side of the network is modeled at each resonant frequency h, and the system supply side is reduced to its Thevenin equivalent also at each resonant frequency. The driving point impedance at the supply section of the network is used as the source impedance of the supply voltage.

(iv) The loop impedance matrix is assembled in the absence of cable capacitances and capacitor banks to obtain Zold. Skin effect is accounted for by using (7) in computation of the resistance R of the cable at various discrete frequencies [5].

R1 – resistance of the cable at the fundamental frequency (v) The cable capacitances are subsequently added to the network using the π – equivalent model of a cable section. Dummy loops are created at each node where the shunt capacitances exist and assigned mesh numbers n+1, n+2,… n+m as indicated in Fig. 2. Extra rows and columns corresponding to the position of each dummy loop is added to the old impedance matrix to form a partitioned matrix as in (8).

n – number of network loops, m – number of dummy loops [A] – (n × m) matrix of branch impedances shared by each dummy loop and the actual loops adjacent to them [Q] – diagonal matrix of loop impedances of the respective dummy loops.
For a p-th dummy loop formed by parallel connection of the shunt capacitance Cp across a branch impedance Zp preceeding the actual loop k,

where p =1, 2, … , m and p=k
The entries are zero elsewhere in the matrices A and Q. ω – the fundamental frequency in radian/s
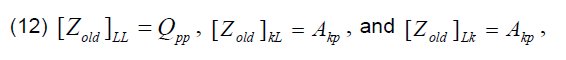
(vi) The dummy loops are eliminated from the network individual. For each dummy loop, the matrix old Z is expanded to include an (n+1)th row and (n+1)th column whose entries are obtained from the p-th column of matrix [A] as shown in (12). The p-th dummy loop is subsequently eliminated by a modified kron-reduction process described in (13) – (17) to obtain the updated matrix ZLoop .
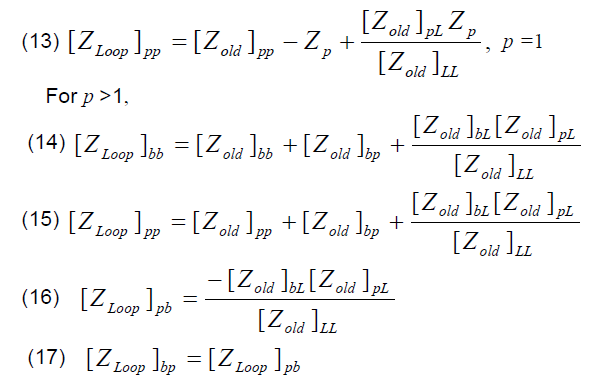
where: b=p-1
(vii) The ZLoop obtained from (12) – (17) is then considered as the current Zold in another cycle of expansion and subsequent kron-reduction to reflect the inclusion of the next dummy loop as described in steps (v) and (vi) above. The iterative process continues until all dummy loops are considered. The dummy loops connected across the voltage sources are avoided in this paper. The margin of error caused by this action is insignificant when dealing with aggregate sources.
The inverse matrix of ZLoop forms the loop admittance matrix whose diagonal elements are selected as self admittances needed for the frequency plot (admittance scan).
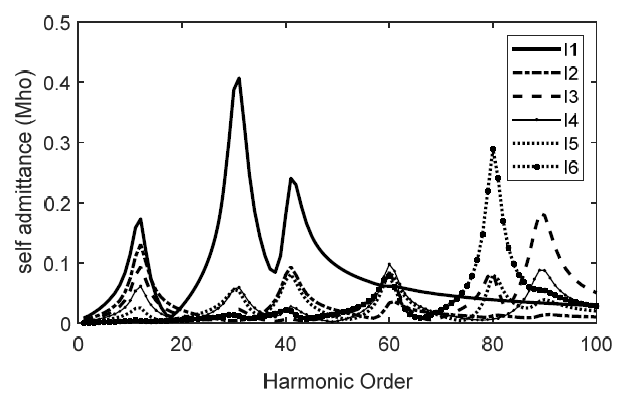
(viii) The admittance scan is the plot of self-admittances of all meshes against the harmonic orders. The peak frequencies in the curves constitute the series resonant modes of the network. They indicate the frequencies at which the amplification of mesh currents by resonance is possible. In the case study, the admittance scan was repeated for two different conditions namely: firstly by considering the effect of cable capacitance, and secondly by considering the effect of cable capacitance and skin effect.
(ix) The mesh analysis in harmonic frequency domain are also carried out using equation (18). The mesh current vector are calculated at the power frequency and repeated at each harmonic generated frequency, h (per unit)

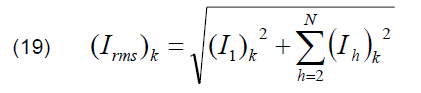
The root-mean-square value of mesh currents, Total Harmonic Distortion (THD) and the corresponding amplification factor at each mesh, k, are computed using (19), (20) and (21) respectively
Current amplification or amplification factor at k-th mesh is

Current amplification or amplification factor at k-th mesh is

The exact sequence of the described algorithm is represented in Fig. 3. The process was applied to the sample network and implemented with a Matlab Script. The de-rating factors to be applied on the current rating of the network elements in order to withstand the impact of resonance is the same as the amplification factor at the corresponding meshes.

Model Verification
The efficacy of the proposed method was verified using the Matlab Simulink as simulation software. The Simulink model of the equivalent circuit used for the simulation is shown in Fig. 4 with the harmonic generating load represented as a current source in parallel with a resistive load. The harmonic Simulation was carried out for five seconds to capture only the steady state values of the fundamental and harmonic components of the branch current and bus voltages. The simulations were iterated for each harmonic order generated by that load as they appear in Table 2. The amplified current, THD and amplification factors were the computed using (19) and (21).
Results and Discussions
The analysis of the sample network has revealed the desired tuning frequencies of the harmonic filter as well as the most suitable location of the filter in the network. The peaks of the curves in Fig. 5 and Fig.6 indicate the network resonant modes: representing the frequencies at which the mesh currents are subject to amplification. The results of the admittance scan on the sample network indicate the occurrence of resonant peaks at the various meshes M1 – M6. For instance the series resonant peaks for M1 occurred at h =13, 32 and 44 per unit with loop admittances 0.18, 0.54 and 0.19 respectively. The resonant peaks for M2 occurred at h =13 and 60 per unit while that of M3 is at h =13, 80 and 90 per unit. All these cannot amount to anything unless there are harmonic voltages generated at such frequencies. It is the peak frequencies which coincide with the dominant harmonic frequencies generated from the non-linear load that constitute the desired tuning frequencies of the harmonic filter to be deployed in the resonance mitigation. The curves in Fig. 6 portray the damping tendency of the skin effect in cables. These results affirm the position that only the cable capacitance contributes immensely to the shifting of resonant frequencies while the skin effect only reduces the magnitude of loop admittance but widens the frequency curve. Hence, in the evaluation of the resonance peaks, the contribution of skin effect can be neglected.
Comparing these results with the generated frequencies presented in Table 2 indicates that only two harmonics actually require some mitigation – these are h=11, and 13. They serve as the tuning frequencies of the harmonic filter. Hence, the deployment of a harmonic filter tuned to the frequencies 11p.u. (550Hz) and 13 p.u. (650Hz) is enough to mitigate any series resonance. The most appropriate location for this filter is between M1 and M2 which is also affirmed by the THD values in Table 3. The best choice is therefore M2. This decision is also affirmed by the magnitude of harmonic currents in Tables 3. Another alternative in the choice of the tuning frequencies of the harmonic filter is by selecting the frequencies of the harmonic mesh currents that are of significant magnitude. However, the application of the harmonic filter to achieve the attenuation of the dominant resonant frequencies is outside the scope of this study.
The purpose of this study is also to determine the derating factors which could be applied to the current rating of the cables in order to complement the effort of the harmonic filter in withstanding the impact of the residual harmonics. The rms value of the amplified current in the cable sections M1 – M6 were computed for this purpose as shown in Table 3. The rms value of the mesh currents and their respective amplification factors are shown in Table 3.

It is clearly indicated that all the meshes susceptible to series resonance could be sighted judging from the value of the Total Harmonic Distortion in the mesh currents. Although the consideration of skin effect in the calculations could mean a reduction in the resonant currents, but the increased bandwidth of resonance curves implies the greater chance of current amplification occurring within the neighbourhood of the resonant peaks. This necessitates its consideration when evaluating the harmonic mesh currents and the associated parameters. This idea is affirmed by the increased values of mesh currents and total harmonic distortions in Table 3. The amplification factors presented is a guide on locating the sections of the network that require de-rating of equipment.
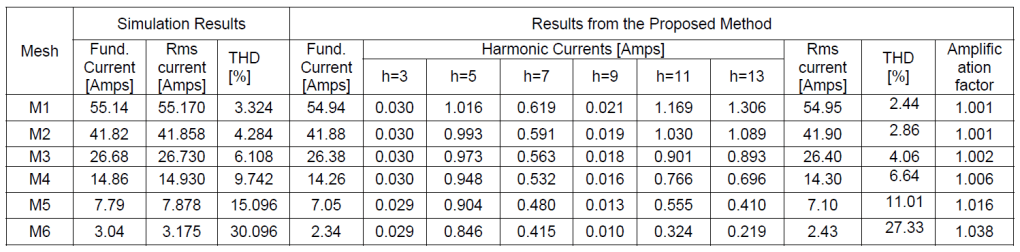
The results reveal that the transformers supplying the Foundry W/Shop and Electroplating unit and the distribution cables within their vicinity are seriously under threat and therefore require adequate correction in the desired amperage ratings. Computation of branch and mesh currents enables determination of de-rating factor for these cables, transformers and their insulators in order to withstand the effect of resonance. The amplification of cable currents are mostly higher in the vicinity of the harmonic generating source. The information displayed in Table 3 is also sufficient in affirming the efficacy the proposed technique. Comparing the cable currents and their corresponding THD values with the values obtained from Simulink simulation, it was observed that the two set of values are closely matched.
Table 3. Comparison between simulation results and that of the proposed method in respect of the amplification effect of series resonance on mesh currents, while considering cable capacitance and skin effect of power cables.
Conclusion
This paper has described the process of conducting admittance scan and mesh current analysis in harmonic domain as appropriate tools for the determination of indices for series resonance solution in distribution networks containing aggregate harmonic sources. It has also verified these tools using a typical case study by comparing the results obtained from the proposed method with those of the simulation in Simulink environment. The unique achievement in this study is the determination of series resonant frequencies of the network by a modified loop admittance scan, where dummy loops are created to treat independently the connection of shunt capacitors of power cables. The modified admittance scan captures all the dominant frequencies involved in series resonance with greater accuracy. This study will enable professional engineers involved in the design of the harmonic filter to determine the required tuning frequencies by selecting the resonant frequencies that coincide with any of the harmonic frequencies generated by the non-linear load, or the frequencies of the harmonic mesh currents that are of significant magnitude.
Notably, the study was restricted to radial networks. Another limitation is that the power supply network was reduced to its Thevenin equivalent with the internal impedance approximated at all harmonic frequencies. For small consumer networks the analysis can adequately produce the desired results to acceptable degree of accuracy. For large consumer premises the error margin may increase. Furthermore, the neglect of dummy loops created across voltage sources in mesh analysis is inconsequential in the case of aggregate sources under consideration. Further research shall explore ways of including such dummy loops when dealing with distributed harmonic sources.
REFERENCES
[1] K. Md Hasan, K. Rauma, A. Luna, J. Candela, and P. Rodriguez, “Harmonic Resonance Study for Wind Power Plant”, International Conference on Renewable Energies and Power Quality, ICREPQ (2012), Santiago de Compostela, Spain, 8th to 30th March 2012.
[2] K. Nisak, I. Candela, K. Rauma, J. R. Hermoso and A. Luna, “An Overview of Harmonic Analysis and Resonances of a Large Wind Power Plant”, Annual Conference of the IEEE IndustrialNHK Electronics Society,IECON (2011), 7–10 November 2011.
[3] C. Yang, K. Liu and D. Wang, “Harmonic resonance circuit’s modeling and simulation”, Power and Energy Engineering Conference, APPEEC 2009, ISBN: 978-1-4244-2486-3, Wuhan, China, 27–31 March (2009), pp. 1–5.
[4] Z. Huang, Y. Cui and W. Xu, “Application of Modal Sensitivity for Power System Harmonic Resonance Analysis”, IEEE Trans. on Power Systems, Vol: 22, No.1, Feb. (2007), pp. 222 – 231.
[5] C. Yang, K. Liu and Q. Zhang, “An Improved Modal Analysis Method for Harmonic Resonance Analysis”, IEEE International Conference on Industrial Technology,ICIT (2008), ISBN: 978-1- 4244-1705-6, Chengdu, China, pp.1–5.
[6] H. ZHOU, Y. WU, S. LOU and X. XIONG, “Power System Series Harmonic Resonance Assessment based on Improved Modal Analysis”, Journal Of Electrical & Electronics Engineering, Istanbul University, vol.7, No2, (2007), pp. 423 – 430.
[7] F. O. Kalunta and F. N. Okafor, “Power System Series Resonance Studies by Modified Admittance Scan”, Proceedings of the Joint IEEE International Symposium on Electromagnetic Compatibility and EMC Europe, Dresden Germany, August 16 – 22, 2015.
[8] F. O. Kalunta and F. N. Okafor, “ Harmonic Analysis of Power Networks Supplying Nonlinear Loads”, International Conference on Innovations in Engineering and Technology, IET (2011), Faculty of Engineering, University of Lagos, Nigeria, 8th – 10th August 2011, pp. 568 – 577.
Authors: Dr. Felix Okwudiri Kalunta, Project Development and Design Department, Federal Institute of Industrial Research, Oshodi, Lagos, Nigeria, E-mail:felka3@yahoo.co.uk; Dr. Tolulope Akinbulire, Electrical/Electronic Engineering Department, University of Lagos, Nigeria. Prof. Frank Nwoye Okafor;Electrical/Electronic Engineering Department, University of Lagos, Nigeria; E-mail:cfrankok@yahoo.com
Source & Publisher Item Identifier: PRZEGLĄD ELEKTROTECHNICZNY, ISSN 0033-2097, R. 98 NR 5/2022. doi:10.15199/48.2022.05.17
