Published by F. H. Costa, I. N. Santos, S. F. P. Silva and J. C. de Oliveira, Group of Power Quality Faculty of Electrical Engineering Federal University of Uberlandia Campus Santa Monica – Av. João Naves de Ávila, 2100 Uberlandia (Brazil). Phone/Fax number:+55 (34) 3239-4733, e-mail: fernandahein@hotmail.com, ivan.ufu@gmail.com, sergio@qes.com.br, jcoliveira@ufu.br
Abstract. The aim of this paper is to apply a methodology towards the sharing of responsibility between the utility and the consumer with reference to the occurrence of harmonic voltage distortions at the point of common coupling (PCC). The approach is based on the measured values of harmonic voltage and current as well as the supply and load harmonic impedance information. In addition to the general method principles, the paper focuses a specific application involving a real industrial installation, fed by 230 kV and having a large amount of rectifiers. The results are then used to verify the proposal consistency regarding the sharing of the responsibilities between the utility and the industry as far as the harmonic voltage distortion is concerned. The proposed process finds sustenance during the implementation of mitigation procedures with sights to the attendance of the standards of quality established by the regulating agencies.
Key words: Harmonic distortion, power quality, sharing harmonic responsibility, load modeling.
1. Introduction
Due to the harmful character of the harmonic distortions, standards and recommendations establish guidelines for the definition of limits for these distortions and other power quality indexes. The IEEE Standard 519 [1], EN 50160 [2] and IEC 61000-3-6 [3] are examples of documents covering such matter.
If the harmonic voltage distortion exceeds the allowed limits, mitigation procedures must be considered. The application of these procedures may cause great conflicts between the utility and the consumer due to the fact that high investments and costs are often involved. These difficulties are due, mainly, to the knowledge absence of the individual source and load contribution for the voltage distortions. In such a way, the search of technical and scientific methods to reach the trustworthy to quantify the parcels of responsibility between the parts involved would be most relevant. At the moment a few references may be found tackling this matter. Some of them are base on:
• Principles involving load modeling under distorted conditions [4]-[7];
• Harmonic active power flow [8];
• Conforming and non-conforming current components [9] and;
• Superposition principles [10
In general, such works attempt to find the main source of the distortions without worrying about the establishment of procedures toward the identification of the individual parcels of responsibility. Recognizing this limitation, this paper attempts an approach, based on site measurements and system information, that gives, at the end, the individual contribution of the utility and the consumer responsibility upon a given harmonic voltage distortion.
The general idea is based on the classic concepts of electric circuits and superposition principles. In addition to the methodology itself, a case study, using a real electric system supplying industrial installation containing a large number of rectifier units is considered. The results are given to highlight the approach utilization and method physical consistence.
2. Theoretical Fundaments
Using frequency domain techniques, it is possible to represent the utility and the consumer connected to the PCC by an equivalent Norton circuit, as given in Fig. 1.
Each harmonic order is represented by “h”. Both the representative utility and the combined linear and nonlinear loads of the consumer are shown. A more detailed arrangement is also shown in Fig. 1. The individual source and load contributions, as well as the measured variables are highlighted.

In the figure:
Żhc – Consumer equivalent impedance at order h;
Żhu – Utility equivalent impedance at order h;
l̇hc – Harmonic current produced by the consumer;
l̇hu – Harmonic current injected by the utility;
V̇hm – Harmonic voltage measured at the PCC;
l̇hm – Harmonic current measured at the PCC.
Equation (1), derived from the equivalent circuit and superposition principles, gives the harmonic current generated by the nonlinear load in terms of the harmonic voltage and current measured at the PCC and the equivalent load impedance. The individual values for the harmonic voltage and current, extracted from site measurements are obtained in a similar way as given in [5], [6] and [10].

The harmonic current component at the PCC produced solely by the consumer nonlinear load (l̇hpcc-c) and injected in the mains is given by:

In these terms, the harmonic voltage, associated exclusively with the nonlinear effect of the consumer, can be determined by:

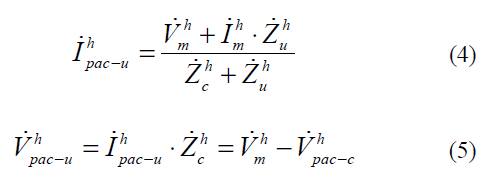
In a similar way to the calculations of consumer contribution, harmonic current and voltage parcels associates with the utility only are given by (4) and (5), respectively.
The previous equations show that, the resultant harmonic voltage originating from the consumer nonlinear load depends on the values of the impedances of the consumer and the utility. Consequently, to determine the contribution of each part, it is essential the knowledge of these harmonic impedances. To fulfill this requirement, the utility provides information related to its own harmonic impedances, thus, for may application this can be taken as a known parameter. On the other hand, it is important to observe that little or almost nothing is known about the load equivalent harmonic impedance. This guides for the necessity of the development of a strategy to the obtainment of such information. This is further discussed in the following section.
3. Consumer Load Modeling
The representation of the equivalent harmonic load impedance has motivated researchers to investigations attained to the representation of the equivalent consumer harmonic impedances. This is the case of [5] – [7]. Such references propose a parallel association of the basic elements: resistance, capacitor and inductor. Using the principles, reference [11] estimates these components based on site measurements and time domain computational techniques. This approach has been used in this paper for the necessary consumer load modeling.
Following this strategy, Fig. 2 illustrates the harmonic distorted voltage source; the load injected harmonic current and the load equivalent parameters (R, L and C). These later variables are to be calculated bellow.

The previous figure can be reorganized, generating the Fig.3.

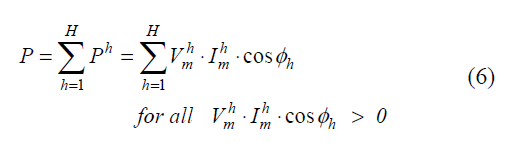
The equivalent resistance is calculated through the total active power associated with the consumer operation and measured at the PCC. Thus, it must be pointed out that such power represents the sum of all harmonic active powers, considering only the positive ones, therefore, the ones driven by the load. In these terms:
Where:
P – Total active power at the PCC;
Ph – Harmonic active power at order h;
Φh -Phase angle between the harmonic voltage and current at h order.
Using the above equation and the measured rms voltage at the PCC, the load equivalent resistance can be calculated by:

The value of R is considered constant for the entire harmonic spectrum this hypothesis neglects the well known skin effect. Once the resistance has been found, it becomes possible to determine the individual harmonic currents flowing through the resistance branch. This current, for each harmonic order under analysis, is given by (8). It is important to remind that, this procedure must be repeated for all individual frequencies involved in the process.
By subtracting, for each frequency, the above current from the corresponding measured value, the result can be readily attributed to the combination of the three remaining components of current: the inductor (L), the capacitor (C) and the nonlinear load harmonic generation. Equation (9) expresses this relationship.

Where:
l̇hLCK– Harmonic current attributed to the combination of the inductor, the capacitor and the nonlinear load harmonic generation;
With this new current, the capacitance (C) can be calculated by (10). It must be detached that only the reactive powers with negative signals are considered, since the target is the capacitive element. The fundamental frequency is represented by f.
Once the equivalent capacitance is known, the harmonic current ( l̇hCap) can easily be determined for the distinct frequencies. Again, by subtracting this current from l̇hLCK, the result ( l̇hLK ) consists of the current associated with the inductive equivalent added with the current injected by the nonlinear load.
One again, in accordance with the previously used principles, the equivalent inductance is calculated by (11), that evidences the exclusive use of the positive values for the reactive harmonic powers.

By knowing the values of each harmonic current at the resistance, the capacitor and the inductor, the residual harmonic current will be that associated to the nonlinear load.
By knowing the values of each harmonic current at the resistance, the capacitor and the inductor, the residual harmonic current will be that associated to the nonlinear load.
Therefore, at this stage, in addition to the harmonic current sources, the values of linear components R, L and C are also known for all the harmonic orders under analysis. This allows the calculation of the consumer equivalent impedance for each individual frequency and, consequently, its use in the expressions (2) to (5).
4. Experimental Results
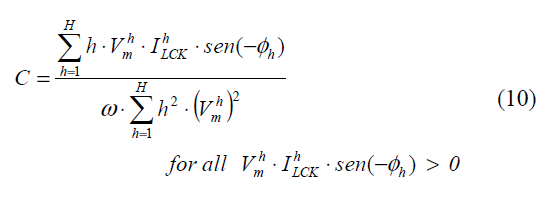
With the intention of investigating the performance of the methodology, the approach was applied to a practical situation involving an industrial installation with a large amount of rectifier load. This arrangement, in its simplified forma is shown in Fig.4 and the focused busbar corresponds to the 230 kV one. A PQ instrument was then installed at this PCC to obtain the required information as defined by the methodology. Due to the strong load behavior related to the industrial process, the equipment was configured to measure voltage and current harmonic distortions during long periods. The measurement device is a commercial product named RMS – MARH 21, capable of reading three-phase voltages and currents and calculating harmonics up to the 40th order.
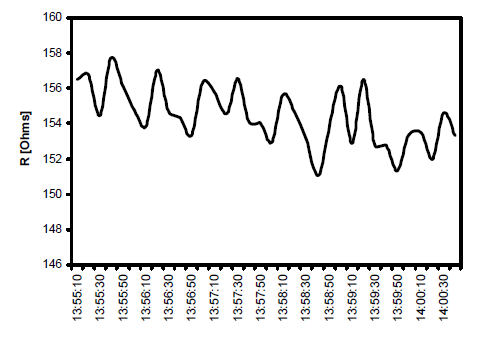
Although a longer period of time has been utilized, a sample of the phase to neutral voltage THD profile, over an interval of 5 minutes, is illustrated in Fig. 5. The result is related to the phase A to neutral and the other phases have shown a similar performance.
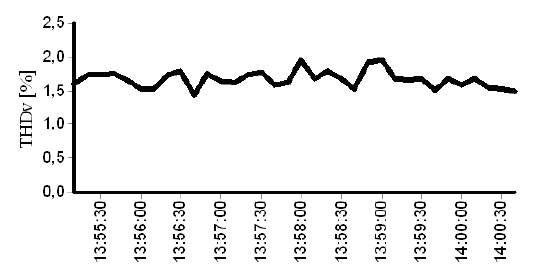
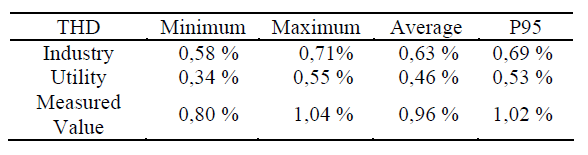
Table I summarizes the above results and makes clear the information about the most relevant individual harmonic components. In addition to the minimum, maximum and average values the given summary also provides the so called P95, i.e. the level of harmonic that is associated to the probability of occurrence of 95% over the total period of measurement.
TABLE I – Phase to neutral voltage – harmonic distortion summary

The total harmonic distortion (THD) associated with P95 evidences that this parameter is in accordance with the European standards and the IEEE 519 limits. The same affirmation can be equally applied to the individual harmonic components. Despite the standards agreement, these values will be still used to elucidate the methodology of sharing the harmonic voltage distortion between the utility and the industry.
Using the same previous equipment in a simultaneous way as the voltage measurement, Fig.6 shows the THD current performance for line A current. This is the same phase used for the voltage result and corresponds to one of the three line currents.
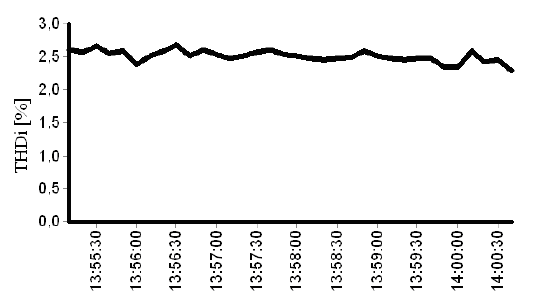
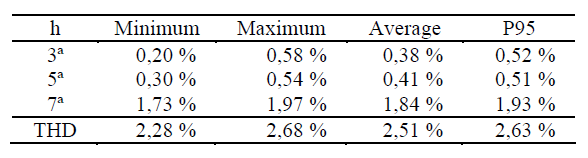
Table II gives a summary of the line A current results in the same way as explained for phase A to neutral voltage.
TABLE II – Current results
5. Utility and Consumer Harmonic Impedances
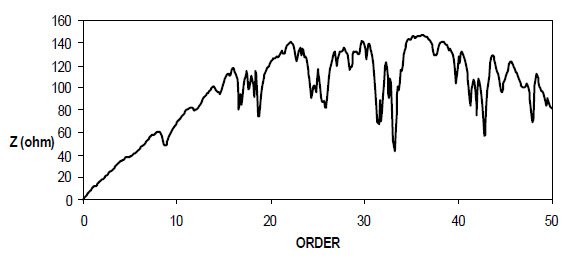
The utility impedance was computationally obtained by supplying the required data to the HARMZS software. This is a commercial program developed and supplied by CEPEL (electrical research center – Brazil). The impedance module and angle for each frequency are given in Fig.7 and Fig.8, respectively.
The load impedance is then found in accordance with the described methodology. It must emphasized that the calculation is performed at each instant of voltage and current measurement. Therefore, the Fig.9 and Fig.10 show the time domain behavior of the calculated equivalent load impedance during the focused time interval of measurement.


6. Results Associated to the THD Sharing
Once the necessary information is available to the use of the proposed methodology for sharing of responsibility upon the harmonic voltage distortion between the utility and the consumer, the method was applied and the final results are given in Table III. As shown, the values are related to the mentioned time interval of 5 minutes, due to this the minimum, maximum, average and P95 values are given.
TABLE III – Summary of the final sharing of responsibility at the PCC.

The results indicate that there are no significant problems regarding harmonic distortions. Besides, the consumer and the utility contributions to total voltage distortion are almost the same.
Fig.11 illustrates, over the 5 minutes of measurement, the instantaneous contribution of both the utility and the industry. The results are in agreement with the previous statement.

Focusing the individual 5th harmonic order, by applying the procedure for the measured time interval, Fig. 12 and Table IV show the contribution from the supply and the load. It can be noted that the major individual distortion is attributed to the local power authority. As the industry rectifier is composed by a 36 pulse arrangement, this is a physical expected result.

TABLE IV – Results to 5ª harmonic sharing in PCC.

If the 7th individual harmonic order is now considered, the final results are illustrated by Fig. 13 and Table V. The sharing of responsibility upon this specific frequency points out to the industry as the major generator of such component. As a matter of fact, at a first glance, this looks inconsistent. However, the existence of an industry power factor capacitor bank has been recognized as the reason for this current amplification. Thus, the final results appear physically in accordance with expected performance due to the combination of the 88 kV busbar capacitances and supply impedance.

TABLE V – Results to 7ª harmonic sharing in PCC.
7. Conclusion
This paper presented a case study related to the sharing of harmonic responsibility between the utility and the consumer. By applying the methodology here discussed throughout a real case it was highlighted the steps and the final results about the distribution of harmonic distortion between the supplier and the consumer. The results have shown that, for the present situation, both the utility and the industrial consumer have almost the same responsibility upon the final THD. As far as the process validation is concerned, due to the natural difficulties associates to the use of a real installation, no switching maneuvers were allowed. Thus the analysis was limited to physical expected performances. Using such principles it has been shown that the final indications about responsibility upon THD were found to be physically consistent. However, the authors recognize that this subject is controversial and the approach validation requires further investigation.
8. References
[1] IEEE Recommended Practice and Requirements for Harmonic Control in Electric Power Systems, IEEE Std. 519-1992.
[2] Voltage characteristics of electricity supplied by public distribution systems, European Std. EN 50160:1999.
[3] Electromagnetic compatibility (EMC) – Part 3: Limits – Section 6: Assessment of emission limits for distorting loads in MV and HV power systems – Basic EMC publication, IEC 61000-3-6, (1996).
[4] A. A. Moustafa, A. M. Moussa and M. A. El-Gammal, Separation of customer and supply harmonics in electrical power distribution systems, in: Proceedings of Ninth International Conference on Harmonics and Quality of Power, 2000, pp. 1035-1040.
[5] R E. B. Makram and S. Varadan, “Generalized load modeling in presence of harmonics and distortion,” in: Proceedings of Twenty Fifth Southeastern Symposium on System Theory, pp. 124-128, Mar. 1993.
[6] M. M. M. El Arini, “A time domain load modeling technique and harmonics analysis,” in: Proceedings of Eighth International Conference on Harmonics and Quality of Power, pp. 930-938, Oct. 1998
[7] S. A. Soliman and M. Al-Kandari, “A simple and noval technique for linear and nonlinear load modeling in the time domain”, in: Proceedings of Eighth Mediterranean Electrotechnical Conference, 1996, pp. 1616-1619.
[8] T. Tanaka and H. Akagi, “A new method of harmonic power detection based on the instantaneous active power in three-phase circuits”, in IEEE Trans. Power Del, Vol.10, pp 1737-1742, April. 1995.
[9] K. Srinivasan and R. Jutras, “Conforming and nonconforming current for attributing steady state power quality problems,” IEEE Trans. Power Del. Vol. 13, pp 212-217, Jan. 1998.
[10] Wilsun Xu and Yilu Liu, “A method for determining customer and utility harmonic contributions at the point of common coupling,” in: IEEE Trans. Power Del., pp. 804-811, Feb. 2000.
[11] S. F. P. Silva and J. C. de Oliveira, ” The Sharing of Responsibility between the Supplier and the Consumer for Harmonic Voltage Distortion: A Case Study,” in: Electric Power Systems Research, Vol. 78, pp. 1959-1968, Nov. 2008.
Source & Publisher Item Identifier: International Conference on Renewable Energies and Power Quality (ICREPQ’09) Valencia (Spain), 15th to 17th April, 2009. https://doi.org/10.24084/repqj07.327
