Published by 1. Yuriy SAYENKO1, 2. Ryszard PAWEŁEK2, 3. Vadym LIUBARTSEV1,
Pryazovskyi State Technical University (1), Lodz University of Technology, Institute of Electrical Power Engineering (2) ORCID. 1. 0000-0001-9729-4700, 2. 0000-0002-1023-8210, 3. 0000-0003-1243-9101
Abstract. The growing share of renewable energy sources in the structure of energy systems causes many problems related to the correct operation of the grid. This impact is most evident in low-voltage grids to which many low-power prosumer solar and wind installations are connected. For the correct management and, consequently, the economic operation of power systems, the most accurate forecast of electricity consumption and generation in grids with different voltage levels is needed. Conventional generation devices have stable production values and can be regulated within wide limits, while the production of electricity from renewable sources, by wind farms in particular, depends on external weather conditions and requires a more careful approach to its forecasting. The aim of the article is to present a method of forecasting the power generated by wind turbines based on publicly available meteorological data. The presented forecasting method uses the theory of neural networks.
Streszczenie. Rosnący udział odnawialnych źródeł energii w strukturze systemów energetycznych, powoduje wiele problemów związanych z poprawną pracą sieci. Oddziaływanie to jest najbardziej widoczne w sieciach niskiego napięcia, do których przyłączonych jest wiele fotowoltaicznych i wiatrowych instalacji prosumenckich małej mocy. Dla poprawnego zarządzania i w konsekwencji ekonomicznej pracy systemów elektroenergetycznych potrzebna jest możliwie dokładna prognoza zużycia i wytwarzania energii elektrycznej w sieciach o różnych poziomach napięcia. Konwencjonalne urządzenia wytwórcze mają stabilne wartości wytwarzania i mogą być regulowane w szerokich granicach, natomiast produkcja energii elektrycznej ze źródeł odnawialnych, a w szczególności przez elektrownie wiatrowe, zależy od zewnętrznych czynników atmosferycznych i wymaga staranniejszego podejścia do jej prognozowania. Celem artykułu jest przedstawienie metody prognozowania mocy generowanej przez turbiny wiatrowe w oparciu o publicznie dostępne dane meteorologiczne. W prezentowanej metodzie prognozowania wykorzystano teorię sieci neuronowych. (Prognozowanie energii wytwarzanej przez źródła wiatrowe na podstawie danych meteorologicznych z wykorzystaniem sieci neuronowych).
Keywords: renewable sources, wind farms, forecasting, neural networks, modelling
Słowa kluczowe: źródła odnawialne, farmy wiatrowe, prognozowanie, sieci neuronowe, modelowanie
Introduction
Nowadays, renewable energy sources occupy a large part of the generation structure. The advantages of using renewable types of energy sources are as follows: reduced CO2 emissions and the reduced consumption of hydrocarbon fuels, but they also have a significant drawback, i.e. complex management and dispatching of such power systems due to the instability of electricity production [1 – 4].
At the same time, if large wind-powered generating plants have the equipment and information resources to predict generation depending on weather conditions, small wind-powered generating plants (the prosumers) do not have such capabilities and the usual meteorological weather forecast is the only available data source. The power system operator must have the data forecast on possible short-term and long-term generation from the wind-powered generating plants in order to maintain the most economical operating mode of the power system with distributed generation, without reducing its reliability indicators.
The power production of the wind-turbine depends on many variables, primarily such as wind speed, wind direction, temperature, air pressure, etc., which must be taken into account in the forecasting model.
Currently, the greatest attention is devoted to the issues of forecasting electricity production from large wind-powered generating plants that have the meteorological equipment and the necessary information resources to transfer the electricity production plan to the grid operator [5 – 9].
But at the same time, there is an issue of forecasting electricity production from the prosumers of small wind turbines as part of an electric power system with distributed generation, because they are also capable of having a strong effect on the power flow and the operating mode of the power system.
The aim of the article is to develop a method of predicting the power generation from wind turbines that is based on public meteorological data.
Research method
Nowadays, neural networks are one of the most progressive and accurate methods of forecasting and assessing various processes in power engineering. The feasibility of their use is confirmed by previous studies [10, 11], in which their main advantages are determined: high accuracy, versatility and flexibility.
A neuron is an information–processing unit that is fundamental to the operation of a neural network. The block diagram of Figure 1 shows the model of a neuron which forms the basis for designing a large family of neural networks studied in the next chapters. Here, we identify three basic elements of the neural model [12]:
– A set of synapses, or connecting links, each of which is characterized by a weight or strength of its own. Specifically, signal xj at the input of synapse j connected to neuron k is multiplied by the synaptic weight wkj. It is important to take note of the manner in which the subscripts of the synaptic weight wkj are written. The first subscript in wkj refers to the neuron in question and the second subscript refers to the input end of the synapse to which the weight refers. Unlike the weight of a synapse in the brain, the synaptic weight of an artificial neuron may lie in a range that includes negative as well as positive values.
– An adder for summing the input signals, weighted by the respective synaptic strengths of the neuron; the operations described here constitute a linear combiner.
– An activation function for limiting the amplitude of the output of a neuron. The activation function is also referred to as a squashing function, in that it squashes (limits) the permissible amplitude range of the output signal to some finite value.
The neural model of Figure 1 also includes an externally applied bias, denoted by bk. Bias bk has the effect of increasing or lowering the net input of the activation function, depending on whether it is positive or negative.

In mathematical terms, we may describe neuron k depicted in Figure 1 by writing the pair of equations [11]:
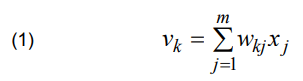
and

where: x1, x2, …, xm – input signals; wk1, wk2, …, wkm – respective synaptic weights of neuron k; vk – linear combiner output due to the input signals; bk – bias; φ(·) – activation function; yk – output signal of the neuron.
Source data
Data on electricity production taken from the website of the Australian energy market was used as a source of preliminary data for the training of the neural network. The data is a time series for the generation of electricity by various wind-powered generating plants in Australia with a discreteness of 5 minutes for 2018 (about 105 000 values). The data obtained from 195 MW wind farm in Portland was used in the study. This choice is due to the rather close (16 km) location of the weather station at the Portland airport (Fig. 2), and it was data freely available for research. In preparation, the data was reduced to the discreteness of 1 hour.

The archive of the meteorological data obtained from the meteorological station located at the Portland airport [14] includes data on time, temperature, air pressure, wind speed and direction, as well as pressure trends (Fig. 3).
The time data is presented in fractions of the whole value of the day (24 hours is 1) for the ease of use in the neural network. The wind direction data for the training of neural networks is presented as 0.01 part of the wind rose angle (for example, north wind – 0, east – 0.9, south – 1.8). The rest of the data was accepted unchanged.

Creation and training of neuron networks
To predict the power generation via meteorological data, a neural network with the following variables was established (the selection of the variables was based on the fact that they provide high speed and quality prediction selected for different configurations):
– Number of layers – 2;
– Function of the first layer activation: Log–sigmoid;
– Function of the second layer activation: Linear;
– Training algorithm – Bayesian regularization back propagation.
The number of neurons N was selected empirically [9], based on the following ratio:

where NIN – number of inputs (in the analysed case NIN = 6).
A simplified model of a neuron network created in the MATLAB program using the Neural Network Toolbox package [15] is presented in Figure 4.

The performance graph (Fig.5) indicates the iteration at which the validation performance reached a minimum. The training continued for 6 more iterations before it was stopped.

In the analysed case, the figure does not indicate any major problems with the training. The validation and test curves are very similar. If the test curve had increased significantly before the validation curve increased, it would have been possible for some overfitting to have occurred.
The next step in validating the network is to create a regression plot which shows the relationship between the outputs of the network and the targets (Figure 6). If the training were perfect, the network outputs and the targets would be exactly equal, but the relationship is rarely perfect in practice.
The dashed line in each plot represents the perfect result – outputs = targets. The solid line represents the best fit linear regression line between outputs and targets. The R value is an indication of the relationship between the outputs and targets. If R = 1, this indicates that there is an exact linear relationship between outputs and targets. If R is close to zero, there is no linear relationship between outputs and targets. For this example, the training data indicates a good fit. The validation and test results also show R values close to 0.9. The scatter plot is helpful in showing that certain data points have poor fits.

Figure 7 shows the graph with an example of real (blue) and predicted values obtained as a result of the neural network operation. Forecasting was carried out during training on different volumes of data sets (1500–5500 values).
The forecasting was carried out 100 hours ahead, then the values were compared with the actual 100 values that were previously received from the Australian grid operator.
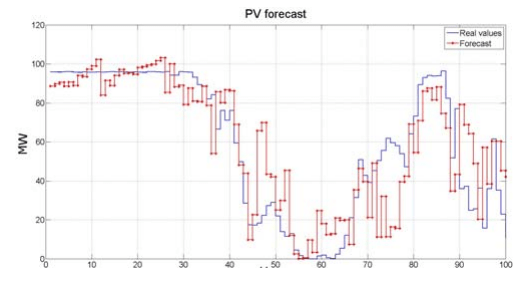
Table 1 shows the average generation power forecast errors for wind-powered generating plants. The following equation was used to calculate them:

where: Err is the error value, MW; Ppred is the predicted value of the generation power, MW; Preal is the real value of the generation power, MW.
Next, for each element in the error vector, the error value is calculated as a percentage:

where: ErrPer – is the error value, %; P – is the installed capacity of the wind-powered generating plant, MW.
To get the final result of the average vector error as a percentage, the following equation was used:

where MeanErrPer – is the average error value, %; N – is the number of predicted values of electricity generation.
The comparison of the average errors when using different ranges of data sets is given in Table 1:
Table 1. Comparison of the values of the mean forecast errors

Conclusion
The use of neural networks to predict the generation of electricity from wind-powered generating plants, including private ones of low power, provides an accurate forecast (1- 2% average error).
It is possible to obtain an accurate forecast using conventional meteorological weather forecast data just for private small wind farms without meteorological stations (data on temperature, air pressure, and most importantly, wind speed and direction) as the initial data.
When the forecasting uses neural networks, it is necessary to take into account the requirements for the quality of the initial data and its volume. For example, when using a sample of data of 1500 values for training a neural network, an average error of 14.3% was obtained, and when a sample of 2500 values was used, it was 1.15% (Table 1).
At the same time, the error value increased to 4.91% with too large a sample (5500 values), which is caused by over-generalization for the time series.
Therefore, the objective is to find a compromise for the sample size for training the network. This forecast can also be used by operators of distributed generation power systems to assess the impact of weather conditions on the power generation capacity by prosumers and more accurately balance power flows to achieve the most economical power system operation mode.
REFERENCES
[1] Leithon J., Werner S., Koivunen V., Cost-aware renewable energy management: Centralized vs. distributed generation, Renewable Energy, pp. 1164-1179, 2019 doi:10.1016/j.renene.2019.09.077
[2] Wang C., Wu J., Ekanayak J., Smart Electricity Distribution Networks, Boca Raton: Taylor & Francis Group, 2017.
[3] Kariniotakis G., Waldl I.H-P., Marti I., Giebel G., Nielsen T.S., Tambke J., Usaola J., Dierich F., Bocquet A., Virlot S., Next generation forecasting tools for the optimal management of wind generation, 2006 International Conference on Probabilistic Methods Applied to Power Systems, Stockholm, 2006, pp. 1-6, doi: 10.1109/PMAPS.2006.360238.
[4] Shahnia F., Arefi A., Ledwich G., Electric Distribution Network Planning, Power Systems, 2018, doi:10.1007/978- 981-10-7056-3
[5] Zhang Y., Dong J, Least Squares-based Optimal Reconciliation Method for Hierarchical Forecasts of Wind Power Generation”, IEEE Transactions on Power Systems, pp. 1–10, 2018, doi:10.1109/tpwrs.2018.2868175
[6] Yatiyana E., Rajakaruna S., Ghosh A., Wind speed and direction forecasting for wind power generation using ARIMA model, 2017 Australasian Universities Power Engineering Conference (AUPEC), Melbourne, VIC, 2017, pp. 1-6, doi: 10.1109/AUPEC.2017.8282494.
[7] Tambke J., von Bremen L., Barthelmie R., Palomares A.M., Ranchin T., Juban J., Kariniotakis G.N., Brownsword R.A., Waldl H.P., Short-term Forecasting of Offshore Wind Farm Production – Developments of the Anemos Project”, 2006 European Wind Energy Conference, EWEC, Feb 2006, Athènes, Greece, 13 p.
[8] Wan C., Xu Z., Pinson P., Dong Z.Y., Wong K.P., Probabilistic Forecasting of Wind Power Generation Using Extreme Learning Machine, IEEE Transactions on Power Systems, vol. 29, no. 3, pp. 1033-1044, May 2014, doi: 10.1109/TPWRS.2013.2287871.
[9] Foley A.M., Leahy P.G., Marvuglia A., McKeogh, E.J., Current methods and advances in forecasting of wind power generation”, Renewable Energy, vol. 37(1), pp. 1–8, 2012, doi: 10.1016/j.renene.2011.05.033
[10] Sayenko Y., Sychenko V., Liubartsev V., Development of Methods for Optimizing Reactive Power Modes Based on Neural Network Technologies, 2019 IEEE 6th International Conference on Energy Smart Systems (ESS), Kyiv, Ukraine, 2019, pp. 98-103, doi: 10.1109/ESS.2019.8764220.
[11] Sayenko Y., Baranenko T., Liubartsev V., Forecasting of Electricity Generation by Solar Panels Using Neural Networks with Incomplete Initial Data, 2020 IEEE 4th International Conference on Intelligent Energy and Power Systems (IEPS), Istanbul, Turkey, 2020, pp. 140-143, doi: 10.1109/IEPS 51250.2020.9263085.
[12] Haykin S.O., Neural Networks and Learning Machines, 3rd Edition. Ontario, Canada: McMaster University, 2009.
[13] AEMO Energy Generation Data, Australian Energy Market Operator. [Online]. Available: https://anero.id/energy/data
[14] Weather archive in Portland (airport), Australia, [Online].available: https://rp5.ua/Weather_archive_in_Portland_(airport)_Australia
[15] Hudson Beale M., Hagan M.T., Demuth H.B., Neural Network Toolbox™. Users’s guide, The MathWorks, Inc., 2017.
Authors: prof., Ph.D., D.Sc., Eng., Yuriy Sayenko, Pryazovskyi State Technical University, Department of Industrial Electrical Power Supply, Ukraine, 87555, Mariupol, 7 Universytets’ka, E-mail: sayenko_y_l@pstu.edu; Dr Ryszard Pawełek, Lodz University of Technology, Institute of Electrical Power Engineering, 18/22 Stefanowskiego str., 90- 924 Lodz, E-mail: ryszard.pawelek@p.lodz.pl; Ph.D. student., Vadym Liubartsev, Pryazovskyi State Technical University, Department of Industrial Electrical Power Supply, Ukraine, 87555, Mariupol, 7 Universytets’ka, E-mail: lubartsevvadim@gmail.com.
Source & Publisher Item Identifier: PRZEGLĄD ELEKTROTECHNICZNY, ISSN 0033-2097, R. 97 NR 11/2021. doi:10.15199/48.2021.11.39
