Published by Marta BĄTKIEWICZ-PANTUŁA, Wrocław University of Science and Technology, Institute of Electrical Power Engineering
Abstract. The article presents an analysis of the selected parameter of the power quality. The analysis was done in accordance with the applicable normative regulations. The results presented in the article were made on the basis of actual measurements of the electricity quality parameters. Two different objects were analyzed: a group of industrial receivers and a network cooperating with renewable energy sources.
Streszczenie. W artykule zaprezentowano analizę wybranego parametru jakości energii elektrycznej. Analiza została przeprowadzona zgodnie z obowiązującymi przepisami normatywnymi. Zamieszczone w artykule wyniki zostały wykonane na podstawie rzeczywistych pomiarów parametrów jakości energii elektrycznej. Analizie zostały poddane dwa różne obiekty jakim była grupa odbiorników przemysłowych oraz sieć współpracująca z odnawialnymi źródłami energii. (Problematyka wyznaczania współczynnika migotania światła zgodnie z aktualnymi przepisami normatywnymi).
Keywords: flicker, regulation of the minister, updating of the EN 50160 standard, industrial customer of electricity, renewable power plants
Słowa kluczowe: współczynnik migotania światła, rozporządzenie ministra, aktualizacja normy EN 50160, odbiorcy przemysłowi, energia odnawialna
Introduction
The phenomenon of voltage fluctuations appeared with the beginning of the existence of electricity distribution systems. More attention to this phenomenon have been given with the increase in the number of receivers and their installed capacity. In order to better understand the disorders and the effects they cause, in many countries they started to fight this problem through numerous researches aiming at a thorough understanding of the phenomenon itself and its measuring assessment.
Until recently, voltage fluctuations in the power supply or the load terminals, were described by specifying the maximum size of the change in value of the effective voltage.
The energy of voltage fluctuations and the spectral density of power of voltage fluctuations were also used, (also called the energy spectrum of voltage fluctuations). The duration of the fluctuations and the interval between changes in voltage was also included in the assessments.
Parameters according to which the quality of the supply voltage should be assessed are included in the Regulation of the Minister of Economy [1], which is a valid legal act and in relation to recipients supplied from low, medium and high voltage public power networks in PN-EN 50160 [2,3]. An important group of documents in this area is the multipart PN-EN 61000-xx standard with the general title “Electromagnetic compatibility” [4,5], which defines the acceptable levels of environmental and operational interference that are required to ensure the correct operation of electrical devices connected to the network and defines the measurement methods and methods for determining these disturbances.
The phenomenon of the flicker is a voltage changes that have the character of regular fluctuations, which occurs for a long time, which can cause changes in luminous flux generated by electric light sources. This phenomenon has an adverse effect on the comfort and concentration of people working in such conditions, and its measure is the flickering index, the permissible levels are specified in the Regulation [1] and the Standard [2]. The indicator of flicker is determined for all voltage levels in the power network [2], both for the highest voltages (connection groups I and II), as well as medium and low voltage (connection groups III – V).
The determination of acceptable levels of the flicker indicator also in the case of medium and high voltages, i.e. those at which the light source is not directly supplied, indicates the high importance of this parameter and the possibility of propagating interference at various voltage levels across the entire distribution network. Connecting the devices of significant powers to the network, which may cause the phenomenon of flickering of light (welding machines, often switched on and off motors, arc furnaces) should be preceded by an analysis aimed at checking whether the flickering effect caused by this device will fall within the permissible range [2]. In the analysis of this important parameters are: the nominal power of the device, the short-circuit power of the network and the nature of voltage changes caused by the operation of the device.
Measurement of voltage fluctuations is carried out in order to assess the compliance of existing levels of the phenomenon with the relevant standards, as well as to determine the emission level of a given receiver and compare it with the limit values in the standards. There are two basic methods of measurement:
• based on a quantitative evaluation of the phenomenon based on a temporary change in the effective value or voltage envelope,
• based on indirect measurement – measurement of the phenomenon of flickering of light which is a direct result of voltage fluctuations.
The phenomenon of flickering of light, known in the world literature under the name “flicker”, is one of the parameters for assessing the power quality. It depends on the instability of the perception of human vision, but this instability is caused by a light stimulus whose luminance or spectral distribution is subject to changes in time due to fluctuations in the voltage supplying the light source.
The rules for calculating the flicker ratio are specified in the standard [6]. This factor consists of two elements:
• short-term flicker factor Pst, determined for the observation time of 10 minutes, according to the dependence:

in which P0.1 percentiles; P1; P3; P10 and P50 are flicker levels exceeded by 0.1; 1; 3; 10 and 50% of the observation time. The index s in the above dependence indicates that should used the smoothed values.
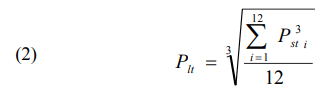
• long-term flicker factor Plt determined for the observation time of 2 hours and calculated using the next 12 Pst factors for this observation time, according to the formula:
The primary document in the process of assessing the power quality is the Regulation of the Minister of Economy of 4 May 2007 on detailed conditions for the operation of the power system with the last update in 2008. The subordinate document is the PN-EN 50160 standard: Voltage characteristics of electricity supplied by public electricity networks which until now has been updated three times, i.e. in 2008, 2010 and 2015.
The Regulation of the Minister of Economy and the PNEN 50160 standard to be updated in 2010 were in line with the power quality requirements for the assessment.
Table I presents the comparison of the requirements for the parameter of the power quality which is the flicker. The list has been presented for nn and SN networks.
Table 1. Permissible limits of the flicker factor

The first column indicates the requirements set by the Regulation of the Minister of Economy in the second and third column requirements to be met according to PN-EN 50160 in 2010 and from 2015.
Analysis Of Measurements
The basis for assessing the power supply conditions is the Regulation of the Minister of Economy of 4 May 2007. on detailed conditions of the power system operation. The article presents the assessment of the parameters of power quality in accordance with the Regulation of the Minister [1] and the PN-EN 50160 [2] standard and its update [3]. According to the normative assumptions, a representative period was selected which was a normalized time basis for the presented runs and determined power quality indicators. In a representative measurement period if disturbances were noted, i.e. dips, power interruptions, according to [3], no such measurement results should be considered. The article uses only those measurement results that were considered significant from the point of view of this work.
Figure 1 shows the general schematic diagram of the measurement system. The main element of the measurement system was the Fluke 1760 recorder.
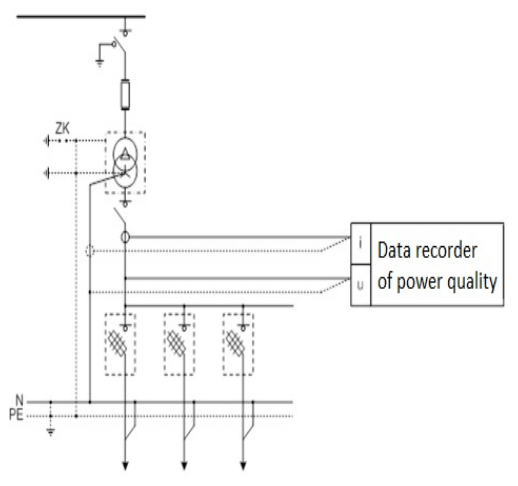
The actual measurements presented in the article have been divided into two groups. In the first group of industrial receivers supplied from the power grid was presented two examples of circuits, which are, the welding circuit, and installed arc furnace circuit. In the second group are the working with renewable sources medium voltage energy networks, also present in two cases, with the network hydroelectric plant and a wind power plant.
The first of the discussed cases are groups of industrial receivers supplied from power grid.
Figure 2 can be seen the values of the long-term and short-term flicker indicators on the L1 phase, obtained during measurements for welding circuit. The full observation time of the recorded parameters was one week. In the representative measurement period, no disturbances were detected that would affect the analyzed process. The indicators that are calculated in accordance with the methods described in the standard [4] are shown on below waveforms.

It can be observed that for the analysed case, the power quality parameter does not exceed the permissible limits contained in the documents [1-3]. The value of the flicker indicator (long-term) is a maximum of 0.85 which is in accordance with the required ministerial regulation [1], standard [2] which refers to 95% of observation time and norm [3] for 100% of observation time. Permissible limits for the short-term coefficient were not specified in the Minister’s Regulation [1] and the Standard [2]. Coefficient Pst = 1.4 meets the requirements of the updated standard [3] despite exceeding the required value 1.2. The value was exceeded in less than 5% of cases, which corresponds to requirement 1.2 for 95% of the measurement data set.
The next analyzed case is presented in Figure 3. The recorded values of long-term and short-term flicker on the L1 phase example, were presented, they were collected during measurements for the circuit where arc furnace was installed. The complete observation time of the recorded parameters was four days. In the representative measurement period, no disturbances were detected that would affect the analyzed process. The presented waveforms refer to flicker indicators was calculated in accordance with the methods described in the standard [4].
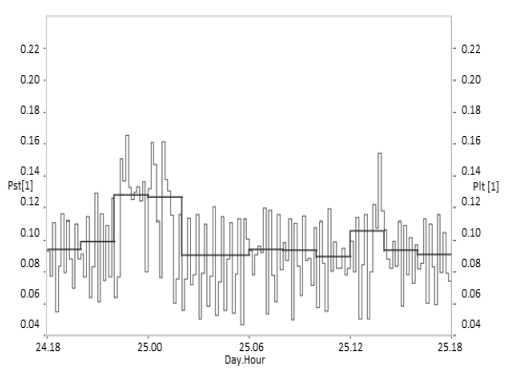
It can be observed that for the analysed case, the power quality parameter does not exceed the permissible limits contained in the documents [1-3]. The value of the long-term flicker factor is a maximum of 0.13 which is in accordance with the required ministerial regulation [1], standard [2] which refers to 95% of observation time and norm [3] for 100% of observation time. Permissible limits for the short-term flicker factor were not specified in the Minister’s Regulation [1] and the Standard [2]. The Pst = 0.16 coefficient meets the requirements of the updated standard [3].
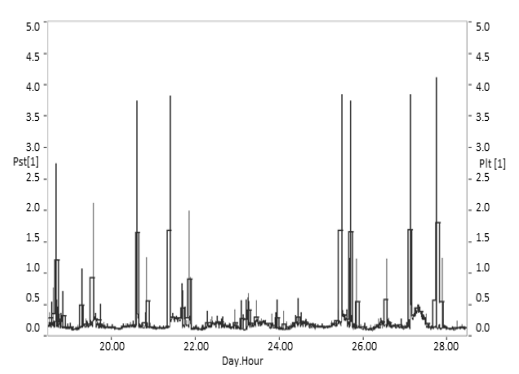
The second of the discussed cases are medium voltage network working with renewable energy sources The first case where renewable sources are working of with medium voltage network is presented in Figure 4. Presented are the collected values of long-term and short-term flickers on the example of phase L1, obtained during measurements for a hydroelectric power plant. The full observation time of the recorded parameters was one week. In the representative measurement period, no disturbances were detected that would affect the analyzed process. The presented waveforms refer to the flicker factors calculated in accord with the methods from the standard [4].
It can be observed that for the analyzed case the power quality parameter exceeds the acceptable limits contained in the documents [1-3]. Value of the long-term flicker is a maximum of 1.8 which is in accordance with the required ministerial regulation [1], standard [2] which refers to 95% of observation time. Standard [3] requires fulfillment of the parameter for 100% observation time, so exceeding the permissible value of 1 to 1.8 results in failure to meet the acceptable limit. The coefficient of short-term flicker in accordance with the regulation of the minister [1] and the norm [2] does not have admissible limits. The Pst = 4.0 coefficient meets the requirements of the updated standard [3] despite exceeding the required value 1.2. The value was exceeded in less than 5% of cases, which corresponds to requirement 1.2 for 95% of the measurement data set. In the analyzed case, a solution should be considered to improve the power quality parameters.
The next case is presented in Figure 5. Presented are the collected values of long-term and short-term flicker factors on the example of phase L1, obtained during measurements of a wind farm. The full observation time of the recorded parameters was one week. In the representative measurement period, no disturbances were detected that would affect the analyzed process. The presented waveforms refer to the flicker factors determined in accord with the methods from the standard [4].

It can be observed that for the analysed case, the power quality parameter does not exceed the permissible limits contained in the documents [1-3]. The value of the long-term flicker indicator is a maximum of 0.8 which is in accordance with the required ministerial regulation [1], standard [2] which refers to 95% of observation time and norm [3] for 100% of observation time. Permissible limits for the short-term coefficient were not specified in the Minister’s Regulation [1] and the Standard [2]. The Pst = 1.8 coefficient meets the requirements of the updated standard [3] despite exceeding the required value 1.2. The value was exceeded in less than 5% of cases, which corresponds to requirement 1.2 for 95% of the measurement data set.
Summary
The tightening of the normative provisions that followed the introduction of the PN-EN 50160 [3] standard was aimed at improving the parameters of the power quality.
The change in the power quality parameters concerned the setting of a limit for the short-term flicker factor, which until the update was undefined. At the same time, the requirements set for the long-term factor flickers were tightened. Additional information that introduces the update of the standard is defining the normal working time. The concept of normal working time refers to the state of the systems without any disturbance. If during the analyzed measurement period there are events, they should be excluded from further analysis.
Analyzing the examples presented in the article, it can be concluded that the tightening of the limits permitted for the flicker factors did not significantly affect the power quality for individual or industrial consumers. The tightening of limits has affected the network cooperating with renewable sources. Renewable power plants are characterized by variability of work which is associated with a large irregularity of parameters. The tightening of allowable limits has had a particularly strong effect on rapidly variable and irregular burdens. It can be concluded that for customers where device start-ups will occur frequently or there will be large parameter changes, the introduction of a limit for the short-term flicker factor will result in non-compliance with the normative requirements.
The problem with tightening the permissible limits for power quality parameters occurs when according to the superior document, i.e. the minister’s regulation [1], the power quality parameters meet the requirements and subordinate document, i.e. the PN-EN 50160 [3] standard, the power quality parameters already conditions do not meet. Until the update in 2015, such a problem did not exist because the subordinate document defined the same limits as in the parent document.
REFERENCES
[1] Regulation of the Minister of Economy dated. May 4, 2007 on detailed conditions of functioning of the power system (Journal of Laws of 29 May 2007, item 623).
[2] EN 50160:2010. Voltage characteristics of electricity supplied by public electricity networks.
[3] EN 50160:2015. Voltage characteristics of electricity supplied by public electricity networks.
[4] PN-EN 61000-4-15: 2011 Electromagnetic Compatibility (EMC) – Test and Measurement Methods – Flicker Meter – Functional and design specifications.
[5] PN-EN 61000-4-30:2015 Electromagnetic compatibility (EMC)-Part 4-30: Testing and measurement techniques – Power quality measurement methods
[6] PN-EN 61000-3-3:2013, Electromagnetic compatibility – Permissible levels – Limiting voltage fluctuations and flicker caused by receivers with rated current < or = 16 A in low voltage supply networks.
[7] Guide to Quality of Electric Supply for Industrial Installations, Part 5, Flicker and Voltage Fluctuations, “Power Quality” Working Group WG2, 2000
[8] A.Klajn, M.Bątkiwicz-Pantuła, Application Note – Standard EN50160: Voltage characteristics of electricity supplied by public electricity network,. European Copper Institute, 2013.
Authors: dr inż. Marta Bątkiewicz-Pantuła, Wrocław University of Science and Technology, Faculty of Electrical Engineering, Institute of Electrical Power Engineering, 27 Wybrzeże Wyspiańskiego St, 50-370 Wrocław, Poland. E-mail: marta.batkiewiczpantula@pwr.edu.pl
Source & Publisher Item Identifier: PRZEGLĄD ELEKTROTECHNICZNY, ISSN 0033-2097, R. 96 NR 1/2020. doi:10.15199/48.2020.01.13
