Published by 1. Ayodeji Olalekan SALAU1, 2. John N. NWEKE2, 3. Uche C. OGBUEFI3,
Department of Electrical/Electronics and Computer Engineering, Afe Babalola University Ado-Ekiti, Nigeria (1), Department of Electrical Engineering Technology, Federal Polytechnic Kaura-Namoda (2), Department of Electrical Engineering, University of Nigeria, Nsukka, Nigeria (3)
ORCIOD. 1. 0000-0002-6264-9783, 2. 0000-0002-4996-7197, 3. 0000-0002-3694-0358
Abstract. The frequent problem of voltage collapse in the distribution system can be mitigated through the application of the sensitivity-index-based optimization technique. The proposed method is used to identify those weak buses that are susceptible to voltage collapse within the distribution system. The identified weak buses are then optimally connected with distributed generation (DG). This will affect voltage improvement, power loss reduction, and general reliability of the system. A 30-bus 33kV feeder distribution network system is used to measure the efficacy of the proposed method. Buses 19, 22, and 30 have the greatest potential for voltage collapse in the system among all the selected candidate buses, according to the results. Bus 30, on the other hand, has the highest power KOS sensitivity index, making it the best position for the DG. The total active power loss (APL) of the network was reduced to 16.8% after effective implementation of the mitigation measures. The buses that were prone to voltage collapse which run below the statutory voltage limit (0.95 p.u ≤ Vi ≤ 1.05 p.u.) were also improved to a standard working level.
Streszczenie. Częsty problem zapadu napięcia w systemie dystrybucyjnym można złagodzić poprzez zastosowanie techniki optymalizacji opartej na indeksie wrażliwości. Zaproponowana metoda służy do identyfikacji tych słabych szyn, które są podatne na zanik napięcia w systemie dystrybucyjnym. Zidentyfikowane słabe magistrale są następnie optymalnie połączone z generacją rozproszoną (DG). Wpłynie to na poprawę napięcia, zmniejszenie strat mocy i ogólną niezawodność systemu. Do pomiaru skuteczności proponowanej metody stosowany jest 30-szynowy system sieci dystrybucyjnej z zasilaczem 33 kV. Zgodnie z wynikami, autobusy 19, 22 i 30 mają największy potencjał zaniku napięcia w systemie spośród wszystkich wybranych szyn kandydujących. Z kolei autobus 30 ma najwyższy wskaźnik czułości KOS mocy, co czyni go najlepszą pozycją dla DG. Całkowita utrata mocy czynnej (APL) sieci została zmniejszona do 16,8% po skutecznym wdrożeniu środków łagodzących. Szyny podatne na zaniki napięcia, pracujące poniżej ustawowego limitu napięcia (0,95 p.u ≤ Vi ≤ 1,05 p.u.), również zostały ulepszone do standardowego poziomu roboczego. (Skuteczne wdrożenie środków zapobiegających zanikom napięcia w systemach dystrybucyjnych)
Keywords: Mitigation, sensitivity index, voltage collapse, distribution system.
Słowa kluczowe: zapady napięcia, system dystrybucji, optymalizacja.
Introduction
The problem of voltage collapse in the distribution system has been a challenging issue for power system Engineers. This has generated several studies with different optimization methods [1-12]. The authors of [4] suggested the positioning and sizing of distributed generation to address the issue of ever-increasing electricity demand, which resulted in a lot of voltage drop and necessitated distribution system infrastructure upgrades. A differential optimization method was applied in [5] with several mitigation strategies which used passive and active power filters (APFs) to mitigate harmonic distortion. However, these mitigation techniques necessitated DG investment, which entails proper DG unit preparation and deciding the best location and sizing of DG units in order to increase VP and reduce harmonic distortion in a distribution system. The study in [6] presented a study on artificial intelligence methods for sizing photovoltaic (PV) systems in standalone, grid-connected, and PV-wind hybrid systems in order to support the network, but it did not optimize the venue.
Authors in [7] did not consider weak buses in the distribution system but connected DG to minimize active power loss (APL) based on the exact loss formula. For PL minimization, authors in [8] proposed an empirical approach focused on phasor current for optimal DG position in both mesh and radial systems. There are no convergence issues with the current solution since it is non-iterative. The authors did not search for weak buses that are susceptible to voltage collapse. The study in [9] proposed an analytical method for locating and sizing four different DG types, including those that can deliver both real and reactive power, those that can only deliver active power, those that can deliver real power (RP) and absorb reactive power, and those that can only deliver reactive power. They did not consider the search for identifying those buses that are likely susceptible to voltage collapse in the distribution network (DN).
The authors in [10] presented a differential evolution optimization method. The DG resources are embedded in the network in this study to primarily reduce power losses (PLs) and improve the voltage profile (VP) of the system at the best location and size for DG units. To improve network controllability and power transfer capacity, the authors in [11] built a model for the optimal positioning of shunt compensation along a distribution line. To determine the optimal position of the FACTS unit, a performance analysis was performed on various maximum power transfers for different degrees of series compensation and FACTS positions along the power network. The findings revealed that the ideal positions for the shunt FACTS device are not set, but change as the degree of series compensation increases.
This research paper presents a sensitivity-index-based optimization technique to identify those weak buses as mitigation against voltage collapse within a distribution system. The identified weak buses are then optimally connected with distributed generation (DG). This will affect voltage improvement, PL reduction, and general reliability of the network. The efficacy of this work is evaluated using a PSS/E model of a 30-bus 33kV feeder distribution network.
Problem Formulation
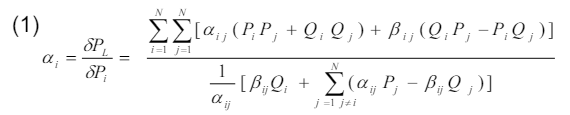
The linearization of the original non-linear equation around the original operating point is the basis for the loss sensitivity optimization (LSO) process. The equation for the LSO is given by Eq. (1).
In a power system network, the loss sensitivity analysis makes use of RP performance index optimization methods for solving the first problem of candidate weak buses that are susceptible to voltage collapse. This mitigation approach will then be achieved through supporting those weak buses with renewable energy sourced DG.at optimized size on the distribution system network. Equation (3) represents PL before DG unit placement in the power distribution network.

Then the PL after DG placement is given as:

where: ΔPi is the power injected by the DG unit. Thus, change in PL is given as

Eq. (5) represents the change of PLs when the DG unit is installed into the network. A binary value is added to indicate that a DG unit is connected or not to a bus. Therefore, a binary multiplying variable is introduced as in Eq. (6).

where: gi is a binary variable that can only take on the value of 0 or 1 to indicate that the DG unit is installed or not installed. PLs are calculated by adding the change of the losses shown in Eq. (6) to the losses obtained from the base-case load flow ( Ploss ). Hence, the PLSI is evaluated to determine the candidate bus for the placement of DGs. The bus with the highest sensitivity indicates the weakest bus and is selected as the best position for DG placement. Eq. (7) defines the numerical evaluation of PLSI for the ith bus in the power system network [12, 13].

when the rate of change of real PL to injected real power (RP) becomes zero given by Eq. (8), the total PL against the injected power is a parabolic equation, and it is at a minimum loss.

This implies that:
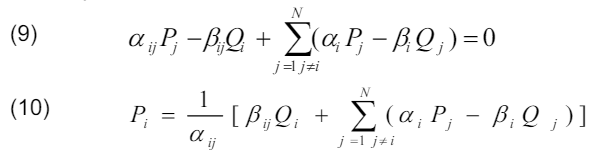
where Pi is the difference between RP generation and RP demand at the i-th node, and is the difference between RP generation and RP demand at that node. Pi is calculated using Eq. (11).

PDG is the RP injected from the ith node’s DG, and PD is the load demand at that node. Eqs. (10) and (11) are combined to obtain the equation that satisfies the actual optimal size of the DG as shown in Eq. (12) for minimal loss.

Eq. (12) shows how to size DG for each bus to reduce total APL and reinforce the system to prevent voltage failure on the feeder bus.
where:

αi j and βi j , = real and reactive PL coefficient at the ijth bus of the network
The DG generator’s power injection must meet the following requirements:
Equality Constraints: Constraints on power flow related to the non-linear equation for balancing constraints as given by Eq. (13)

Inequality constraints: Voltage constraints (PU) at each bus ( ±5% of rated voltage) must be:

DG Capacity: The capacities of the different nominal value of solar power generations must be maintained with acceptable limit as:
Methodology
A 30-bus distorted IEEE delivery feeder network is used in this study. The system’s single line diagram was modeled in the PSS/E setting and is shown in Fig. 1. The base voltage is 33kV. The study in [14] provided the network details of loads and line data. A transmission substation with a 132kV/33kV, 500KVA transformer is connected to the radial feeder test system network. The maximum current of the network branches is 520A, with a bus voltage magnitude range of 0.95 p.u. to 1.05 p.u. allowed.
Four different case studies have been considered for this IEEE 30- bus radial feeder as follows:
i. Radial distribution (RD) test feeder without DG (base case) to search and identify weak buses susceptible to voltage collapse.
ii. DG is attached to a RD test feeder.
iii. For the evaluation of real PLs, a RD test feeder with and without DG was used.
iv. RD test feeder with and without DG network VP evaluation.
The flow chart for effective implementation of mitigation measures against voltage collapse can be summarized using the following steps:
Step 1: For the base case, enter the network data and run the load flow.
Step 2: Identifies those buses operating at low voltage and forms a priority list according to their level of weakness and susceptibility to voltage collapse.
Step 3: Eq. (12) should be used to determine the optimum size of each DG for each of the candidate buses.
Step 4: Choose a bus from the list of top priorities.
Step 5: Input the optimized size of the DG into the first selected candidate bus.
Step 6: check the objective constraint to the selected candidate bus.
Step 7: Evaluate the total APL for each of the candidate buses by running the complete Newton Raphson (NR) load flow.
Step 8: Evaluate the PLSI according to Eq. (8) for each of the candidate buses in the network
Step 9: Steps 5 through 8 should be repeated for each bus on the priority list.
Step 10: the bus that has the highest PL index is said to be the weakest and most susceptible to voltage collapse. It is the best position for DG placement.
Step 11: Compare the results obtained with the base caseload flow analysis of the network.

Results and Discussion
A total APL of 21.84MW was dissipated at the base load flow solution. The VP for the base caseload flow as shown in Fig. 2 shows that some of the buses are operating below the statutory voltage limit (0.95 p.u ≤ Vi ≤ 1.05 p.u.). These buses include: 24, 26, 29, and 30.

The candidate buses for DG placement are chosen after the baseload flow is completed. To create a priority list, these load (P-Q) buses are rated according to their bus statutory voltage, from bad to worst. The optimal size of DG is then calculated for each candidate load bus using Eq (7). Figure 3 depicts the different sizes of the optimized DG scale.
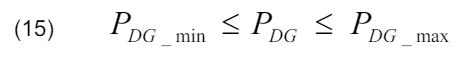
Following the calculation of the optimal size of each DG, it is now assigned to each of the candidate buses based on the ranking list. To calculate the total RP loss, a complete Newton Raphson load flow solution is used. As shown in Fig. 4, each of the total APLs is registered. The lowest value of total APL in the system network is registered at bus 30. This marks the optimal position for the PV DG installation that would improve the reliability of the system.

Fig. 5 shows a pie chart of PLSI with various levels of susceptibility to voltage collapse in the distribution network. Among all the selected candidate buses, buses 19, 22, and 30 have a high propensity to voltage collapse in the system. However, bus 30 has the highest PLSI and is seconded by bus 19 and hence the optimal location for the DG is best at bus 30.
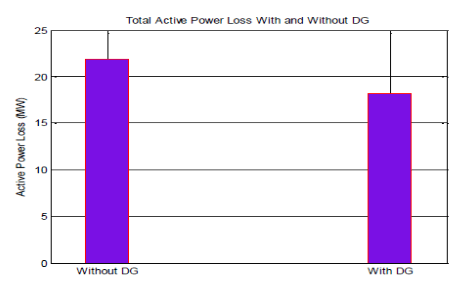
The relationship between the optimum sized DG and the losses at each bus is seen in the analytical result of Fig. 6, and the base case full NR load flow solution is now aligned with the final results after the installation of DG. This means that network design and preparation are important factors in determining the extent of delivery network losses. There is a general improvement in the system PL with the effective implementation of the mitigation measure through DG placement. as shown in Fig. 6. The total APL of the network was reduced from 21.84 MW to 18.16 MW after solar DG placement. The status of real PL in the system was reduced to 16.8%.

Buses 24, 26, 29, and 30 which were observed to operate below the voltage statutory limit are improved to a normal level of operation after DG installation as shown in Fig. 7. This was also observed for buses 10, 14, 15, 19, 21, 22, 23, and 25.
Also, the results in Fig. 7 shows a general improvement with greater reliability of the distribution system. Thus, the optimal installation of the DG at the most susceptible bus for voltage collapse mitigates the trend of system failure.
Conclusion
The re-occurring issue of voltage collapse in the distribution system can be effectively mitigated through the application of the sensitivity-index-based optimization technique. The loss sensitivity optimization method is based on the principle of linearization of the original non-linear equation around the original operating point. In a power system network, the loss sensitivity analysis makes use of RP performance index optimization techniques for solving the first problem of candidate weak buses that are susceptible to voltage collapse. This mitigation approach will then be achieved by supporting those weak buses with renewable energy sourced DG at optimized size on the distribution system network. Hence, the power loss sensitivity index (PLSI) is used to determine the candidate bus for the placement of DGs. The bus with the highest sensitivity indicates the weakest bus and is selected as the best position for DG placement. This will affect voltage improvement, PL reduction, and general reliability of the network. The efficacy of the proposed method is tested with a 30-bus 33kV feeder distribution network (DN) modeled in Power System Software for Engineers (PSS/E). The result shows that among all the selected candidate buses, buses 19, 22, and 30 have a high propensity to voltage collapse in the system. However, bus 30 has the highest PLSI and is seconded by bus 19 and hence the optimal location for the DG is best at bus 30. Additionally, after successful implementation of the mitigation steps, those buses operating below the statutory voltage maximum (0.95 p.u ≤ Vi ≤ 1.05 p.u.) were improved to the regular working standard. After DG placement, the network’s total APL was reduced from 21.84 MW to 18.16 MW, indicating a real PL reduction of 16.8% in the system.
REFERENCES
[1] T. F. Agajie, A. O. Salau, E. A. Hailu, Y. A. Awoke, Power Loss Mitigation and Voltage Profile Improvement with Distributed Generation Using Grid-Based Multi-Objective Harmony Search Algorithm, Journal of Electrical and Electronics Engineering, 13 (2020), No. 2, 5-10.
[2] T. F. Agajie, A. O. Salau, E. A. Hailu, M. Sood, and S. Jain, Optimal Sizing and Siting of Distributed Generators for Minimization of Power Losses and Voltage Deviation, 5th IEEE International Conference on Signal Processing, Computing and Control (ISPCC), (2019), 292-297. DOI: 10.1109/ispcc48220.2019.8988401
[3] A. O. Salau, Y. Gebru, D. A. Bitew, Optimal Network Reconfiguration for Power Loss Minimization and Voltage Profile Enhancement in Distribution Systems, Heliyon, 6 (2020), No. 6, 1-8. DOI: 10.1016/j.heliyon.2020.e04233
[4] K Satish, K Vishal, and T Barjeev, Optimal placement of different type of DG sources in distribution network, Electrical Power and Energy Systems, 53 (2013), 752–760.
[5] H. S. Ravi and H. Sonipat, Optimal Positioning and Sizing of DG Units Using Differential Evolution Algorithm, International Journal of Innovative Research in Science, Engineering and Technology, 5 (2016), No. 9, 17178–17185.
[6] A. Mellit, S.A. Kalogirou, I. Hontoria, and S. Shaari, Artificial Intelligence Techniques for Sizing Photovoltaic Systems: A Review, Renewable, and Sustainable Energy Reviews, 13 (2009), No. 2, 406-419.
[7] N. Acharya, P. Mahat and N. Mithulananthan, An Analytical Approach for DG Allocation in Primary Distribution Network, International Journal of Power and Energy Systems, 28 (2006), 669-678.
[8] C. Wang and M. H. Nehrir, Analytical Approach for Optimal Placement of Generation Sources in Power Systems, IEEE Transaction Power System, 19 (2012), No. 4, 2068- 2076.
[9] Q. H. Duong and M. Nadarajah, Multiple Distributed Generators Placement in primary Distributed Network for loss Reduction, IEEE Transaction Industrial Electronvol. 60 (2013), No. 4, 1700–1708.
[10] M Abbagana. G. A Bakare and I Mustapha, Optimal Placement and Sizing of Distributed Generator in a Power Distribution System Using Differential Evolution, International Journal of Research in Engineering, 2 (2012), No. 4, 26–42.
[11] N. Hassan, M U. Kingsley, and P E. Chinedu, Optimal Location of Facts Device for Improved Power Transfer Capability and System Stability, International Journal of Energy and Power Engineering, 6 (2017), No. 3, 22-27.
[12] R. Verayiah, A. Mohamed, H. Shareef, IZ .Abidin, Review of under-voltage load shedding schemes in power system operation, Przegląd Elektrotechniczny, 90 (2014), No. 7, 99-103.
[13] R. Verayiah, A. Mohamed, H. Shareef, IZ .Abidin, Under voltage load shedding scheme using meta-heuristic optimization methods, Przegląd Elektrotechniczny, 90 (2014), No. 11, 162- 168.
[14] M. H. Hemanth Kumar, G. Vijayshree, R. Prakash, and G. C. Shivsharannappa, Load Flow Analysis Of Distribution Generation System using IEEE-30 Bus System, International Journal of Electrical & Electronics Engineering, 3 (2016), No. 4, 37- 41.
Authors: Dr. Ayodeji Olalekan Salau, Department of Electrical/Electronics and Computer Engineering, Afe Babalola University Ado-Ekiti, Nigeria, E-mail: ayodejisalau98@gmail.com;
Mr. John N. Nweke, Department of Electrical Engineering Technology, Federal Polytechnic Kaura-Namoda, E-mail: nwekejohn71@yahoo.com;
Dr. Uche C. Ogbuefi, Department of Electrical Engineering, University of Nigeria, Nsukka, Nigeria, E-mail: uche.ogbuefi@unn.edu.ng
Source & Publisher Item Identifier: PRZEGLĄD ELEKTROTECHNICZNY, ISSN 0033-2097, R. 97 NR 10/2021. doi:10.15199/48.2021.10.13
