Published by Wojciech NITA1, Sylwester FILIPIAK2, PGE Dystrybucja S.A. Oddział Skarżysko-Kamienna (1), Politechnika Świętokrzyska (2)
Abstract — The article aims to present the application of selected heuristic algorithms to improve the reliability indices of MV distribution grids. Improving the reliability and efficiency of power distribution grids is currently a topical and important issue. The paper includes analyses of selected algorithms, in particular algorithms utilising heuristic methods for multicriteria optimisation of the scope of activities improving the reliability and efficiency of power electric distribution grids. Evolutionary algorithms were also used to determine the fronts of the Pareto optimal solutions sets.
Streszczenie. Celem artykułu jest przedstawienie zastosowania wybranych heurystycznych algorytmów populacyjnych do optymalizacji wskaźników niezawodności sieci dystrybucyjnych SN. Poprawa niezawodności i efektywności systemów dystrybucyjnych energii elektrycznej jest ważnym i aktualnym zagadnieniem. W artykule zastosowano wybrane algorytmy do wielokryterialnej optymalizacji zakresu przedsięwzięć poprawiających niezawodność i efektywność systemów dystrybucyjnych energii na przykładzie wybranej terenowej sieci elektroenergetycznej SN. Zastosowano również algorytmy ewolucyjne w celu wyznaczania frontów zbiorów rozwiązań Pareto – optymalnych (Optymalizacja niezawodności elektroenergetycznych sieci dystrybucyjnych SN z wykorzystaniem populacyjnych algorytmów heurystycznych).
Słowa kluczowe: optymalizacja, sieci elektroenergetyczne, metody ewolucyjne.
Keywords: optimization, power grids, evolutionary methods.
Introduction
The article is an extension of the analyzes presented in [15], which concerned optimization models for power distribution networks. Below is an extension of the methodology presented in [15, 16] with the possibility of including in the distribution network optimization models an extended range of measures to improve the reliability of power electric distribution networks.
The present paper presents the results of analyses aimed at determining efficient methods of optimising the projects implemented to improve the reliability and efficiency of power distribution grids, using as an example an MV power distribution grid. In particular, the purpose of the calculations is to determine which power line sections and power grid devices should be subjected to modernisation works. The problem of the location of devices and selected measures to improve the grid’s reliability was also analysed. Alternative plans for grid modernisation were determined for selected power line sections and power grid devices [14].
The alternative modernisation plans include changing the reliability parameters of specific devices and switching station bays resulting from taking into account the impact of modernisation of grid devices on the analysed MV distribution grid reliability indices. For this purpose, heuristic methods proved useful in solving computationally complex problems were adopted.
The measures and activities that increase the reliability of power grids include [2, 3, 9, 10]:
• installation of radio-controlled switches,
• use of sheathed conductors or change to cable lines,
• increasing the share of live-line operations,
• modernisation of the main power supply station (conversion to the H-5 system),
• shortening MV line sections,
• construction of new connections between the main lines,
• installation of FDIR (Fault Detection, Isolation and load Restoration) automatic systems and short-circuit current flow indicators with edition in the SCADA system,
• installation of an LV fuse burnout control system in MV/LV substations,
Modern technologies and power equipment make it possible to quickly restore the operation of power lines after failure. For this purpose, among others, short-circuit current flow indicators are used to detect the point where the earth fault or phase-to-phase fault occurs. The analysed variant modernisations of the grid selected measures to improve reliability were included [18].
In the analyzed possible variants of modernization of power distribution networks, actual data on the failure frequency of power network devices were taken into account.
The computational methodology used
Heuristic iterative search methods were used to analyse the problem because [1, 4, 11]:
• most of the practical tasks are NP-hard and conventional algorithms cannot be used to solve them,
• these methods do not process the decision variables directly, but their coded forms,
• these methods are gradient less methods – the value of the objective function derivative is not used, but the information about the value of the objective function is used,
• processing of the coded solutions is executed with the use of random procedures, although the entire process remains a deterministic process,
• the primary goal of the algorithm is to improve the current solution, and the optimal solution is the result of such correction.
As far as the heuristic methods are concerned, algorithms were developed based on the observation of nature and physical phenomena.
Such methods include inter alia [17, 19, 20, 21]:
• Simulated Annealing,
• Genetic Algorithm,
• Gases Brownian Motion Optimisation Algorithm,
• Artificial Swarm Intelligence.
The above-mentioned algorithms enable solving complex, multidimensional, discrete or not fully defined problems [1, 2]. Heuristic methods can be classified as local search methods and population search methods. In the second group, the entire population of solutions is processed. Examples of such algorithms are evolution and swarm algorithms. Population algorithms include inter alia [7, 12]:
• Genetic Algorithms,
• Evolutionary Strategies,
• Particle Swarm Optimisation,
• Moth-Flame Optimization
Based on the properties of these methods, it can be concluded that swarm optimisation algorithms, as well as genetic and evolutionary algorithms, can be useful in solving the problem analysed in the present paper. The issue discussed uses decision variables from discrete sets (selection of new devices localisation and modernisation of the existing devices) and continuous sets (modernisation of MV line sections along a selected line length). The analysed problem was considered using the approach that aggregates the criteria functions and a set of Pareto optimal solutions was determined.
The efficiency of the evolution algorithms based on the Pareto concept was confirmed for problems with three goals [6, 8]. As the number of goals increases, using these methods becomes less effective. The following problems can be distinguished when more than three goals are considered [7, 8]:
• the selection pressure based on Pareto dominance towards the Pareto front decreases as the number of goals increases. Almost all solutions in the population are not dominated when the number of goals is large,
• in order to bring the Pareto front closer, an exponential increase in the number of solutions is required.
In the algorithms based on the Pareto concept, new dominance relations are searched for to maintain the required selection pressure. This group of methods includes the NSGA-II, NSGA-III ( Nondominated Sorting Genetic Algorithm), SPEA2, evMOGA, MOGA/D and many other algorithms [6, 13].
The NSGA-III multi-criteria evolution algorithm that is in line with the NSGA-II structure is based on the reference benchmarks consideration [6]. This algorithm promotes population elements that are not dominated but are close to a set of benchmarks. The ev-MOGA algorithm is also very efficient. It is an elite, multitasking algorithm [13]. The above-mentioned algorithms were used to analyse the problem under consideration.
Computational models
The calculations take into account the values of power grid equipment reliability indices resulting from the modernisation measures implemented to MV distribution grids. The scope of the modernisation works included, inter alia, installation of better equipment, taking into account the radio-controlled switches and reclosers installed on the power lines systems.
The reliability indices that are crucial for the distribution grid are inter alia:
• expected number of disturbances (power outages),
• the average duration of a single disturbance,
• the expected value of disconnected power or undelivered electric energy.
One of the methods used in assessing the reliability of power grids is the partial intensity of disturbances method. This method is based on the knowledge of the disturbance intensity and the average disturbance time of the analysed structure elements [5 ,18].
For the system consisting of m number of elements connected in parallel, the following dependency can be used:

where: N – the average intensity of disturbances, taw – average duration of a single disturbance,
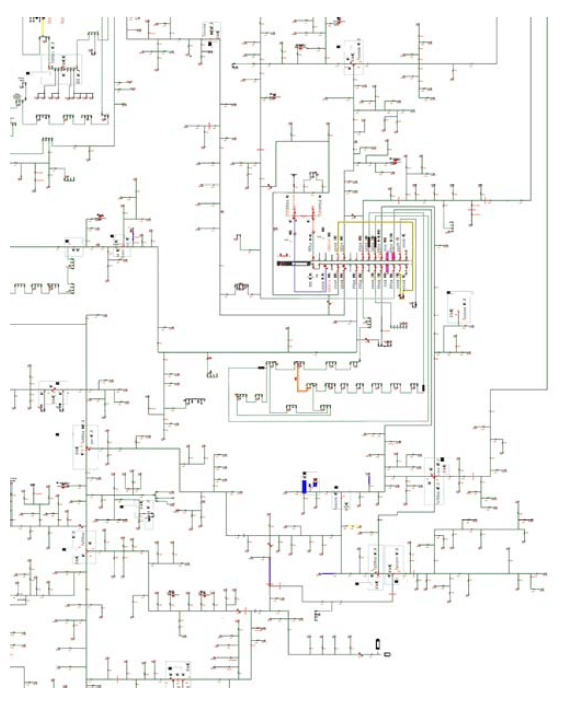
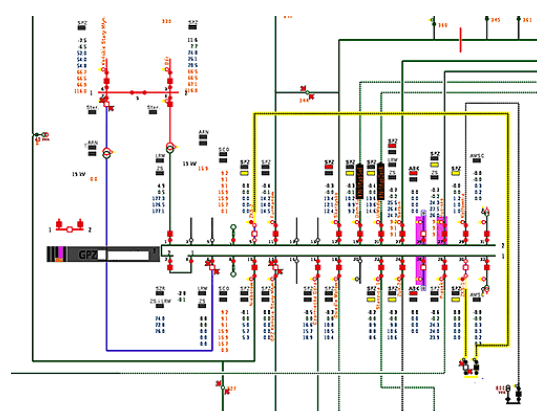
The MV power grid model that was modelled in the Matlab program and presented in Figures 1 and 2 was analysed.
There are several indices used in the world to assess the reliability (continuity) of the power supply. The most frequently used are [5, 12]:
• SAIFI (System Average Interruption Frequency Index) – a system index of the average number of power outages per end-user, defined as the ratio of all unplanned power outages during the year to the number of endusers connected to the grid. SAIFI does not include short power outages of less than 3 minutes [pcs/enduser].
• SAIDI (System Average Interruption Duration Index) – a system index of the average annual total time of power outages, determined as the annual total time of all power outages divided by the total number of end-users connected to the grid [minutes/end-user].
• MAIFI (Momentary Average Interruption Frequency Index) – an index of the average number of temporary power outages for the end-users, determined as the average annual number of power outages shorter than 3 minutes or shorter than 1 minute that the end-user can expect. It is calculated as the quotient of the number of all short outages during the year to the number of endusers connected to the grid.
The tables below contain the values of reliability indices for the MV line sections before and after the analysed distribution grid MV modernisation. SAIFI, SAIDI, MAIFI reliability indices for grid devices were calculated taking into account the value of failure duration, failure intensity and other indices.
Table 1. Reliability indexes of the MV line section before and after modernisation

The following optimisation criteria were taken into account in the developed models of the analysed grid:
• reduction of the resultant SAIFI index (alternatively MAIFI),
• reduction of the resultant SAIDI index,
• reduction of expenditure on modernisation of the MV grid,
• reduction of grid technical losses,
• reduction of the MV grids operating costs.
For the analysed problem, the implementation of calculations with the use of an aggregating approach was adopted, as well as the methodology of multi-criteria calculations with the use of evolutionary algorithms, allowing to find sets of Pareto optimal solutions.
The solutions were sought taking into account the fulfilment of technical conditions regarding load capacity, throughput, voltage conditions and short-circuit parameters. The decision variables in the analysed task are the values of the decision variables (between 0.0 and 1.0) that determine the scope of modernisation of selected grid devices and the selection of grid elements to be modernised.
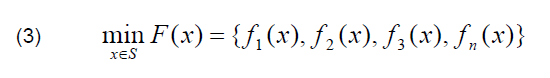
For the proposed coding method, operators changing the values of decision variables were used, keeping their values within the designated range to ensure the correctness of the solutions. The following vector objective function was adopted for the calculations:
f1(x) – minimisation of the resultant SAIFI index:

where: ni – number of unplanned outages at end-users in a given location, Li – number of end-users,
f2(x) – reduction of the resultant SAIDI index:
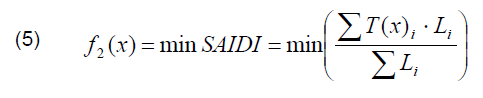
where: Ti – time of end-users power outage in the given location,
f3(x) – reduction of the resultant MAIFI index:

f4(x) – determines the energy effect of reducing energy loss in the lines of the analysed MV grid (longitudinal power losses in grid components were taken into account):

with: τi – duration of the largest load losses in the ith MV line, Rmi – resistance of the ith section of the line after modernisation,
For the analysed grid, the values of SAIFI, SAIDI and MAIFI reliability indices were determined for individual MV line sections. In these calculations, the values of failure intensity and failure duration were assumed, taking into account the length of the MV line section to be modernised and the technologies to be used for the modernisation [5,6].
Calculation example
During the calculation, an aggregated approach was used and the objective function taking into account the four adopted criteria.
The calculation procedure for determining solutions had the following stages of calculations:
• loading the technical and reliability data collected for the analysed grid system,
• decoding variants of solutions in which decision variables are taken from discrete sets (choice of location or modernisation of devices) continuous decision variables (modernisation of MV line sections along a selected line length).
• calculation of power flow in the analysed MV grid,
• calculation of the resultant reliability indices for the analysed MV grid,
• calculating the value of the aggregate objective function (or separately criterion functions for determining the set of Pareto optimal solutions).
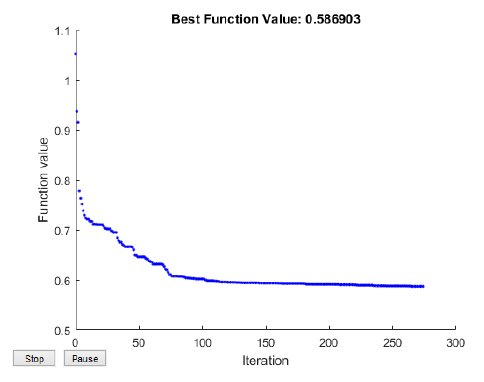
The results of the calculations using the genetic algorithm are presented in Charts 3 and 4, while Charts 5 and 6 show the course of calculations using the swarm algorithm.

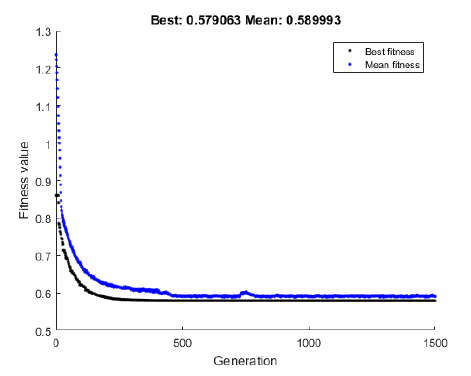
Calculated solution describes of MV grid system with marked components of the analysed grid selected for modernisation and with marked locations of devices improving the failure rates of the analysed MV distribution grid.
The performed analyses confirmed the usefulness of the algorithms used to optimise the scope of projects increasing the efficiency of MV distribution systems. The results of solutions with the use of selected heuristic algorithms include information on the selection of grid equipment to be modernised and the scope of the modernisation.
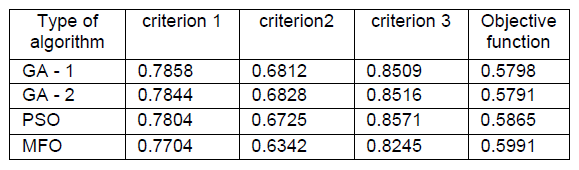
Tables 2 and 3 contain the calculated values of the criterion functions for the obtained solutions and the calculated values of the reliability indexes of the individual line sections of the analysed MV distribution grid.
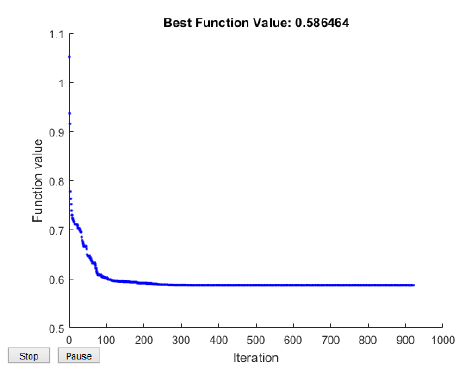
Table 2. Values of reliability indexes of MV line sections after modernisation

Table 3. Values of criterion functions for the obtained solutions
A graphic presentation of the designated solution is shown in Figure 7, which shows a diagram of the considered MV grid system with marked components of the analysed grid selected for modernisation and with marked locations of devices improving the failure rates of the analysed MV distribution grid.
As a result of the calculations, it was determined measures implemented to improve the reliability indices of the MV distribution grid. Among others, they include optimal locations for measures to improve grid efficiency in the form of, for example locations of radio-controlled switches. In table 4 contains a description of measures designated for the modernisation of individual MV lines.
Table 4. Description of measures designated for the modernisation
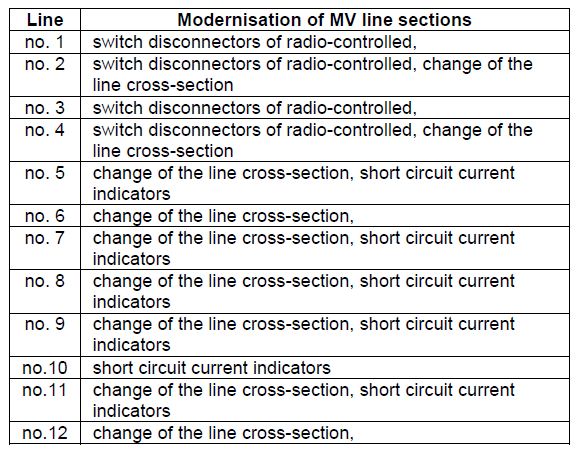

In this table, the calculated measures and devices to improve the grid reliability were determined for successive MV line sections in the form of appropriate switchgear and distribution equipment, or the conversion of lines using different technology. For the scope of the considered grid modernisation projects defined using discrete variables (location of new devices and modernisation of the existing ones) and continuous variables (modernisation of MV line sections along a selected length), criterion functions were calculated using the formulas given above.
An important part of these calculations are the dependencies and definitions used to calculate the reliability indices (including reliability coefficients, failure intensity and duration of failures and power outages) for individual analysed power line sections and the entire analysed fragment of the grid. Following the described definitions, SAIFI, SAIDI and MAIFI indices for individual MV line sections and the entire fragment of the distribution grid were then calculated.
In the further part of the paper, the problem with the use of selected multi-criteria evolution algorithms is analysed. NSGA II and III, SPEA2 and ev-MOGA algorithms were used for the calculations [2, 6]. These algorithms allow determining sets of Pareto optimal solutions. The chart below presents the Pareto optimal solutions fronts found using these algorithms.
In global optimisation, the quality of the algorithm can be evaluated based on the global optimum found, and e.g. through the number of objective function calls. In multicriteria optimisation, two categories of algorithm evaluation are distinguished [13]:
• performance related to the number of iterations, the number of objective function calls,
• efficiency, including the accuracy and convergence of the solutions found.
When assessing the effectiveness of the algorithm, one should evaluate how the found solution front is close to the real (or known) front and how the solutions are distributed along the front. In the analysed case, it was stated that the fronts of solutions that have been found using three different evolutionary algorithms coincide, which proves the convergence of the results obtained with different methods. In the following graphs (8 and 9), the calculated values of the criterion functions are described in relative units. A chart with the identified Pareto fronts and dotted solutions, obtained according to the aggregated approach is presented in Figure 9.
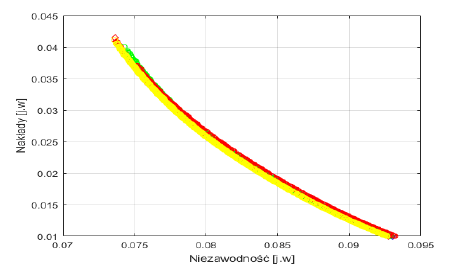
After the analysis, it was discovered that the individual solutions found through the aggregated methodology were arranged along the identified front of solutions. It serves as a confirmation that the convergence of the results obtained with various methods, including the criteria aggregating methods and the independent adoption of individual criteria (when searching the Pareto optimal sets).


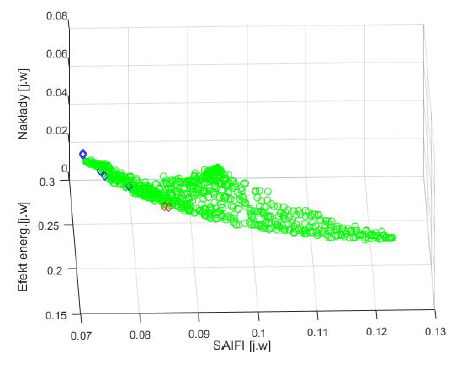
Calculations were also made to determine a set of Pareto optimal solutions with the use of the NSGA II algorithm for three criteria: reduction of grid failure rates, reduction of technical losses and reduction of capital expenditure. The result of the calculations is shown in Figure 10.
As a result of further analyses, sets of solutions for those three criteria were obtained using three algorithms, NSGAII, SPEA2 and evMOGA, as shown in Figure 11.

Figure 12 shows the set of solutions obtained using the NSGA II algorithm for the three selected criteria. Whereas Charts 12 and 14 presents, apart from the information in Figure 12, individual points are marked representing solutions obtained using the aggregated approach.

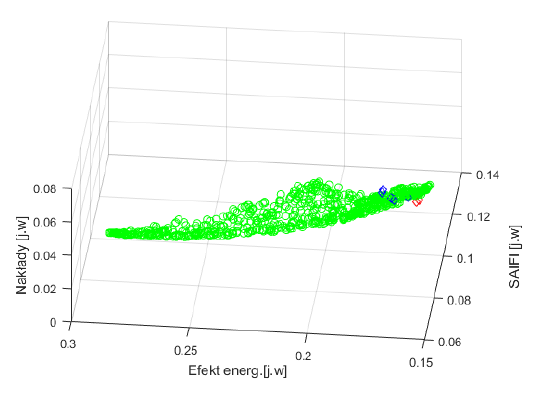
The charts show a comparison of the obtained results. The performed analyses prove the reasonableness of using heuristic algorithms, including evolutionary algorithms, to determine measures to be implemented to increase the distribution grids reliability.
Conclusions
The article contains the results and conclusions of the analyses carried out in the field of optimisation calculations with selected algorithms for the analysed problem of determining the scope of modernisation projects for the selected power electric distribution grids. The application of selected evolutionary algorithms for the determination of Pareto optimal solutions and the determination of Pareto fronts for the optimisation problem of a selected MV power distribution grid was also analysed.
In addition, the proposed methodology of evolutionary calculations can be used in practice for optimisation and preparation of complex distribution grids modernisation schedules, including the grids with a very large number of elements. The obtained sets of Pareto optimal solutions contain alternative sets of solutions distributed along the obtained Pareto front, which allows for a detailed analysis of the most interesting range of solutions for the decisionmakers.
The calculations were performed using various heuristic methods and the calculations show a high level of convergence, allowing to review possible solutions for the analysed problem.
REFERENCES
[1] Abedini M., Moradi M.H.: A combination of genetic algorithm and particle swarm optimization for optimal DG location and sizing in distribution systems. International Journal of Electrical Power & Energy Systems. Volume 34, Issue 1, January 2012, pp. 66–74.
[2] Acharya N., Mahat P, Mithulananthan N.: An analytical approach for DG allocation in primary distribution network”, International Journal of Electrical Power & Energy Systems, vol. 28, 10, 2016, p.669-678.
[3] Banasik K., Chojnacki A. Ł.: Effects of unreliability of electricity distribution systems for municipal customers in urban and rural areas, Przegląd Elektrotechniczny Nr 05/2019, p. 179-183.
[4] Bobric E. C., Cartina G., Grigoras G.: Fuzzy Technique used for Energy Loss Determination in Medium and Low Voltage Networks. Electronics and Electrical Engineering. – Kaunas: Technologija, 2009. – No. 2(90). – P. 95–98.
[5] Chojnacki A.: Assessment of the Risk of Damage to 110 kV Overhead Lines Due to Wind. Energies, 2021, p. 1-14.
[6] Ciro G., Dugardin F., Yalaoui F., Kelly R.: A NSGA-II and NSGA-III comparison for solving an open shop scheduling problem with resource constraints. IFAC, International Federation of Automatic Control, 2016 s. 1272–1277.
[7] Delbem A. C. B., Carvalho A. C. P. L. F., Bretas N. G.: Main chain representation for evolutionary algorithms applied to distribution system reconfiguration. IEEE Trans. Power Systems, vol. 20, no. 1, Feb. 2015, pp. 425-436.
[8] Guohua Fang, Wei Guo, Xianfeng Huang, Xinyi Si, Fei Yang, Qian Luo, Ke Yan: A New Multi-objective Optimization Algorithm: MOAFSA and its Application. Przegląd Elektrotechniczny, R. 88 Nr 9b/2012, s. 172-176.
[9] Helt P., Parol M., Piotrowski P.: Metody sztucznej inteligencji – przykłady zastosowań w elektroenergetyce. Oficyna Wydawnicza Politechniki Warszawskiej, 2012.
[10] Hong Y. Y., Ho S. Y.: Determination of network configuration considering multiobjective in distribution systems using genetic algorithms. IEEE Trans. Power Systems, 2005. – Vol. 20. – No.2– p. 1062–1069.
[11] Kamrat W.: Metody oceny efektywności inwestowania w elektroenergetyce, Monografia Wydawnictwo PAN, Warszawa 2004.
[12] Khushalani S., Solanki, J.M., Schulz, N.N.: Optimized Restoration of Unbalanced Distribution Systems. IEEE Transactions on Power Systems, no. 22, Issue 2. 2017, p. 624- 630.
[13] Kumar Y., Das, B., Sharma, J.: Multiobjective, Multiconstraint Service Restoration of Electric Power Distribution System With Priority Customers. IEEE Transactions on Power Delivery, no. 23, Issue 1, 2008, p. 261-270.
[14] Marzecki J., Drab M.: Obciążenia i rozpływy mocy w sieci terenowej średniego napięcia-wybrane problemy. Przegląd Elektrotechniczny, R.91, pp. 192-195, luty, Nr 2, 2015.
[15] Nita W., Filipiak S.: Planowanie przebudowy terenowych sieci dystrybucyjnych SN metodami ewolucyjnymi. Przegląd Elektrotechniczny s. 92-98 Nr 4/2021.
[16] Nita W.: Optymalne planowanie przebudowy elektroenergetycznych terenowych sieci dystrybucyjnych SN za pomocą metod ewolucyjnych, Rozprawa Doktorska, Politechnika Świętokrzyska 2020.
[17] Ouyang, W.& Cheng, H.& Zhang, X.& Yao, L.& Bazargan, M.: Distribution network planning considering distributed generation by genetic algorithm combined with graph theory, Electric Power Components Systems, vol. 38, 3, 2019, p.325-339.
[18] Parol M: Analiza wskaźników dotyczących przerw w dostarczaniu energii elektrycznej na poziomie sieci dystrybucyjnych. Przegląd Elektrotechniczny s. 122-126 Nr 8/2014.
[19] Sowiński J.: Forecast of electricity supply using adaptive neurofuzzy inference system, May 2017, Conference: 2017 18th International Scientific Conference on Electric Power Engineering (EPE), DOI:10.1109/EPE.2017.7967248,
[20] Sowiński J.: Use of load volatility description in modelling of energy balance in the section “electricity supply”, January 2017, Rynek Energii 128, s. 35-39.
[21] Parol M., Baczyński D., Brożek J.: Optimisation of Urban MV Multi-Loop Electric Power Distribution Networks Structure by Means of Artificial Intelligence Methods, Control and Cybernetics, 2012, vol. 41 (2012), s.667-689.
Autorzy: dr inż. Wojciech Nita, PGE Dystrybucja S.A. Oddział Skarżysko-Kamienna, dr hab. inż. Sylwester Filipiak prof. PŚk, Politechnika Świętokrzyska w Kielcach, Katedra Elektrotechniki Przemysłowej i Automatyki, E-mail: filipiak@tu.kielce.pl
Source & Publisher Item Identifier: PRZEGLĄD ELEKTROTECHNICZNY, ISSN 0033-2097, R. 98 NR 6/2022. doi:10.15199/48.2022.06.09
