Published by Łukasz GRĄKOWSKI, Andrzej Ł. CHOJNACKI, Katarzyna GĘBCZYK, Kornelia BANASIK Kielce University of Technology, Faculty of Electrical Engineering, Automatic Control and Computer Science
Abstract: The paper present a thorough analysis of seasonality and causes of failures of low voltage overhead lines. Such lines are mainly characteristic of rural areas. An average duration of failures, average duration of emergency shutdown and average duration of power supply interruptions were determined. Based on empirical data, probability density functions for the above-mentioned times were also determined.
Streszczenie: W artykule przedstawiona została wnikliwa analiza sezonowości oraz przyczyn awarii linii napowietrznych niskiego napięcia. Linie takie są charakterystyczne przede wszystkim dla terenów wiejskich. Wyznaczono średni czas trwania awarii, średni czas trwania wyłączenia awaryjnego oraz średni czas trwania przerw w zasilaniu odbiorców. Na podstawie danych empirycznych wyznaczono również funkcje gęstości prawdopodobieństwa dla ww. czasów. (Analiza statystyczna oraz modelowanie niezawodności linii elektroenergetycznych niskiego napięcia).
Keywords: overhead LV lines, reliability, power industry
Słowa kluczowe: linie napowietrzne nN, niezawodność, energetyka
Introduction
Modern electricity customers have very high demands regarding the quality and continuity of electricity supply. The total length of overhead LV lines and the number of customers connected to them is systematically increasing. Such a situation increases the risk of restrictions in the supply of electricity to customers in the event of a failure of the transmission system. This results in significant material damage and, in extreme cases, can lead to a risk to human health or life.
Over the last few years, in connection with, among others, Poland’s accession to the European Union, the interest in the problem of reliability of power systems has increased. The reason for this is the fact that even the shortest interruption results in dissatisfaction of electricity consumers and material losses. High reliability of operation of LV lines allows to reduce the time of interruptions in power supply to customers, and thus to minimize the costs of losses resulting from the lack of power supply to customers [5].
Low-voltage networks consist mainly of overhead lines, cable lines, cable and overhead connections, as well as all kinds of connectors. Overhead lines are used primarily in field networks, while cable lines are mostly used in urban networks. Overhead LV networks are usually built as radial systems, while cable networks are built as loop systems with partitions in the cable joint.
Low-voltage overhead lines are built in many different variants. In domestic distribution companies, aluminium wires are commonly used for the construction of overhead LV lines; copper wires are very rarely used and steel-aluminium wires are used in exceptional cases. Currently, mainly single-metal wires with cross-sections from 16 mm2 to even 120 mm2 are used.
In low-voltage overhead lines, insulated wires in the form of twisted pair solid wires or multiconductor insulated wires are increasingly used. The disadvantage of insulated wires is their high price. On the other hand, when using insulated wires, purchasing such components as insulators or crossbars is unnecessary. In such case, the total cost of construction is only slightly higher than the cost of construction of a line with bare conductors, with significant reduction in the amount of interferences (especially transient ones) during operation [1].
Insulators are used to separate (isolate) live line conductors from the supporting structures and from each other. LV lines mainly use single- or double-groove standing insulators. For dead-end and corner poles with significant tension forces, spool insulators are used. The material used for the construction of LV insulators is mainly porcelain [2].
The supporting structures of low-voltage lines are power poles. Depending on the function performed, the following types of poles are distinguished: straight-line poles, corner poles, resistance poles, corner resistance poles, dead-end poles and branch poles. Currently, reinforced concrete structures are used as the basic type of poles.
Class A surge arresters are instruments designed to protect devices installed in low-voltage overhead lines. They are adapted to be installed outside the protected building (pole connections).
The basic components of LV overhead line accessories include hooks, holders, connectors, clamps and ties [3, 7].
In his paper, the author presented the results of reliability tests of LV overhead lines operated in domestic distribution companies. The research concerned the causes of failures and seasonal variability in the frequency of defects. The author also conducted an analysis of the duration of failures, duration of emergency shutdowns and duration of interruptions in power supply to consumers. All the analyses were carried out at the level of significance α=0.05 [6, 8, 9, 10].
Analysis of seasonality and causes of failures
The monitoring of the failure rate of LV overhead lines covers a period of 10 years. During that time a total of 10458 failures occurred. The number of failures of individual groups of devices is presented in Table 1. Table 2 shows the failures of LV overhead lines in individual months. Figure 1 shows a histogram of the empirical frequency of failures in the subsequent months of the year and the approximation function.
Table. 1. Failures observed on LV overhead lines over 10 years of observation

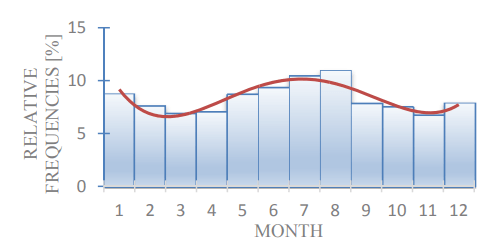
The greatest number of failures was observed in summer months (May – August) and winter months (January – December). During the summer period, 4135 failures occurred, which makes up for 39.5% of all damages. During winter months, 1742 failures occurred, which makes up for 16.7% of all damages. In the remaining months, the failure rate of overhead LV lines is below the average damage intensity of 8.33%.
The seasonal variability in the frequency of failures over a year can be described by means of an approximation function in the following form:
(1) f(i) = a·i4 + b·i3 + c·i2 + d·i + e
where: i – consecutive month number, a, b, c, d, e – approximation function coefficients.
The coefficients of approximation function of seasonal variability of failure frequency of LV overhead lines are: a = 0.0103, b = – 0.2815, c = 2.5181, d = – 8.0493, e = 14.968. The correlation coefficient between empirical values and the approximation function is r = 0.92.
The percentage share of LV overhead lines failure causes is given in Table 3 and graphically presented in Figure 2. The percentage share of individual causes of failures in the total number of failures is shown in Figure 3.
Table. 2. Summary of the number of failures in each month

Table. 3. Causes of defects of LV overhead lines in each month
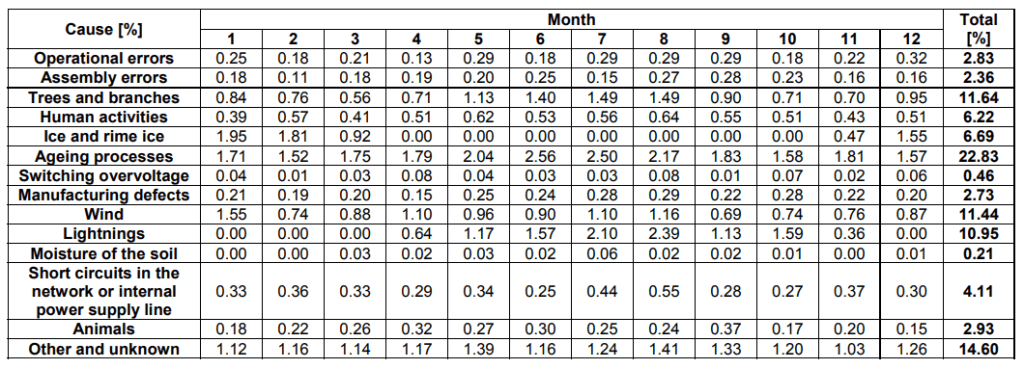

The most frequent cause of LV overhead line failures are ageing processes, which caused about 22.83% of all damages. Other causes were trees/branches and wind, which caused 11.64% and 11.45% of all damages, respectively. Seasonal causes, but with a significant impact on the failure rate of LV overhead lines, are lightnings and ice/rime ice. They caused 10.95% and 6.70% of all damages, respectively.

Duration of failure
Duration of failure ta determines the transition of the device from failure state back to usability state. It is a very important parameter used to determine the extent of the failure, as well as its economic and business consequences [3, 4, 11, 13].
Statistics on the duration of LV overhead line failures include 10458 cases. On the basis of empirical data, a hypothesis on log-normal distribution of duration of failures was assumed. The empirical and theoretical course of LV overhead line failure duration is shown in Figure 4. The determined values of distribution parameters are as follows:
m = 1.88 and σ = 1.14. Parametric verification was also carried out. Obtained parameter values: t̄a = 11.30 h, s = 13.29 h and confidence interval for an average value of 11.05 h < t̄a < 11.56 h.
The average failure rate parameters of LV overhead lines obtained from the research are as follows: ¯λa = 62.3614 1/a·100km and qa = 74.45·10-3 1/100km.

Duration of emergency shutdown
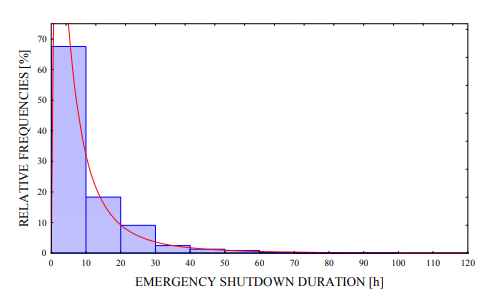
Duration of emergency shutdown twa is the time counted from the moment the object is shut down as a result of its damage to the moment the object is switched on after its repair [3]. Statistics on the duration of emergency shutdowns of LV overhead lines include 10344 cases. On the basis of empirical data, a hypothesis on log-normal distribution of duration of emergency shutdowns was assumed. The empirical and theoretical course of duration of emergency shutdowns of LV overhead lines is shown in Figure 5. The determined values of distribution parameters are as follows:
m = 1.73 and σ = 1.15. Parametric verification was also carried out. Obtained parameter values: t̄wa = 9.68 h, s = 10.98 h and confidence interval for an average value of 9.47 h < twa < 9.90 h.
The average failure rate parameters of LV overhead lines obtained from the research are as follows: ¯λwa= 61.6816 1/a·100km and qwa = 63.81·10-3 1/100km.
Duration of interruptions in power supply to consumers
The time of interruption in power supply to consumers tp is the time counted from the moment of the failure to the moment of restoring power supply to the consumer [12]. Therefore, it is the time when consumers have no access to electricity. Statistics on the duration of interruptions in power supply to consumers include 9983 cases. On the basis of empirical data, a hypothesis on log-normal distribution of the duration of interruptions in power supply was assumed.
The empirical and theoretical course of the duration of power supply interruptions is shown in Figure 6. The determined values of distribution parameters are as follows:
m = 0.95 and σ = 1.61. Parametric verification was also carried out. Obtained parameter values: t̄p = 5.34 h, s = 7.54 h and confidence interval for an average value of 5.19 h < tp < 5.49 h.
The average failure rate parameters of LV overhead lines obtained from the research are as follows: ¯λp = 59.5289 1/a·100km and qp = 35.02·10-3 1/100km.

Summary
LV overhead lines are the final element of the power distribution system (mainly in rural areas). Modern electricity customers (including rural ones) have very high demands regarding the quality and continuity of electricity supply. The reason for this is the fact that even the shortest interruption results in dissatisfaction of electricity consumers and material losses. High reliability of operation of LV overhead lines allows to reduce the time of interruptions in power supply to customers, and thus to minimize the costs of losses resulting from the lack of power supply to customers.
Due to their low energy consumption, rural networks have been treated for many years as distribution systems of minor importance. As a result of this, practically no research was conducted on the problem of the quality and reliability of electricity supply to consumers in rural areas. A significant increase in load in recent years has resulted in an increase in the number of failures in field LV networks. Therefore, it was necessary to conduct comprehensive reliability tests of these power systems in order to determine the methods of their operation.
Due to the limited size of this paper, only a fragment of the analysis concerning the durations of failures, durations of emergency shutdowns and durations of interruptions in power supply to consumers, as well as seasonality and causes of failures was presented. The determined values of the reliability parameters are as follows:
t̄a = 11.30 h, ¯λa = 62.3614 1/a·100km, qa = 74.45·10-3 1/100km, t̄wa = 9.68 h, ¯λwa= 61.6816 1/a·100km, qwa = 63.81·10-3 1/100km, t̄p = 5.34 h, ¯λp = 59.5289 1/a·100km, qp = 35.02·10-3 1/100km.
The probability density functions of durations of failures, durations of emergency shutdowns and durations of interruptions in power supply to consumers were determined. The proposed probability distributions are log-normal distributions. An analysis of seasonality and causes of failures was performed. On its basis it can be concluded that inspections, repairs and measurements of LV overhead lines should be carried out in March, April and November, as the intensity of failure is the lowest in these months. The period of increased intensity of damage are the spring and summer months. The most common causes of failure were ageing processes, trees and branches, wind and lightnings. While we have no influence on the weather conditions, we can significantly improve the reliability of power grids by increasing the frequency of inspections and repairs.
REFERENCES
[1] S. Asgarpoor, H. Ge, Reliability Evaluation of Equipment and Substations With Fuzzy Markov Processes, IEEE Transactions On Power Systems, Vol. 25, No. 3, August 2010, p. 1319-1328
[2] J. T. Burnham, R. J. Waidelich, Gunshot damage to ceramic and nonceramic insulators. IEEE Trans. Power Delivery, Vol. 12, No. 4, 1997, p. 1651-1556
[3] A. Ł. Chojnacki, Analiza niezawodności eksploatacyjnej elektroenergetycznych sieci dystrybucyjnych, Rozprawa habilitacyjna, Kielce 2013.
[4] A. Ł. Chojnacki, Analiza niezawodności stacji elektroenergetycznych SN/nN w warunkach eksploatacji, Rozprawa doktorska, Kielce 2005.
[5] A. Ł. Chojnacki, Modelowanie niezawodności napowietrznych stacji transformatorowo-rozdzielczych SN, IV Konferencja Naukowa PTETiS „Modelowanie i Symulacja”, Kościelisko 2006, p. 93-102.
[6] Z. Kowalski, Niezawodność zasilania odbiorców energii elektrycznej, Wydawnictwo Politechniki Łódzkiej, Łódź 1992.
[7] S. Kujszczyk, Elektroenergetyczne sieci rozdzielcze, tom I, Wydawnictwo naukowe PWN, Warszawa 1994.
[8] S. Lesiński, Niezawodność urządzeń elektrycznych, Wydawnictwo Politechniki Łódzkiej, Łódź 1989.
[9] J. Paska, Niezawodność systemów elektroenergetycznych, Oficyna wydawnicza Politechniki Warszawskiej, Warszawa 2005.
[10] J. Popczyk, Modele probabilistyczne w sieciach elektroenergetycznych, Wydawnictwo Naukowo-Techniczne, Warszawa 1991.
[11] J. Sozański, Niezawodność zasilania energią elektryczną, Wydawnictwo Naukowo-Techniczne, Warszawa 1982.
[12] J. C. Stępień, Metody analizy i oceny niezawodności kablowych układów zasilających średnich napięć, Rozprawa habilitacyjna, Kielce 2011.
[13] A. Stobiecki, Analiza parametrów niezawodnościowych transformatorów rozdzielczych średnich napięć, Rozprawa doktorska, Kielce 2006.
Authors: M.Sc. Eng. Łukasz Grąkowski, PhD Eng. Andrzej Ł. Chojnacki, M.Sc. Eng. Katarzyna Gębczyk, M.Sc. Eng. Kornelia Banasik, Department of Energy Basics, Kielce University of Technology, Faculty of Electrical Engineering, Automatic Control and Computer Science Poland, lgrakowski@tu.kielce.pl, a.chojnacki@tu.kielce.pl, kgebczyk@tu.kielce.pl, k.banasik@tu.kielce.pl
Source & Publisher Item Identifier: PRZEGLĄD ELEKTROTECHNICZNY, ISSN 0033-2097, R. 95 NR 12/2019. doi:10.15199/48.2019.12.59
