Published by Yusri Syam AKIL, Wardi, Zaenab MUSLIMIN, Kifayah AMAR, Hasanuddin University, Indonesia
Abstract. This study has focus to investigate a number of aspects that influencing electricity consumption for urban household in Indonesia. For this purpose, a questionnaire is developed to get primary data from two cities, namely Makassar and Yogyakarta. The collected data are analyzed using statistical approach. From analysis of 231 usable data obtained in September and October 2020, majority occupants have practiced specific energy saving lifestyle at their homes although the usage of energy efficiency appliances (EEA) is still low. Higher cost to buy EEA, the absence of non-flat electricity tariff scheme and energy management supporting system are some main barriers to support further occupants in reducing consumption. Another result from regression model revealed that income variable, family size, and installed electricity at home (IEA) are significant predictors for electricity consumption. The variables can explain variation of the household consumption around 47% where the IEA is the most predictor. Provided information can assist power utility in Indonesia in designing more realistic strategy to promote energy saving program or to propose wise ways in managing energy usage for household sector.
Streszczenie. Praca ma na celu zbadanie szeregu aspektów wpływających na zużycie energii elektrycznej przez gospodarstwa domowe w Indonezji. W tym celu opracowano kwestionariusz, aby uzyskać podstawowe dane z dwóch miast, a mianowicie Makassar i Yogyakarta. Zebrane dane są analizowane za pomocą podejścia statystycznego. Z analizy 231 użytecznych danych uzyskanych we wrześniu i październiku 2020 r. Wynika, że większość mieszkańców prowadzi w swoich domach określony tryb życia oszczędzający energię, chociaż użycie urządzeń energooszczędnych (EEA) jest nadal niskie. Wyższe koszty zakupu EOG, brak taryfy opłat za energię elektryczną i systemu wspierającego zarządzanie energią to główne bariery wspierające mieszkańców w ograniczaniu zużycia energii. (Zarządzanie zużyciem energii elektrycznej w sektorze gospodarstw domowych w Indonezji)
Keywords: Managing electricity consumption, energy saving, household sector, Indonesia.
Słowa kluczowe: zarządzanie zużyciem energii, gospodatrstw domowe.
Introduction
Household electricity consumption in many countries contributes a large share to the total load of power systems including in Indonesia. Because of consumed high energy, it is important to know its characteristic and load driver variables as a basis to manage energy use effectively. Managing consumption to improve efficiency of electricity use is meaningful as it can help such as to mitigate climate change, to face the increasing price and shortage for fuel, and to reduce energy cost [1,2]. In general, household electricity consumption can be affected by various factors including demographic variable, household building characteristic, type of appliances, consumer’s behavior, and weather condition [3-7]. However, data or information about some of the variables often limited and even not available at certain places. Therefore, it is challenging task for researcher to get required data and conducting analysis. One common way to get data is performing survey to consumers using questionnaire. As a tool analysis, there are some methods that can be applied and one of them is statistical approach.
Previous works worldwide have discussed similar cases. For example, in [8] analyzed characteristic of electricity energy for urban household in China. The authors used online survey to get information such as building characteristics, behaviors of residents, and existing energy consumption by applying statistical analysis. In [9] studied profile electricity consumption for household and commercial sector in Malaysia by performing monitoring for some main appliances that consumed high energy. The characteristics of consumption and potential energy saving are also analyzed. Questionnaire is used in the study to collect required information from users such as electric equipment’s data and usage duration. In [10] analyzed determinants for English household electricity energy consumption. Survey is done to obtain various information from users such as building data, the use of electric appliances, and socio-demographic characteristic. In [11] analyzed residential electricity consumption in U.S. in relation to lifestyle factors. Five different factors are observed by the authors using data survey included the usage of AC at home, laundry, personal computer, TV, and climate zone of user. Next the data are analyzed using multiple regression technique. In [12] studied electric appliances and their usage in effecting electricity consumption in UK homes. Survey is done to gather data and used odds ratio analysis to investigate factors that contribute highly to electricity consumption. Recently in [4] performed survey to investigate determinants for household electricity consumption in Cyprus by using correlation and regression analysis. Five different group variables such as demographic variables, household characteristics, and the presence of photovoltaic system are examined by the authors in their study. Another study in [13] performed survey and in-person interview to consumers with intention to analyze typical energy consumption for urban and rural areas in Thailand with focus mainly on the usage of air-conditioned (AC) at home. Household attributes, the using of AC, desire to buy and ownership of home appliances are several aspects analyzed in the study.
In general characteristics and driving factors for household electricity consumption are very complex, dynamic, and can be unique in one place [14]. In other words, the impact of the variables in forming pattern and consumption level may not the same at different places. Therefore it is needed self framework when conducted analysis in terms of must be based on the environment where the occupant is located. As a part of our work, a number of aspects including influencing factors related to electricity consumption for Indonesian household are investigated in this study. The analyzed aspects are demographics characteristics, type of owned electric appliances, occupant’s behavior, perception level, barriers for electricity saving, and season condition in relation to energy consumption. Next, the influences of some various aspects above to electricity consumption are investigated. There are limited studies for Indonesian context can be found in the literatures [15, 16]. In [15] investigated effect of local cultures to household electricity consumption using multivariate analysis. Meanwhile in [16] performed survey to analyze the potential of energy saving from household sector to reduce the building of new power plants. It is expected this present work can fill the gap. Besides that, resulted information can assist power utility in designing more realistic strategy to promote energy saving program or to propose wise ways in managing energy use for household consumers in Indonesia.
Structure of this paper consists of five sections. After general background, it is continued with typical of electricity consumption and household consumers in Indonesia. Next, methodology of research is presented in detail and then results. The last section provides conclusions and future work.
Electricity consumption and household consumers in Indonesia
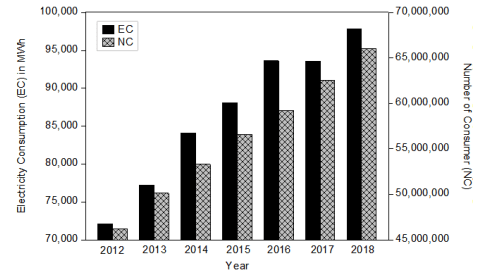
Figure 1 shows annual household electricity consumption in Indonesia and number of consumers for seven consecutive years. From the figure, the electricity consumption tends to increase by time as in year 2012 volume of consumption is around 72.13 GWh and become 97.83 GWh in year 2018. Similar tendency for consumer’s number, namely from 46.21 million in year 2012 and increased becomes 66.01 million in year 2018. This growth trend can continue in the near future. The electricity consumption and consumers from household sector in year 2018 contribute 41.69% and 82.67% to the total consumption and consumers from all electricity sectors, respectively. As the number of household consumers is very high and it can increase higher which may affect consumption level, therefore, it is interesting and useful to analyse Indonesian household electricity consumption as it has big potential to improve energy usage from users side. This work can also support Indonesian government concerning the implementation of energy conservation program [18].
Methodology
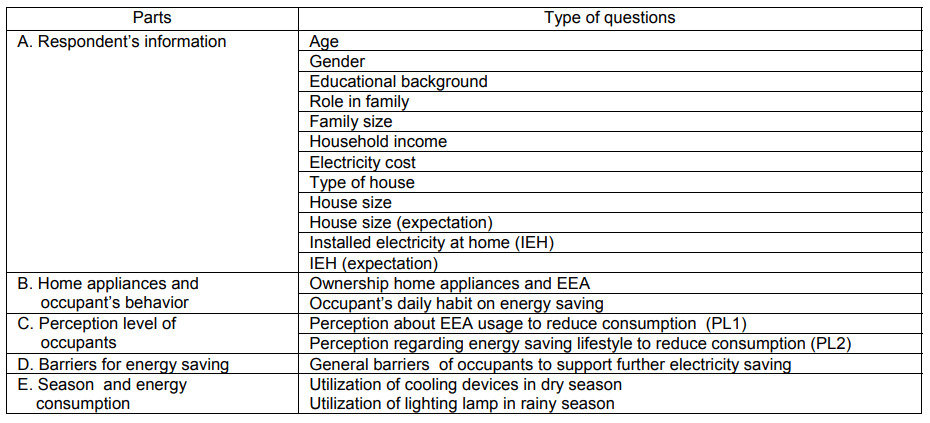
To analyze electricity consumption at home from perspectives such as demographic aspect and occupant’s behavior, survey using questionnaire is usually done [19]. Therefore, a questionnaire is initially developed based on the information from related works [4,8] and some modifications are done to suit occupant’s environment. Systematic questions are divided into five main parts in the questionnaire. Part A is about respondent’s information, Part B is about home appliance and occupant’s behavior, Part C is perception towards electricity saving, Part D is barriers to implement electricity saving, meanwhile questions in the last part is about season in relation to energy consumption. List of questions for each part is shown in Table 1.
Table 1. List of questions for each part
In this study target of respondents is household consumers from two cities in Indonesia namely Makassar and Yogyakarta. Questions’ items for Part C is assessed using 5 point Likert scale and reliability of the questionnaire is examined using Cronbach’s Alpha (α) value. For validation, it is adopted expert validity approach. The Cronbach’s alpha value is formulated in Eq. (1) [20].
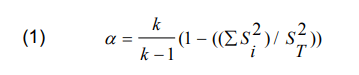
where: k is number of questions items. S2i and S2T are variance for ith item and for summing all existing items, respectively.
Next collected data are analyzed by using statistical approach including regression analysis with intention to reveal more information or to get better understanding regarding determinants of studied electricity consumption. The composed regression model with seven predictor variables is shown in Eq. (2).
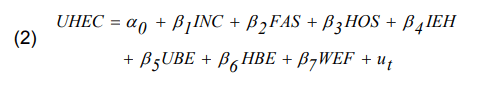
where: UHEC is household electricity consumption which represented by monthly electricity cost. Variable of INC is income, FAS is family size, HOS is home size, IEH is installed electricity capacity at home, UBE is usage behavior, HBE is habit of consumers, and WEF is season variable. Ut is residual term, meanwhile α0 and β are intercept and regression coefficient for each predicting variable considered in UHEC model, respectively. To reduce autocorrelation, autoregressive structure is applied in the residual term of (ut) of the model as in [21,22].
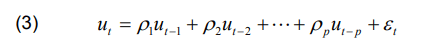
where: ρp is intercept, p and ɛt are autoregressive order and white noise, respectively. Some model options are examined (until 2nd order autoregressive) to find the best one by using common parameters namely Akaike Information Criterion (AIC) test and adj. R2 value. The smaller of AIC value and the higher of adj. R2 , the better of composed model.
Results and analysis
Reliability assessment
To measure reliability of the questionnaire, pilot survey for 30 respondents from Makassar is firstly tested. From analysis, Cronbach’s alpha (α) value is 0.93. The α value which is greater than threshold value for reliability (0.7) shown items in the questionnaire have internal consistency. This confirmed that the designed questionnaire is reliable and appropriate to be used for main survey. Some main results are given as follows.
Participant characteristics
Tables 2 and 3 show respondent and building information from survey (231 usable data which is 129 respondents from Makassar and 102 respondents from Yogyakarta) and their distribution percentages, respectively. As pandemic condition, collecting data uses online survey in September and October 2020. From the tables, several important information can be obtained regarding participants.
Table 2. Characteristic of demographic
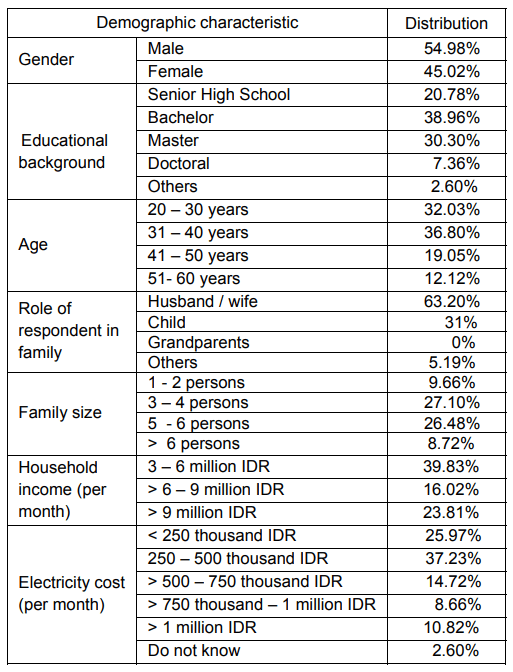
Table 3. Building and IEH characteristics
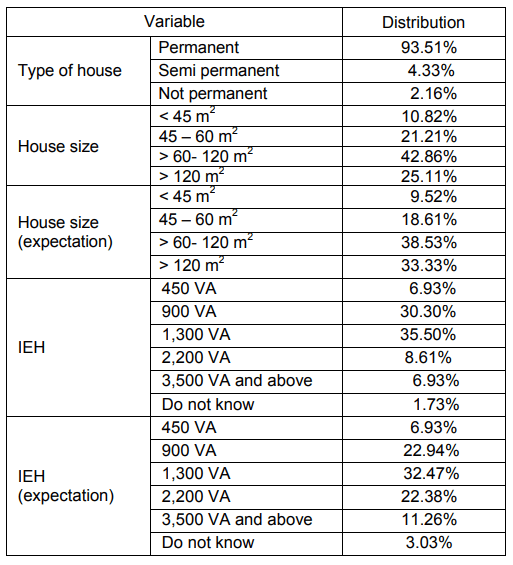
For example in Table 2, respondents are dominated by male (54.98%) with background of educations are majority bachelor degree (38.96%). Most of respondents have age between 31 to 40 years (36.80%) and with role in family is dominantly husband or wife (63.20%) as head of the related houses. Concerning family size, dominant has 3 to 4 persons in one home (27.10%) which is common in Indonesia. For income, majority respondents have monthly income between 3 to 6 million IDR, and followed by income above 9 million IDR, and above 6 to 9 million IDR. In terms of electricity bill to support their activities at homes, majority respondents spend electricity energy cost around 250 to 500 thousand IDR per month (37.23%). Out of 231 respondents, some of them (2.60%) do not pay attention to their electricity cost in one month. Concerning building and IEH characteristics as in Table 3, majority respondents has permanent house (93.15%). The respondents live at homes with majority size above 60 m2 to 120 m2 . However, they expected have larger houses in the future as seen in the table. For IEH, dominant respondents have 1,300 VA (35.50%). Similar to house size, they generally expected have higher IEH in their houses.
Energy efficient appliances and occupants’ behaviors
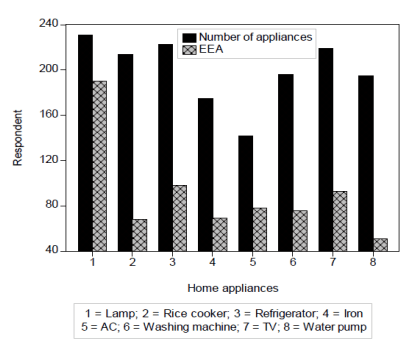
The usage of EEA at home (usage behavior) and practising energy saving lifestyle (habitual behavior) can affect consumption. Following this, a number of questions related to this aspect are also included during survey. For electric appliances, results shown majority respondents have been used many kinds of appliances. The variation of ownership is plotted in Figure 2. Particularly for EEA, its usage level is clearly still low as indicated by only ownership for lighting lamp is above 50%, namely 82.25% from 231 participants. Other two highest EEA after lighting lamp that has been using by occupants are refrigerator (43.95% from 223 respondents who have refrigerator) and TV (42.47% from 219 respondents who have television).
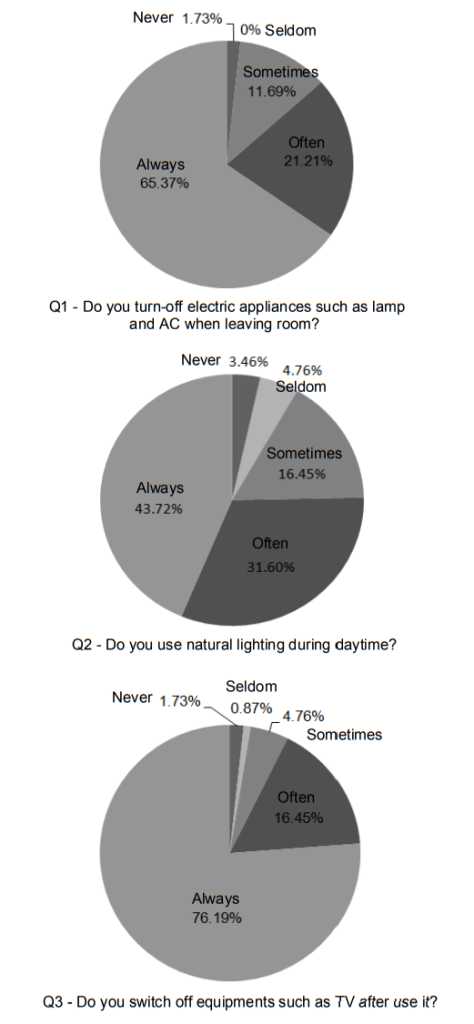
Next, Figure 3 shows some habitual behaviors of occupants in using electricity at home. From the figure, around 65.37% of them turn off related appliances when leaving room. Majority respondent use natural lighting during daytime (43.72%), and has habit to switch off equipments such as TV after use it (76.19%). Basically, observed occupants have been practicing specific energy saving actions in their daily life. In some studies [23, 24] behaviors of occupants are affected by perception. Based on this, two kinds of perceptions namely for usage behavior (PL1) and habitual behavior towards electricity saving (PL2)) are calculated by using mean score analysis. From analysis, level for both perceptions is a little bit different in value. Value for PL1 is 3.99 of 5 Likert scale, meanwhile 4.15 for PL2. Although both of occupants’ perceptions can be categorized quite good, the different values may affect implementation level for each type of behavior in relation to reduce energy usage. However, general energy awareness of occupants can be not matched with their practices [25].
General barriers in reducing of electricity consumption
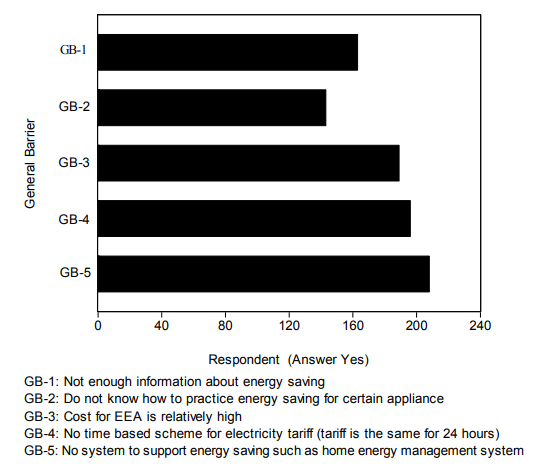
To investigate further aspects that may influence efficiency of energy use, some questions about barriers which possibly faced by consumers to support reduction electricity consumption are also asked and the results are graphically presented in Figure 4. Results shown majority of respondents have obstacles in five points as in the questions. However, it is found that GB-5 is the most obstacle (90.04 %) and followed by GB-4 (84.85%), GB-3 (81.82), GB-1 (70.56%) and GB-2 (61.9%). Based on this, it is needed to give more information and education related energy saving in many aspects to people in the best way. As in [6], providing appropriate information or education program is a key to reduce household electricity consumption. This can be done such as via television, social media, and radio. Besides that, non-flat electricity tariff scheme including energy management supporting system should be initiated by power utility and then introduced to general public. To initiate energy management system, more information including knowing existing household demand profile is needed [14]. Addressing the obstacles can contribute in enhancing efficiency of energy use.
Predictors of electricity consumption
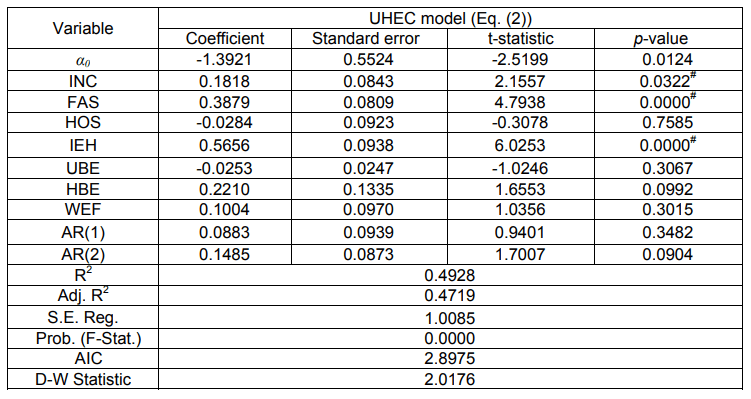
Table 4 shows regression results for the best UHEC model which is structured by autoregressive orde-2. Determining better model among options is based on the obtained smallest AIC value and the largest of adj. R2 value. The UHEC model is statistically well validated with adj. R2 value is 0.4719 which means involved variables can explain 47.19% of consumption variation. As seen in the table, Fstatistic value is 0. This shows at least one of predictors in the model influenced volume of electricity consumption. Next, the Durbin-Watson (D-W) statistic value around two confirmed that autocorrelation does not exist in the model. To measure degree of multi-collinearity between predictor variables, variance inflation factor (VIF) is used. Obtained VIF values for all variables which less than common threshold value namely 10 indicating no multi-collinearity problem in the composed model [26]. Corrected standard error regression is applied to dealing with heteroskedasticity. By applying 5% significance level, some variables have significance in the model namely income (INC), family size (FAS), and installed electricity at home (IEH) as shown by their probability (p) values below 0.05. Meanwhile, other variables are not significant. For significance variables, IEH has highest effect to consumption and followed by family size and then income as shown by their regression coefficients which is highest for installed electricity variable (0.5656). All regression coefficients have positive sign. This indicated the three variables influence consumption in positive direction. The higher value of the three variables (IEH, FAS, and INC), the higher volume of consumption.
Related to IEH, household consumers in Indonesia are classified into three groups. Group R1 for consumers with IEH below 2,200 VA, R2 for consumers 3,500 to 5,500 VA, and group R3 is for above 6,000 VA. Among the groups, majority consumer comes from Group R1 and this suitable with obtained data from survey. As IEH is found affect consumption, electricity demand will increase in the future as some consumers from this side have expectation to increase IEH at their homes mainly to 2,200 VA and above. Naturally when owned IEH capacity is high, it makes people tends to use more electricity energy. No traceable study which quantify the effect of IEH on household consumption.
For family size, in [27,28] reported that average household size for provinces which the both observed cities are located is 3.85 persons for year 2019 and this is reflected by obtained data during survey. Each person has electricity energy needs per time [29]. Therefore, more of family member may lead to increasing of consumption at home. Obtained significance influence for this variable to electricity consumption is in line with some studies such as in [30,31]. For income, number of home appliances may change when income increase. Therefore, commonly seen around us, families with high income have more appliances. This is behind the significance effect this variable to volume of consumption in the studied cities.
Table 4. Coefficients and statistics regression of model
Conclusions and future work
This research aims to investigate a number of aspects to manage electricity consumption for urban household in Indonesia by using statistical approach. From analysis, It can be concluded that majority occupants have been practicing specific energy saving actions although the usage level of energy efficiency appliances (EEA) at their homes is still low. Some main barriers to support occupants further in reducing consumption include higher cost to buy EEA and the absence of non-flat electricity tariff scheme including support system for energy management. Next, income, family size, and installed electricity at home (IEA) are found as key predictors for electricity consumption where the IEA has the highest impact. The presented electricity information give more insight in designing more realistic strategy to promote energy saving program for users or to propose wise ways in managing energy usage for household sector in Indonesia. To get comprehensive results, future research will use more variables and apply structural equation modelling to observe the complex relationship between them.
Acknowledgments: This research is supported by Hasanuddin University under Penelitian Dasar Unhas (PDU) 2020 grant scheme. The authors thank to people who assisted during data collection.
REFERENCES
[1] Hirst E., Berry L., Soderstrom J., Review of Utility Home Energy Audit Programs, Energy, 6(1981), No. 7, 621–630.
[2] Sorrell S., Reducing Energy Demand: A Review of Issues, Challenges and Approaches, Renewable and Sustainable Energy Reviews, 47(2015), 74-82.
[3] Jareemit D., Limmeechokchai B., Impact of Homeownwer’s Behaviours on Residential Energy Consumption in Bangkok, Thailand, Journal of Building Engineering, 21(2019), 328-335.
[4] Papageorgiou G., Efstathiades A., Poullou M., Ness A.N., Managing Household Electricity Consumption: A Correlational, Regression Analysis. International Journal of Sustainable Energy, 39(2020), No. 5, 486-496.
[5] Yan D., O’Brien W., Hong T., Feng X., Gunay H.B., Tahmasebi F., Mahdavi A., Occupant Behavior Modeling for Building Performance Simulation: Current State and Future Challenges, Energy and Buildings, 15(2015), 264-278.
[6] Yohanis Y.G., Domestic Energy Use and Householders’ Energy Behavior, Energy Policy, 41(2012), 654-665.
[7] Akil Y.S., Miyauchi H., Seasonal Peak Characteristic Comparison Analysis by Hourly Electricity Demand Model, International Journal of Energy and Power Engineering, 3(2014), No. 3, 132-138.
[8] Hu S., Yan D., Guo S., Cui Y., Dong B., A Survey on Energy Consumption and Energy Usage Behavior of Households and Residential Building in Urban China, Energy and Buildings, 148(2017), 368–379.
[9] Ponniran A., Mamat N.A., Joret A., Electricity Profile Study for Domestic and Commercial Sectors, International Journal of Integrated Engineering, 4(2012), No. 3, 8-12.
[10] Huebner G., Shipworth V., Hamilton I., Chalabi Z., Oreszczyn T., Understanding Electricity Consumption: A Comparative Contribution of Building Factors, Socio-Demographics, Appliances, Behaviours and Attitudes, Applied Energy, 177(2016), 692-702.
[11] Sanquist T.F., Orr H., Shui B., Bittner A.C., Lifestyle Factors in U.S. Residential Electricity Consumption, Energy Policy, 42(2012), 354-364.
[12] Jones R.V., Lomas K. J., Determinants of High Electrical Energy Demand in UK Homes: Appliance Ownership and Use, Energy and Building, 117(2016), 71-82.
[13] Yoshida A., Manomivibool P., Tasaki T., Unroj P., Qualitative Study on Electricity Consumption of Urban and Rural Households in Chiang Rai, Thailand, with a Focus on Ownership and Use of Air Conditioners, Sustainability, 12(2020), 1-19.
[14] Elma O., Selamoğullar U.S., A Survey of a Residential Load Profile for Demand Side Management Systems, Proc. of the 5th IEEE International Conference on Smart Energy Grid Engineering, 2017, 85-89.
[15] Wijaya M.E., Tezuka T., A Comparative Study of Households’ Electricity Consumption Characteristics in Indonesia: A Techno-Socioeconomic Analysis. Energy for Sustainable Development, 17(2013), 596-604.
[16] Batih H., Sorapipatana C., Characteristics of Urban Households’ Electrical Energy Consumption in Indonesia and its Saving Potentials, Renewable and Sustainable Energy Reviews, 57(2016), 1160-1173. [17] Indonesian Ministry of Energy and Mineral Resources, Electricity Statistics Year 2018. http://alpha.djk.esdm.go.id/index.php/statistik-ketenagalistrikan. Accessed 28 September 2020.
[18] Ministry of Energy and Mineral Resources, Republic of Indonesia Government Regulation No. 70 Year 2009 about Energy Conservation, https://migas.esdm.go.id/uploads/regulasi/profil_peraturan_284.pdf, accessed 29 November 2020.
[19] Guo Z., Zhou K., Zhang C., Lu X., Chen W., Yang S., Residential Electricity Consumption Behavior: Influencing Factors, Related Theories and Intervention Strategies, Renewable and Sustainable Energy Reviews, 81(2018), 399-412.
[20] Bland J.M., Altman D.G., Cronbach’s Alpha, BMJ, 314(1997), 572.
[21] Pardo A., Meneu V., Valor E., Temperature and Seasonality Influences on Spanish Electricity Load, Energy Economics, 24(2002), 55-70.
[22] Mirasgedis S., Sarafidis Y., Georgopoulou E., Lalas D.P., Moschovits M., Karagiannis F., Papakonstantinou D., Models for Mid-Term Electricity Demand Forecasting Incorporating Weather Influences, Energy, 31(2006), 208-227.
[23] Park N.K., Lee E., Energy-Efficient Lighting: Consumers’ Perceptions and Behaviours, International Journal of Marketing Studies, 5(2013), No. 3, 26-35.
[24] Akil Y.S., Mangngenre S., Mawar S., Amar K., Preliminary Study of Perception and Consumer Behaviour Towards Energy Saving for Household Appliances: A Case of Makassar, Journal of Physics: Conference Series 979 012091(2018), 1-6.
[25] Lutzenhiser L., Social and Behavioral Aspects of Energy Use, Annual Review of Energy and the Environment, 18(1993), 247–289.
[26] O’Brien R.M., A Caution Regarding Rules of Thumb for Variance Inflation Factors, A Caution Regarding Rules of Thumb for Variance Inflation Factors, Quality & Quantity, 41(2007), 673-690.
[27] Statistics (BPS), Sulawesi Selatan Province in Figures: Delivering Data to Inform Development Planning 2020.
[28] Statistics (BPS), Daerah Istimewa Yogyakarta Province in Figures, 2020.
[29] Shiraki H., Nakamura S., Ashina S., Honjo K., Estimating the Hourly Electricity Profile of Japanese Households – Coupling of Engineering and Statistical Methods, Energy, 14(2016), 478-491.
[30] Yalcintas M., Kaya A., Roles of Income, Price and Household Size on Residential Electricity Consumption: Comparison of Hawaii with Similar Climate Zone States, Energy Reports, 3(2017), 109-118.
[31] Shibano K., Mogi G.. Electricity Consumption Forecast Model Using Household Income: Case Study in Tanzania, Energies, 13(2020), 1-14.
Authors: Yusri Syam Akil, Ph.D., Department of Electrical Engineering, University of Hasanuddin, Gowa Campus – 92171, Indonesia, E-mail: yusakil@unhas.ac.id; Dr. Eng. Wardi, Department of Electrical Engineering, University of Hasanuddin, Gowa Campus – 92171, Indonesia, E-mail: wardi@unhas.ac.id; Zaenab Muslimin, M.T., Department of Electrical Engineering, University of Hasanuddin, Gowa Campus – 92171, Indonesia, Email: zaenab@unhas.ac.id; Kifayah Amar, Ph,D., Department of Industrial Engineering, University of Hasanuddin, Gowa Campus – 92171, Indonesia, E-mail: kifayah.amar@unhas.ac.id.
Source & Publisher Item Identifier: PRZEGLĄD ELEKTROTECHNICZNY, ISSN 0033-2097, R. 97 NR 5/2021. doi:10.15199/48.2021.05.06
