Published by Zbigniew ŁUKASIK, Jacek KOZYRA, Aldona KUŚMIŃSKA-FIJAŁKOWSKA,
Uniwersytet Technologiczno-Humanistyczny w Radomiu, Wydział Transportu i Elektrotechniki
Abstract. The main goal of this article was to present the problem of discontinuity of energy supply and methods applied by selected distribution company in order to improve power supply reliability indexes. An analysis of discontinuity of supply was based on data obtained from selected department of a distribution company with six energy areas. Based on these data, the impact of the investments, repairs, random events and other factors on the value of power supply reliability indexes was presented.
Streszczenie. Głównym celem publikacji jest przedstawienie problemu nieciągłości dostarczania energii elektrycznej oraz metod stosowanych przez wybraną spółkę dystrybucyjną w celu poprawy wskaźników niezawodności zasilania. Analizę nieciągłości zasilania zawartą w pracy oparto o dane pozyskane z wybranego oddziału spółki dystrybucyjnej (OSD), na terenie którego działa sześć rejonów energetycznych. Na podstawie danych przedstawiono wpływ inwestycji, remontów, zdarzeń losowych oraz innych czynników na wartość wskaźników niezawodności zasilania. (Analiza wskaźników niezawodności zasilnia w wybranej spółce dystrybucyjnej).
Słowa kluczowe: Spółka dystrybucyjna, System elektroenergetyczny, SAIDI, SAIFI.
Keywords: Distribution company, Power system, SAIDI, SAIFI.
Introduction
Power cut is defined as the state when energy is not available for a consumer in a place defined in an agreement. While supervising continuity of energy supplies and describing them using indexes, it is important to determine exact time of occurring power cut [1-5]. There are some minor but significant differences in defining and classifying power cuts [6-8]. In practice, there are two definitions of power cut. Although the effect of power cut is the same in most cases, the definition resulting from both definitions is important. The first definition uses the value of voltage at a place of connecting the consumer to the network. If the value of voltage is zero or close to zero, such state is defined as power cut. The practical implementation of this definition requires monitoring of voltage in all places of connecting the consumers. Collecting so many data using available technologies requires large financial outlays and that’s why it is economically unjustified.
The second definition is based on the notion of galvanic connection between the main part of electrical power system and consumer. If there is no galvanic connection between the consumer and main part of network, such state is called power cut. This definition does not directly match the feelings of a consumer, but its application for the purposes of collection of data about continuity of energy supplies is much easier for a network operator. Opening the connector that causes power cut often happens automatically and it is not always registered at low voltage. Manual closing of a connector is often a basis for statistics of continuity of energy supplies. At the highest levels of voltage, the systems of data collection and SCADA are usually applied to register power cuts.
The actions taken to improve power supply reliability indexes in the distribution networks
In the power industry, the key element improving power supply reliability indexes is increasing financial outlays for modernization and replacement of electrical power equipment, exploited lines and devices. Financial expenditures on replacement modernization and increasing resistance of low-voltage and medium-voltage network on atmospheric phenomena constituted in the years 2014 – 2017 nearly 40% of all expenditures of the operators of the distribution company system on the investments [17,18]. In many cases, the expenditures on the investments and renovation works in the distribution enterprises on particular elements of an electricity grid did not meet the needs. To ensure proper technical state and improve power supply reliability indexes, constant modernization and successive replacement of particular elements of distribution networks are required [9-14]. For this purpose, the actions in three key elements of distribution networks are taken:
Medium-voltage lines
– The replacement of bare conductors with insulated ones,
– The construction of medium-voltage and low-voltage double voltage lines on one supporting structure,
– The replacement of overhead medium-voltage string lines with cable lines,
– The application of high-quality fittings – poles, insulators, fixing wires,
– Tree cutting for medium-voltage lines,
– The automation of medium-voltage network,
– Installing short-circuit current flow indicators,
– The systems of automatic supply restoration of medium-voltage network – Fault Detection, Isolation and Restoration (FDIR).
Low- and medium-voltage transformer stations
– The application of modern solutions of simplified and small-sized stations,
– The application of integrated digital security systems,
– The use of switches with vacuum insulation or SF6.
Low-voltage lines
– The replacement of low-voltage overhead lines with insulated lines,
– The works on the line in technology of live working,
– The replacement of poles and insulators.
Another action taken to improve power supply reliability indexes in the distribution companies is also monitoring of electricity grid [15,16]. The programs such as SCADA WindEx are used. System provides data reading on the synoptic model and computer screen. The simulation environments are also applied to determine reliability rates of distribution network cooperating closely with SCADA systems such as WindEx AWAR. Program of monitoring vehicles, FLOTA has been applied and it is an additional tool for a dispatcher to get to a place of failure faster.
An analysis of SAIDI in selected energy areas of the distribution company
In the discussed department of distribution company, there are six energy areas of different territorial structure and various distribution of the consumers in the rural and urban areas. The indexes obtained from two energy areas contained in G-10,5 and G-10,4 reports were analysed. Compared areas were marked in this article with the symbols „R-A and R-D”. The analysis includes the period between 2015 and 2017. Table 1 shows data about zones served by the compared areas, number of medium-voltage/ low-voltage stations, networks with a division into rural and urban areas and number of supplied consumers.
Planned SAIDIs show the time of disconnections of networks and electrical power equipment necessary for performance of operating, investment and renovation works. In general, in the years 2015-2017, times of disconnections of electrical power networks in order to perform operating works, investment and renovation works were short in the R-A area. This result was related to the length of the networks in a specific area and existing connection systems that allowed to reserve supply system and operation during disconnection of shorter segments of a network. The urban areas, due to their architecture have many cable networks both medium- and low-voltage, which causes that time required to do operating works is shorter than time needed to do the same scope works on the overhead networks.
Table 1. Basic data about surface, number of medium-voltage/low-voltage stations and number of the consumers in the compared areas

Planned SAIDI presents intensity of works for the whole year. In 2015-2016, the works were intensified mostly in June-March and October–December. The works in the months mentioned above were intensified in both areas. In 2017, monthly distribution of performed works changed, that is, the period from the beginning of the year was extended to May, and the period of intensification began in September. The summer periods were characterized by low number of works. It was caused mainly by holiday season.
Table 2. Planned SAIDIs in the years 2015 – 2017 in the R-A and R-D areas

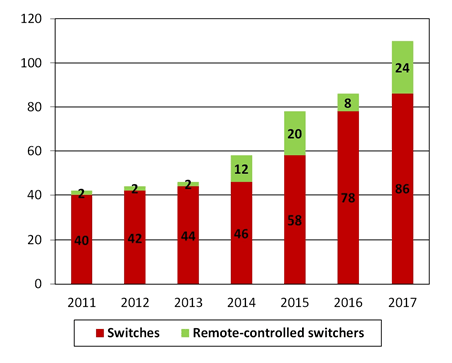
The average value of planned SAIDI in the examined period was over three times higher for R-D area. It results from shorter overhead lines and large number of the consumers served by the R-A area. Similar number of modernization works and network checkups was performed faster. In addition, the value of SAIDI is inversely proportional to number of the consumers in a given line or area. In the years 2015 – 2017, new remote-controlled connectors were installed in both discussed areas. Performed works increased planned SAIDI, but modernizations had positive impact on duration of emergency disconnections in subsequent years. The number of installed remote-controlled connectors in the R-A and R-D area in the years 2011 – 2017 was presented on Fig.2 and Fig.3.
Data on the figures show clear relations between the values of planned SAIDIs and number of performed modernization works. The renovations of medium-voltage lines related to installing remote-controlled connectors caused the growth of planned SAIDI in the R-A area in 2017 and in the R-D area in 2015 and 2017.
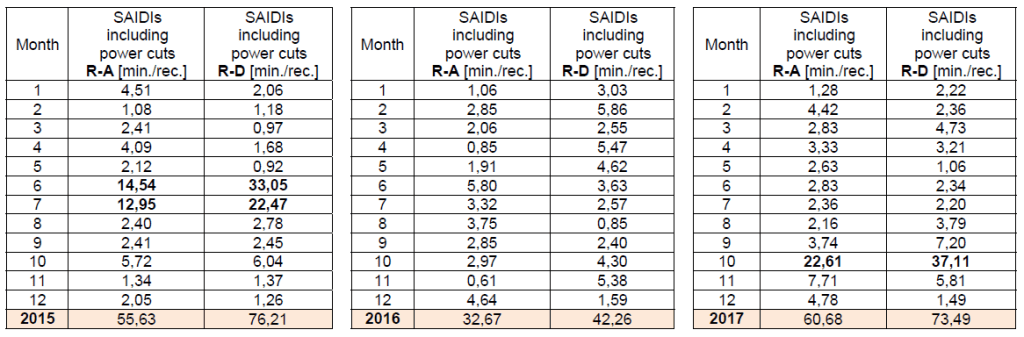
Table 3. Unplanned SAIDIs excluding catastrophic power cuts in the years 2015 – 2017 in the R-A and R-D areas


Unplanned SAIDIs excluding catastrophic power cuts
Unplanned SAIDI without catastrophic power cuts characterizes technical state of power lines and devices because it reflects failures in the system of distribution of electricity. In 2015, there are higher values of the index in July and August. The impact on total time of unplanned disconnections in this period had violent storms with gusty wind that occurred in the discussed energy areas. Most of the failures occurred in the R-D area. It confirms relation that important in the interference states are both size (length) of a network and type of medium-voltage and low-voltage distribution network, that is, overhead or cable one and zone serviced by a given area. Larger number of failures in the medium-voltage networks occurred also in the urban areas in the R-A area. In October 2017, the failures of high intensity occurred in the R-D area. Long disconnections counted in hours were caused by hurricane Ksawery. Times of disconnections increased both in medium- and low-voltage lines. R-D area was much more exposed to disconnections caused by strong wind. This area has, above all, medium-voltage overhead lines with long strings and vast low-voltage lines often running through forested areas. Lower number of the consumers served by R-D has negative impact on the value of unplanned SAIDI.
Fig.4 shows rapid growth of unplanned SAIDI for R-D area in June and July. The average value for June and July was 24,44, the average value for remaining months was only 2.37. The graph also shows partial resistance of the lines of R-D area (largely cabled both on the medium-voltage and low-voltage side) to the damages as a result of storms (atmospheric discharges) and strong wind. Fig.5 shows unplanned SAIDI of discussed areas in 2017.
The value of SAIDI for 2017 increased hurricane Ksawery in October. In the R-D area, as a result of failure of medium-voltage and low-voltage overhead lines in the vast area (3415 km2), nearly two times larger than the R-A area, SAIDI increased six times in comparison with average value for remaining months of 2017. Similar indexes in the months with good weather in the years 2015 – 2017 show that discussed energy areas are exposed to similar atmospheric conditions in the same months.


Unplanned SAIDIs including catastrophic power cuts
SAIDI, including catastrophic power cuts, that is, cuts lasting longer than 24 hours, provides full information not only about technical state of power lines, the degree of their automation, but also about problems with removing some failures. The cause of catastrophic disconnections is mainly violent atmospheric phenomenon in the vast area. Repairing the damages of supporting structures of medium-voltage and low-voltage lines requires a lot of time. It is often related to involvement of additional human resources (teams of repairmen not working for the department of distribution company) and additional mechanical equipment. The energy consumers from long medium-voltage strings running through forested areas may be affected by catastrophic disconnections. Additional factor that prevents repairing of a failure within 24 hours is difficult (which is often impossible for a few or dozen or so hours) access to a place of a failure. The storms with atmospheric discharges and gusty wind in the summer and abundant snowfall, blizzards and snowstorms make roads impassable. It should be taken into consideration that access to many sections of power lines is only through local and municipal roads.
The energy areas for the analysis were selected not only due to their location, but also due to number of energy consumers and energy infrastructure typical of rural and urban areas. The values of SAIDIs, including catastrophic power cuts for the years 2015 – 2017 in the discussed areas were presented in table 4.
The catastrophic power cuts occur sporadically. In the discussed energy areas, there were only three months with catastrophic power cuts in the years 2015 – 2017. The disconnections lasting longer than 24 hours were caused by extraordinary atmospheric phenomena. In 2015, such phenomena occurred in June and July, and in October in 2017. The catastrophic power cuts affected only consumers supplied by low-voltage lines. All medium-voltage lines damaged in the discussed period were repaired within 24 hours.
Table 4. SAIDIs, including catastrophic power cuts in the years 2015 – 2017 in the R-A and R-D areas
As a result of damages to low-voltage lines and broken lines, small number of the consumers on the rural areas was not supplied. In the years 2011 – 2013, in the case of compared energy areas, the number of disconnectors was increasing very slowly, by 0 to 2 pieces a year. There were no extraordinary atmospheric phenomena during these years. Unplanned SAIDIs, excluding and including catastrophic power cuts remained at constant low level. There were no catastrophic power cuts in the R-A area in 2012 and in the R-D area in 2011. 2014 was the first year of intensified works on the automation of medium-voltage lines. 20 new remote-controlled connectors were installed in the R-A area, and 12 new connectors in the R-D area. The modernization of medium-voltage network and good weather brought reduction of SAIDI in both discussed areas by about 10%. Figures 6 and 7 show the impact of installed remote-controlled connectors on the medium-voltage lines on the value of unplanned SAIDI in the discussed areas.

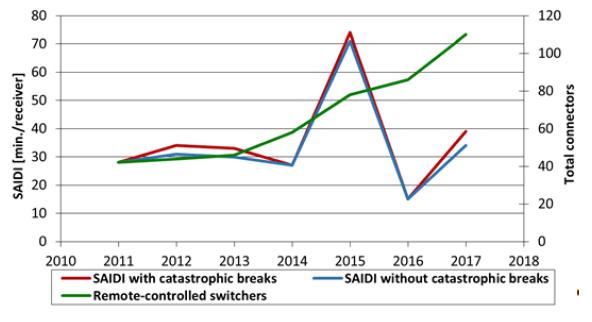
In 2015 and 2017, the value of unplanned SAIDI in both energy areas increased considerably. Despite installing new remote-controlled connectors (in the years 2015-2017, 104 new connectors were installed in the R-A area and 52 in the R-D area) unplanned SAIDI in 2015 and 2017 considerably increased in both areas. After failure-free period in the years 2011- 2014, as a result of the disconnections in the summer period in 2015, SAIDI increased by over 100%. Shortening the time of emergency disconnections isundoubtedly connected with the automation of medium-voltage lines. It is confirmed by the analysis of data from 2016. Unplanned SAIDI decreased then by 14% in comparison with the years 2011 – 2014. The year 2017 was also exceptional due to the effects of hurricane Ksawery. Unplanned SAIDI increased in both areas, but its values were lower than in 2015. The modernization of electricity grids, particularly the option of remote controlling of medium-voltage lines lets to locate failure faster.
An analysis of SAIFI in selected energy areas of the distribution company
Planned SAIFI
SAIFI defines average frequency of occurrence of long and very long power cuts. It takes into account the number of the consumers that can be affected by power cuts within a year divided by total number of all served consumers. The unit of measure of SAIFI is a number of disconnections / consumer. Planned SAIFI refers to the number of power cuts resulting from execution of a program of operating works on the electricity grid. The duration of power cut is calculated from the moment of opening a connector to resuming of energy supply.
Table 5. Planned SAIFI in the years 2015 – 2017 in the R-A and R-D areas

In the discussed energy areas, there were lower values of planned SAIFI for R-A area. At R-D area, this index is a few times higher. The number of planned power cuts depends on the type and configuration of electricity grid. The way of performing connection and operating works has impact on the number of power cuts, for example, performing live works, change of supply system for the purposes of reserving supply and number of workers performing the works mentioned above.
In the summer period, that is, in the period of increased number of holidays, the number of planned power cuts decreases considerably due to lower number of operating works on the networks and electrical power equipment. The operators of Distribution System try to limit the number of planned disconnections through performing as many works as possible during one disconnection.

SAIFIs of discussed energy areas show the state of electricity grid. Their values are connected with the number of the consumers. Because both areas differ significantly in the number of the consumers (the difference is almost 55 thousand), the values of discussed index are different. Performing many works at the same time during one disconnection is easier in the urban areas due to short time of journey to work and the option of reserving supply. R-D area supplying mostly rural areas through medium-voltage radial lines performs operating and modernization works by higher number of disconnections. Planned SAIFI for R-D area is higher in the discussed period than in the R-A area by 0,9. The direct impact on this value has large area and long medium- and low-voltage lines. It considerably affects the value of planned SAIDI, which is shown in table 5 and fig.8.
Unplanned SAIFI excluding catastrophic power cuts
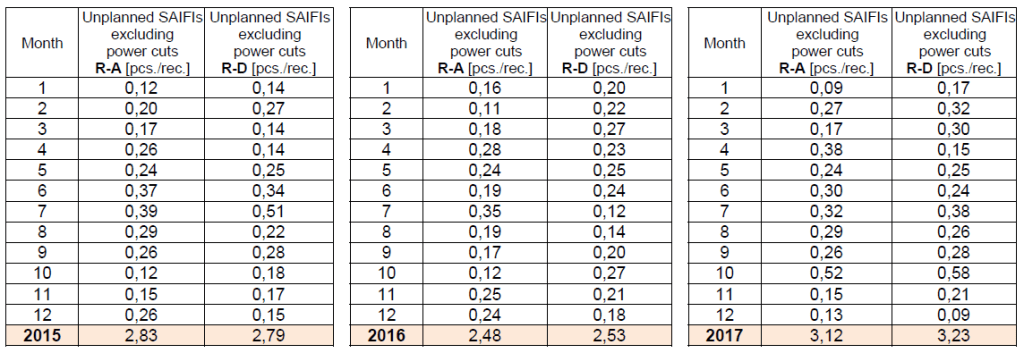
Data used in this article show that type of a distribution network considerably affect the value of SAIFI. The value of SAIFI is connected with the value of SAIDI. In the R-D energy area, this index is higher in comparison with R-A area. The highest values of SAIFI were recorded in 2015 in: June and July in both areas, but with different results. The highest value, 0,51 is an effect of disconnections in July caused by gusty wind in the R-D area. In 2017, the highest value of SAIFI was recorded in October: 0,52 in the R-A area, 0,58 in the R-D area. R-A area working in most part of electricity grid in the system of cable lines is less susceptible to the impact of atmospheric phenomena such as strong wind, rainfall, snowfall, atmospheric discharges.

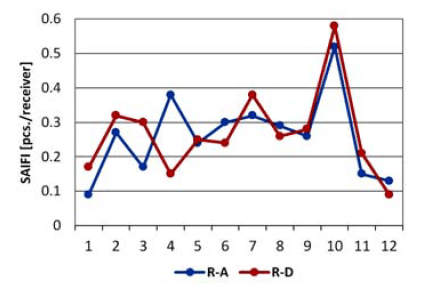
The growth of SAIFI in the summer of 2015 was a result of storms with gusty wind. The highest value was noticed in July of 2015 for R-D area. The values of unplanned SAIFI excluding catastrophic power cuts for discussed energy areas are presented in table 6 and fig. 9 and 10.
Table 6. The value of unplanned SAIFI excluding catastrophic power cuts in the R-A and R-D areas in the years 2015 – 2017
Unplanned SAIFIs excluding catastrophic power cuts
The comparison of SAIFIs, excluding and including catastrophic power cuts shows the occurrence of disconnections lasting longer than 24 hours only in three months in 2015 – 2017. The catastrophic power cuts occurred in June and July 2015 and October 2017. The cause of such long disconnections was atmospheric phenomena and storms in 2015 and hurricane Ksawery w 2017. The catastrophic power cuts had more impact on SAIFI of the R-D area. Similarly to discussed SAIDI, the cause is the character of a network of R-D energy area. In table 7 and fig. 10, the values of unplanned SAIFI, including catastrophic power cuts for discussed energy areas in the years 2015 – 2017 were presented.
Taking into account catastrophic power cuts, SAIFI for R-A area increased by 7%, for R-D area by almost 10%. Presented data show that SAIFI depends less on automation of medium-voltage network. The number of disconnections converted into the number of supplied consumers decreases to a lower degree than time necessary for location of a damage and its repairing. SAIFI is sensitive to technical state of a line, particularly to disconnections caused by improper tree cutting in the forested areas and disconnections caused by state of power lines due to their age. The graph shows the growth of SAIDI in the R-D energy area in 2017, after including catastrophic power cuts. The power cuts lasting longer than 24 hours occurred only for a few days of October and increased annual index by almost 10%.
Table 7. The value of unplanned SAIFI, including catastrophic power cuts in the R-A and R-D areas in the years 2015 – 2017

Conclusions
This article is analysis of the issues of ensuring continuity of energy supplies to the consumers supplied from medium- and low-voltage lines. Limiting by the Energy Regulatory Office permissible values of indexes of power cuts forces operators of distribution systems (department of distribution company) to take actions aimed at decreasing the duration and number of these power cuts. Based on data obtained from selected department of the distribution company, the authors presented the method applied by the company in order to reduce failure frequency of medium-voltage and low-voltage lines and limit the number of planned disconnections necessary for performing operating and modernization works. The actions aimed at ensuring continuity of power supply were presented with a division into the works related to low-voltage lines, medium-voltage/ low-voltage transformer stations and works on the medium-voltage lines.
This article shows huge involvement of discussed department in modernization of medium-voltage lines. Emergency disconnections of a medium-voltage strings deprives of power supply between a few and several dozen thousand consumers at the same time. After 2014, the works are mainly focused on the automation of medium-voltage lines through installing remote-controlled connectors. The automation of medium-voltage lines reduced the time of unplanned disconnections. The impact of the number of installed radio-controlled connectors on reduction of SAIDI was described in the article. Many medium-voltage strings operating in the analysed area have already been equipped with appropriate number of remote controlled connectors. Installing more devices of such type would be economically unjustified. The recent solution that has been implemented since 2015 is the system of full automation of medium-voltage lines. FDIR system self-locate a damage, sections a damaged part of medium-voltage line and automatic supply and connection of undamaged parts. In the discussed area, FDIR has been installed on one 15kV line. The huge challenge for discussed department will be replacement of 30% of medium-voltage lines on the cable lines.
The analysis conducted with the use of data obtained from two energy areas showed huge impact of atmospheric phenomena on the power cuts. Two areas differing in surface, type of medium-voltage and low-voltage lines and length of networks were selected for the analysis. It allowed to show differences in the impact of bad atmospheric phenomena on the state of electricity grid. The companies operating mainly in the urban areas, having relatively short, mostly medium-voltage and low-voltage distribution cable lines and large number of the consumers are less exposed to decreasing of SAIDI and SAIFI as a result of failure of a network. Nevertheless, conducted analysis showed that extraordinary atmospheric phenomena (stormy summer in 2015 and hurricane Ksawery in 2017 were analysed) have large impact on deterioration of continuity of power supply. The values of indexes of power cuts in 2015 and 2017 show that efforts put into maintenance and modernization of the networks may be eliminated by atmospheric phenomena occurring within a few weeks, and sometimes a few days a year.
The plans of further reduction of permissible values of SAIDIs announced by the chairman of URE for the years 2016 – 2020, impose new obligations on the operators of the distribution systems. Many actions that improved the continuity of power supply were taken. Modern solutions such as FDIR automation require multimillion investments. The replacement of at least 30% of medium-voltage lines into cable ones and automation of networks seem to be the only path to meet demands of URE.
REFERENCES
[1] Bargiel J., Goc W., Sowa P., Teichman B.: Niezawodność zasilania odbiorców z sieci średniego napięcia, Rynek Energii 4/2010
[2] Parol M.: Analiza poziomu niezawodności zasilania odbiorców w elektroenergetycznych sieciach dystrybucyjnych, Przegląd Elektrotechniczny, 93 (2017) n.3, pp.1–6
[3] Kornatka M.: Automatyzacja pracy sieci średniego napięcia a poziom ich niezawodności, Przegląd Elektrotechniczny, 90 (2014), n.8, pp.109–112
[4] Kornatka M.: Distribution of SAIDI and SAIFI indices and the saturation of the MV network with remotely controlled switches, (2017) IEEE18th International Scientific Conference on Electric Power Engineering (EPE), pp.1-4
[5] Woźny K., Putynkowski G., Balawender P., Kozyra J., Łukasik Z., Kuśmińska-Fijałkowska A., Ciesielka E.: A New Model for the Regulation of Distribution System Operators with Quality Elements that Includes the SAIDI/SAIFI/CRP/CPD Indices, Electrical Power Quality and Utilisation Journal, Vol. XIX, Issue 1, April 2016, pp.1-7
[6] Łukasik Z., Kozyra J., Kuśmińska-Fijałkowska A.: Monitoring of low voltage grids with the use of SAIDI indexes, Przegląd Elektrotechniczny, 93 (2017), n.10, pp.146–150
[7] Łukasik Z., Kuśmińska-Fijałkowska A., Kozyra J.: Application of energy-efficient systems in a processing line, Przegląd Elektrotechniczny, 94 (2018), n.12, pp. 95-99
[8] Al-Muhaini M., Heydt G.: A Novel Method for Evaluating Future Power Distribution System Reliability,(2013) IEEE Transactions on Power Systems, Vol. 28, no. 3, pp. 3018 – 3027
[9] Kubacki S., Mazierski M.: Poprawa SAIDI i SAIFI cztery kroki ku niezawodności, Energia Elektryczna, 5/2013
[10] Janiszewski P., Sawicki J., Kupras J. Mróz M.: Praktyczne sposoby poprawy wskaźników niezawodności zasilania SAIDI i SAIFI w sieci SN, Acta Energetica, 1/34 (2018), pp. 45–50
[11] Schroedel O., Schwan S., Koeppe S., Rosenberger R.: Distribution automation solutions impact on system availability in distribution networks, (2011) 21st International Conference on Electricity Distribution Frankfurt, paper no 1117, pp.1-4
[12] Gonzalez M. Improvement of SAIDI and SAIFI reliability indices using a shunt circuit-breaker in ungrounded MV networks, (2013) IET 22nd International Conference and Exhibition on Electricity Distribution (CIRED 2013),pp 1-4
[13] Moskwa Sz., Koziel S., Siłuszyk M., Galias Z.: Multiobjective Optimization for Switch Allocation in Radial Power Distribution Grids (2018) IEEE International Conference on Signals and Electronic Systems (ICSES), pp. 157 -160
[14] Bersano R., Rovick P., Tarife R., Pacis M.: Modified Optimal Reliability Indices Calculation for Radial Distribution System, (2018) IEEE 10th International Conference on Humanoid, Nanotechnology, Information Technology, Communication and Control, Environment and Management (HNICEM), pp.1-5
[15] Pierre B., Arguello B.: Investment Optimization to Improve Power Distribution System Reliability Metrics, (2018) IEEE Power & Energy Society General Meeting (PESGM), pp. 1-5
[16] Dehghan S., Amjady N., Conejo A., Reliability-constrained robust power system expansion planning, (2016) IEEE Transactions on Power Systems, vol. 31, no. 3, pp. 2383-2392
[17] Sieci energetyczne pięciu największych operatorów [online] http://www.cire.pl
[18] Raporty [online] http://www.pgedystrybucja.pl
Autorzy: prof. dr hab. inż. Zbignew Łukasik, Uniwersytet Technologiczno-Humanistyczny, Wydział. Transportu i Elektrotechniki, ul. Malczewskiego 29, 26-600 Radom, E-mail: z.lukasik@uthrad.pl; dr inż. Jacek Kozyra, Uniwersytet Technologiczno-Humanistyczny, Wydział Transportu i Elektrotechniki, ul. Malczewskiego 29, 26-600 Radom, E-mail:. j.kozyra@uthrad.pl. dr hab. inż. Aldona Kuśmińska-Fijałkowska, prof. nadzw. UTH Rad., Uniwersytet Technologiczno- Humanistyczny, Wydział Transportu i Elektrotechniki, ul. Malczewskiego 29, 26-600 Radom, E-mail:. a.kusmińska@uthrad.pl;
Source & Publisher Item Identifier: PRZEGLĄD ELEKTROTECHNICZNY, ISSN 0033-2097, R. 96 NR 4/2020. doi:10.15199/48.2020.04.28
