Published by Tambi TAMBI1,2, Salama MANJANG1, Syafaruddin SYAFARUDDIN1, Ikhlas KITTA1, Hasanuddin University (1), Halu Oleo University (2)
Abstract. The article presents a method of monitoring the performance of real-time high voltage insulators on the effects of natural aging from the influence of tropical climate phenomena based on leakage currents. The monitoring system used Remote-Control Unit Systems (RCUs) made using dSPACE-based simulator tools that were designed based on real conditions in the field. The processing module can classify and store peak leakage rates and also provide a monitoring signal output for direct observation of waveforms. The data stored in the form of a data logger can be sent via a wireless communication radio telemetry network or through a GPRS network in real-time, which is controlled by a graphical user interface software (GUI) of its own. The result displays information regarding the condition of the insulator as a reference for the maintenance of electrical energy transmission and distribution lines.
Streszczenie. Zaprezentowano metodę monitorowania w czasie rzeczywistym zmian izolacji wysokonapięciowej w wyniku starzenia w klimacie tropikalnym. Metoda bazuje na pomiarze prądu upływu. Wyniki monitorowania mogą być przesyłane przewodowo lub z wykorzystaniem sieci GPRS. Monitorowanie w czasie rzeczywistym izolacji wn w klimacie tropikalnym
Keyword: real-time monitoring, the effect of natural aging, leakage current, tropical climate phenomena
Słowa kluczowe: izolacja wn, pomiar izolacji, pomiar w czasie rzeczywistym
Introduction
Indonesia is a tropical country with relatively high humidity (generally above 90%), heavy rainfall with an average of 227 mm, annual rainy days of around 144 days, and annual temperatures above 18 °C (can reach 38 °C in the dry season) [1]. The monitoring of polluted insulators is located in the Makassar area in transmission and distribution lines, experiencing a rainy season from November to April and a dry season from May to October. The season changes in the tropics certainly have different characteristics and behaviors that affect outdoor isolator efficiency. Climate conditions, pollution, and exposure to electric fields cause degradation and insulator aging [2]. When an aging process occurs, water-resistant properties are reduced to form a layer of contaminants on the insulator surface. The pollutant layer causes the insulator to be conductive [3]. The conductive design initiates dry-band emergence so that leakage current can pass through the insulator surface, resulting in a phenomenon called dryband arcing [4]. This trend leads to lower age of insulator use [2] and [5].
Leakage current measurements are used to monitor the performance of insulators who have experienced aging due to exposure to tropical climates, lightning surges, and flashovers after a prolonged dry season transition to the rainy season. The monitoring is carried out to minimize system disruption caused by pollutants that are still attached to the insulator when the beginning of the rainy season. When the rainfall intensity is still lacking, which begins with drizzle, the heavy pollutants attached to the insulator have not been washed clean. According to [6], the isolator profile influences the accumulation of pollutants, which determines the pollution performance, and the control of leakage currents by the design of the insulator is highly dependent on the type of pollutant. Besides, by knowing the value of the leakage current of the insulator, which tends to lead to flashover, preventive maintenance can be scheduled when the critical level of the leakage current of the isolator is reached so that a total flashover can be anticipated to minimize system outages.
The assessment of insulator leakage currents is not a new problem for electricity company personnel. The Federal de Electricidad Commission (Mexican Electric Research Institute) has 44 leakage current monitoring systems installed on several transmission lines [7]. The monitoring system has given a much broader perspective on the performance of outdoor insulators for various pollution zones, and the magnitude of the critical leakage current for various insulator profiles has been determined based on laboratory tests [8].
Insulator performance assessment is not always based on its profile (insulator type and material). As mentioned in [6], insulators with lower leakage currents do not always have the best operating performance but are largely determined by the accumulation of pollutant types and pollution severity and climate conditions, as well as work voltage. When the extent of pollution is known, the method will probably be chosen with high accuracy to determine the insulation strength and the insulator profile needed in the tropics. Therefore, for each pollution environment, the level of emissions is very much determined by climate, so this paper was written to study the performance of high voltage insulators in tropical climates.
Research on leakage currents has been carried out for both non-composite (Non-HTM) and composite insulator (HTM). However, the implementation is still limited, especially in Indonesia. The effects of tropical climate and high levels of pollution must continue to be examined to study the performance of high voltage insulators.
This paper presents the effect of natural aging on the performance of outdoor high voltage insulators with various types and insulation materials to evaluate the performance of the contamination in tropical climate regions under electric pressure in polluted conditions. This study aimed to determine the effect of tropical climate phenomena based on monitoring leakage currents on aging insulators after exposure to pollutants in tropical climate due to prolonged drought. The effects of ESDD, humidity, temperature, and rainfall in real-time were also observed. The experimental method was carried out by placing a remote-control unit system (RCUs) monitoring device on a 20 kV primary distribution line outdoors for recording breakdown voltage, surface leakage current, temperature, humidity, UV, and rainfall outside the High Voltage Engineering Laboratory building in Makassar, Indonesia. Then the measurements were carried out on polymer and ceramic insulators of different types, which were monitored for 40 weeks.
Performance Of High Voltage Insulator
High voltage isolators in its service will experience aging and degradation due to exposure to environmental stresses, including sunlight, UV radiation, oxidation, electrical pressure, temperature, and humidity during the entire operating period [9]. Then research on the performance of high voltage insulators has also been carried out, including those reported in the paper [1, 6].
To measure the weight of pollutants attached to the surface of the insulator, then the measurement of pollution weights is needed. Based on IEC 60815 (2008), the thickness of the contaminant layer on the surface of the insulator is determined by the Equivalent Salt Deposit Density (ESDD), in mg / cm2. The presentation of ESDD values affects the level of salinity obtained. If the ESDD method is used in natural pollution, then by definition, ESDD is the amount of sodium chloride (NaCl) deposited on the surface of the insulator, which will produce the same conductivity in natural pollution.
The conductivity meter is used to measure each salt solution from a sample of naturally polluted insulators. Then, the conductivity of the washing solution is calculated. At the same time, the temperature is also as explained in [10, 11]. The conductivity at different temperatures is converted to 20°C as shown in equation (1),

α20 is the standard conductivity at 20°C (µS/cm); αθ is the conductivity at θ °C (µS/cm); θ is the solution’s temperature, °C; and b is the temperature correction factor, θ,°C (b is a factor depending on temperature) as given in Table 1.
Table 1. Values of b at different temperatures [11, 13]

After the conductivity at 20°C is obtained, the salt concentration, D (mg / cm3) can be calculated using the following equation (2),

Then, the ESDD is calculated using the following equation

where: ESDD is the equivalent salt deposit density (mg/cm2); V is the volume of washing water (ml); D2 is the equivalent salt concentration of water before washing (mg/cm3); D1 is the equivalent salt concentration of water after washing (mg/cm3); S is the surface area of the washed insulator (cm2). As explained in [12, 13], if the conductivity value α20 is in the range of 44×10-3 to 4×10⁻¹ S/m, then to calculate the concentration of salt Sa (salt salinity), equation (4) can be used so that equation (2) can be written as the following.
Then, based on equation (4), the ESDD can be calculated using equation (5).

ܵSa is the salt salinity (gr/cm3); V is the volume of the washing water (ml); A is the surface area of the polluted insulator (cm2).
Aging outdoor isolators in tropical countries certainly have a pattern and process of degradation that is slightly different from areas that are not tropical. According to [9], [14] and [15], environmental aging pressures, such as humidity, temperature variations, and ultraviolet radiation, as well as conductor electrical and mechanical stresses, affect the performance of polymer insulators by affecting the insulator’s surface conditions, where the polymer material loses its hydrophobicity to some extent after exposure. Likewise, the signs of intensive dry tape release were also found in the porcelain insulators tested. However, its role in insulator performance is unclear, and more studies are needed to explain it [16].
Outdoor isolators are important to be monitored to find out the condition of the insulator after exposure to environmental pollution. Insulator leakage current values have not been defined and cannot be fixed rigorously by any standard organization because the leakage current limits are set according to the reliability of the operation and not safety. The leakage current limit is determined by the local electricity company, although this limit also varies between countries. In Indonesia, for example, the National Electricity Company (PLN) determines the maximum limit of insulation resistance from the material is 1 mA/volt. For each transmission line, the limits are defined regarding the type and profile of the insulator used, dimensions, operating voltage, and pollution level. In theory, the current is directly proportional to the operating voltage and directly proportional to the surface resistance of the insulator, so that the influence of pollutants due to exposure to tropical climate causes the surface of the insulator to be more conductive when humidity is high.
Appointments, monitoring, measurement, and assessment methods for estimating leakage currents from contaminated outdoor isolators have been carried out. Among them in paper [17], namely the effects of operating voltage, ESDD, and humidity on polluted leakage current based on the least-squares algorithm (LSA), monitoring of leakage current of composite insulators by [18], LC prediction from environmental data using linear and nonlinear regression [19], as well as monitoring and measurement of leakage currents due to the influence of environmental climate have been carried out, including studies reported in [20, 21, 22, 23]. Outdoor insulation leakage currents that flow due to the effects of tropical climate and aging insulators still have to be continuously assessed on the performance of high voltage insulators The research approach refers to IEC 60815 [11, 24], IEC 60060 [25], and CIGRE WR [26]. Measurement of the leakage current in the wet tropics for the performance of different type insulators is performed after a long drought where the rainy season is beginning with the drizzle in the next step so that contaminants that remain on the insulator ‘s surface in summer are not cleaned. When this phase begins, the high voltage network operators need to have information regarding the condition of the insulator in real-time maintenance so that there would be an effective preventive effort to minimize system outage interruptions.
Test insulator samples used were ceramic insulators and polymer insulators. Ceramic insulators consisted of ANSI 52-5 suspension insulators and ANSI 57-3, line-post insulators, while polymer insulators consisted of suspension and line-post polymers insulators. Insulators used as test samples were used aging insulators from the State Electricity Company. The test insulator was chosen as a sample to represent aged high-voltage network outdoor insulators due to environmental pollution, flashovers, and lightning surges. Specifications of each insulator as a base sample mounted on the test tower arm are shown in Table 2 [25].
Table 2. Basic parameter of test insulators

Notes: H is the installed height of the insulator; L is the leakage distance; D is the rated diameter of insulators; the composite insulator has an alternative diameter
The development of hardware and software was carried out to facilitate real-time data retrieval based on the time domain in the tropics. Various models and types of aging insulators were used as test sites and monitored on a real-time basis. Experimental arrangements for this case study are shown in Figure 1.
Distribution lines construction was designed based on medium and high voltage construction standards SPLN D3.027-2, SNI IEC 60502-1: 2009, and the standard for distribution line design overhead [27]. Single line diagram as shown in Figure 1(a) consists of a 50 kVA transformer of 0.4/20 kV voltage, Lightning Arrester (LA), Fuse Cut Out (FCO), pole, cross arm, various type insulators, NA2XSY 3×70 mm2 cables, AAACS 3 wire × (1×70) mm2, and ground.
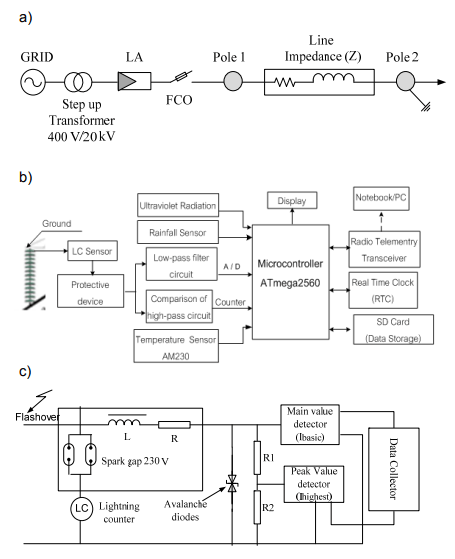
The designed monitoring system then installed at several monitoring points in the form of remote-control unit systems (RCUs). Then, the flow data and environmental data were stored on the data collection server in the form of a data logger using the ATmega2560 microcontroller to control the system and process the data obtained. The RCUs was equipped with a real-time clock (RTC), ADC converter, temperature sensor, leakage current sensor, rainfall sensor, humidity sensor, and ultraviolet radiations sensor [28]. The overall diagram is shown in Figure 1(b). The protection against over-voltage due to flashover, switching, and lightning surges, protective equipment (protective device) is shown in Figure 1(c).
Test samples of insulators that have been aging due to pollution, flashover, or lightning surges were directly mounted on a pole on the cross arm during the testing period. However, the insulator was first measured by its ESDD and its insulation resistance from aging insulating materials. Furthermore, the insulators were installed in the high voltage lines designed for testing in May 2018 and then monitored while in service. Monitoring began in June 2019 until March 2020 to observe the characteristics of leakage currents in real-time.
Then the Equivalent Salt Deposit Density (ESDD) of the insulators was calculated in mg/cm2 while its conductivity was measured using equations (1), (3), and (5) to analyze the effects of pollution levels on leakage currents. The measurement method was based on IEC 60815 recommendations. ESDD measurements and conductivity of aging insulators samples installed on the system were measured in real-time along with the measurement of leakage currents when it rains. Whereas, the insulation resistance value of the test sample material was measured every day in offline conditions regarding IEC 60343 [29].
A withstand test was done to measure leakage current. The leakage current test was carried out regarding the high voltage test standard issued by IEC 60060. This test was carried out to measure the amount of leakage current passing through the insulator ‘s surface at its rated voltage under tropical climate influence, as shown in Figure 2.

The real-time monitoring and aging insulators identification system in this study was developed using the real-time method with dSPACE-based simulator tools using C++ and Visual Basic programs that were designed based on real conditions in the field. The processing module could classify and store peak leakage rates and also provide a monitoring signal output for direct observation of waveforms. In addition to detecting, grouping, and storing, it was also programmed with analog to digital (A/D) inputs to half-hourly record leakage current signals generated from sensors placed in the outdoor environment. The data stored in the form of a data logger could be sent via a wireless communication radio telemetry network or a GPRS network in a real-time controlled by a graphical user interface (GUI) software that was made to display information regarding the insulator’s condition. Leakage current monitoring was carried out for 40 weeks or 298 days from June 2019 to March 2020.
Results and Discussion
Tropical climate data were analyzed from statistical data obtained from real-time monitoring results using regression to determine the parameters that most influence the value of leakage currents in aging insulators. Also, conductivity measurements to determine ESDD were analyzed, which is one of the environmental pollution factors that affect the leakage current in the insulator. The measurement results are shown in Table 3.
After installation, real-time measurements in the field were carried out with a monitoring tool designed using sensors to detect tropical climate parameters, including temperature, humidity, ultraviolet radiation, and rainfall. The data was stored in the form of a data logger and the leakage current data controlled and monitored in real-time by a microcontroller. Relevant tropical environmental data are given in table 4. As can be seen in Table 4, summer ended in mid-November, then low rainfall/drizzle began. In the rainy season, high rainfall occurred from December to February. Data for each month showed a maximum relative humidity of 95 %.
Table 3. The average value ESDD measurement, insulation resistance, and conductivity.

Table 4. Tropical climate data

Monitoring began on June 26, 2019, until April 16, 2020, (290-day period). Table 4 shows data during monitoring using daily tropical climate data. Daily data was accumulated in each month by displaying the maximum, minimum, and average temperature and humidity (RH percent) values, while only the maximum ultraviolet-B (mW/cm2) value is shown. Rainfall is shown in the unit of mm/hour.
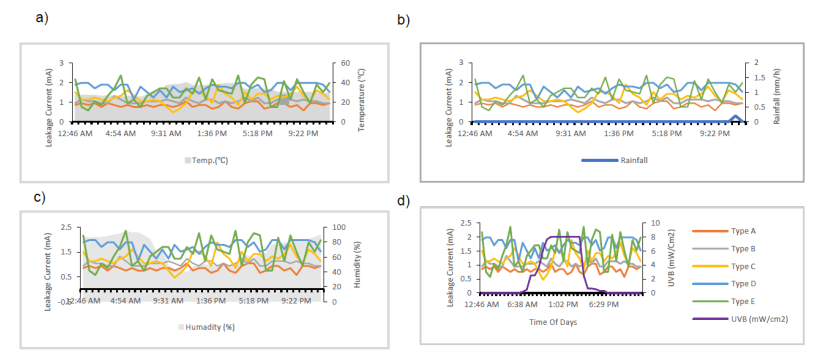
Data on leakage current of insulators from the results of initial monitoring over 150 days on tropical climate shows that there was no significant increase in current. Figure 3 is a representation of the highest leakage current data during this period (June to October). The results show that the highest leakage current in type E insulators occurred at night with 95% RH humidity at 4:54 AM at 2.36 mA and 2.34 mA during the day at 3:56 PM at 38 Ԩ. Similarly, other types of insulators, especially polymer insulators (types A and B), appeared to be stable to the local climate. However, they could not be used as a reference because the dry season was still ongoing at this time. At this stage, it was possible to observe that leakage currents are strongly related to humidity in porcelain insulators, whereas polymers tend to be stable. Similarly, the effect of temperature, rainfall, and ultraviolet radiation on the insulating leakage current at this stage was not significant.
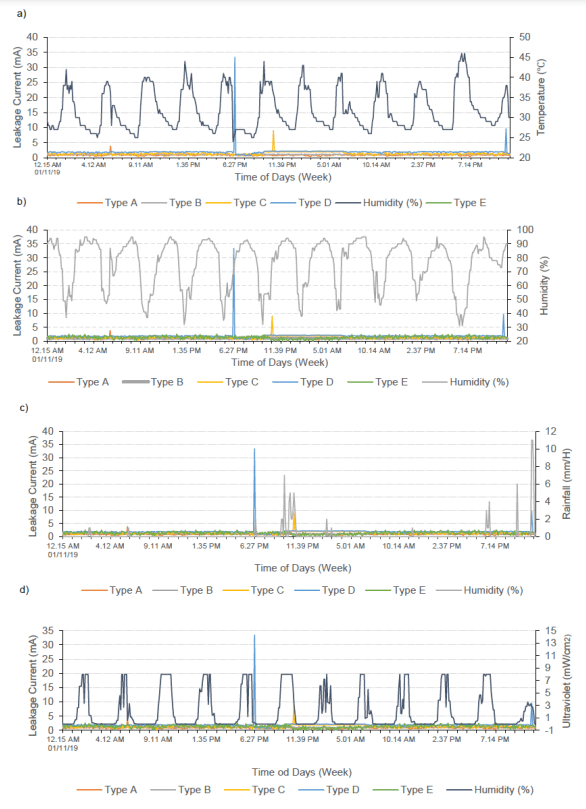
However, in the next five-month monitoring period (November 2019 to March 2020), an increase in the surface of the leakage current occurred, especially in early November. On November 5, 2019, at 5:51 PM, an increase of 33.4 A in leakage current occurred in type D (blue) porcelain suspension-type insulator, then the current was stable. Likewise, type C insulators also had increased leakage current, but it was insignificant while other insulators tended to be stable. Rainfall that occurs will wet the surface of the insulator while cleaning pollutants that stick naturally. The intensity of rain strongly influences insulating leakage currents, but high rainfall does not always affect the increasing leakage currents. It also depends on the type of pollutants attached, as described previously. It is also consistent with what is shown in Figure 4, where on November 12, 2019, at 3:19 PM, there was high rainfall (11 mm/h), but the leakage current that passed through the insulator surface was only 9.62 mA. It was different from the 2 mm/h rainfall that occurred on November 5, 2019.
Data collected from RCUs installed in the field enabled all parameters such as leakage currents, humidity, temperature, rainfall, and ultraviolet light to be displayed in a graph during monitoring. Note that temperatures fluctuated from 26°C during the night and approximately 44°C during the day.
On the other hand, leakage currents increased quite sharply when humidity reached 95% in the afternoon with a temperature of 26°C and ultraviolet was zero due to light rain.
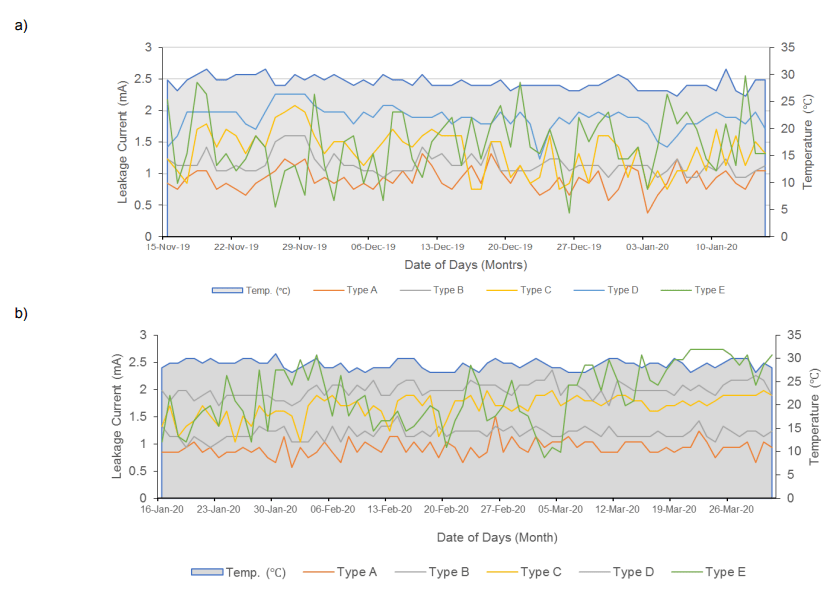
Other information obtained from daily leakage currents monitoring during the period of November 15, 2019–March 31, 2020, is shown in Figure 5. During this period, type E insulators (green) experienced an increase in leakage currents at the beginning of monitoring, from 2.36 mA to 2.74 mA. Meanwhile, the leakage currents in insulator type D (blue), type C (yellow), type B (grey), and type A increased from 1.98 mA to 2.17 mA, 1.89 mA to 2.08 mA, 1.23 mA to 1.70 mA, and 1.04 mA to 1.51 mA, respectively.
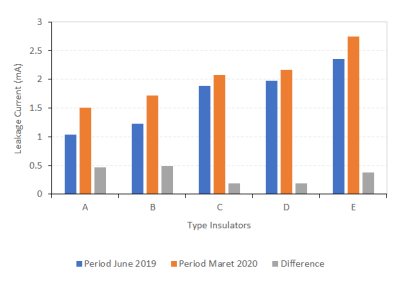
The measured leakage current value of the insulator tended to increase from the first month of monitoring to March 2020, as shown in Figure 6. In this period, monitoring was based on the average distribution of leakage currents measured in real-time without the climatic phenomena described previously.
Conclusion
Leakage current measurement in various types of aging high-voltage insulator provides a broader perspective on monitoring the performance of outdoor insulators in tropical climates. Insulator condition was based on the limit of leakage current affected by the climate conditions, which could lead to flashover. The results of the ten-month monitoring period show that the leakage current was increasing. The increased leakage current is one factor used to assess the performance of the insulator. The maximum leakage current was selected from each part of the data using the assumption of the maximum leakage current indicates the performance of a high-voltage insulator. Therefore, it is essential to monitor the condition of high-voltage insulators installed in transmission and distribution lines to observe the effect of a tropical climate. The monitoring results can be used to determine the optimal time to intervene, which is a preventive action from the electricity company to maintain the continuity of the distribution of electrical energy to consumers, such as washing insulators. Also, the value of the insulator’s leakage current, which tends to lead to flashover, can be used to schedule preventive maintenance when a critical level of current is reached on the polluted insulators so that a total flashover can be anticipated to minimize system outages.
Acknowledgments Thank you to the National Electricity Company (PLN) for consulting and providing test materials, and also thanks to Hasanuddin University for other research assistance.
REFERENCES
[1] Ibnu Sofian, Scientific basis: Analysis and projection sea level rise and extreme weather event report, ICCSR (2010).
[2] S. Manjang and M. Nagao., Characteristics of high voltage polymer insulator under accelerated artificial tropical climate multi stress aging, Proceedings of International Symposium on Electrical Insulation Materials, Kyoto, Japan, pp. 221–224 (2011).
[3] L. H. Meyer and W. W. Beyer, Salt Fog Testing of Glass Insulators with Different Surface Conditions, pp. 4–7, 2013. [4] A. Khaled, A. El-Hag, and K. Assaleh, Equivalent salt deposit density prediction of outdoor polymer insulators during salt fog test, Annu. Rep. – Conf. Electr. Insul. Dielectr. Phenomena, CEIDP, vol. 2016-Decem, pp. 786–789, 2016.
[5] M. Yalagach et al., Influence of environmental factors like temperature and humidity on MEMS packaging materials., 2018 7th Electron. Syst. Technol. Conf. ESTC 2018 – Proc., pp. 1–6, 2018. [6] Ramirez, I., Hernandez, R., and Montoya, G., Measurement of leakage current for monitoring the performance of outdoor insulators in polluted environments, IEEE Electrical Insulation Magazine, vol. 28, no. 4, pp. 29–34, (2012)
[7]. G. T. Montoya, I. V. Ramirez, and R. Hernandez, The leakage current as a diagnostic tool for outdoor insulation, 2008 IEEE/PES Transm. Distrib. Conf. Expo. Lat. Am. T D-LA, Bogota, Colombia (2008).
[8] B. X. Du, Y. Liu, H. J. Liu, and Y. J. Yang, Recurrent plot analysis of leakage current for monitoring outdoor insulator performance, IEEE Trans. Dielectr. Electr. Insul., vol. 16, no. 1, pp. 139–146 (2009).
[9] C. Chen, Z. Jia, W. Ye, Z. Guan, and Y. Li, Thermo-oxidative aging analysis of HTV silicone rubber used for outdoor insulation, IEEE Trans. Dielectr. Electr. Insul., vol. 24, no. 3, pp. 1761–1772 (2017). [10] IEC 60507, Artificial Pollution Tests on High-Voltage Insulators to be Used on A. C. Systems, (2013).
[11] IEC60815-1, Selection and dimensioning of high-voltage insulators intended for use in polluted conditions – Part 1: Definitions, information and general principles, Int.Electrotech. Comm., pp. 1–2 (2018). [12] I. G. C.S. Engelbrecht and I., Outdoor insulation in polluted conditions: Guidlines for selection and dimensioning, no. June, (2008).
[13] A. Jaya, H. Berahim, T. Tumiran, and R. Rochmadi, The performance of high voltage insulator based on epoxypolysiloxane and rice husk ash compound in tropical climate area, Electr. Electron. Eng., vol. 2, no. 4, pp. 208–216 (2012).
[14] A. K. Jonscher and A. Isnins, Trans-Universal Dielectric Response – Electrical Insulation and Dielectric Phenomena, IEEE 1996 Annual Report of the Conference, October, pp. 0–3 (1996).
[15] M. Wakhidin and A. Samples, Study on Leakage Current Characteristics and Electrical Equivalent Circuit Properties of Aged Polymer Insulator under Artificial Environmental Condition, Conf. Power Eng. Renew. Energy, pp. 1–6 (2018). [16] M. A. R. M. Fernando and S. M. Gubanski, Performance of nonceramic insulators under tropical field conditions, IEEE Trans. Power Deliv., vol. 15, no. 1, pp. 355–360 (2000).
[17] Y. Xia, X. Jiang, C. Sun, and B. Dong, A method to estimate leakage current of polluted insulators, Prz.Elektrotechniczny, vol. 88, no. 3 B, pp. 161–164 (2012).
[18] M. Amin, S. Amin, and M. Ali, Monitoring of leakage current for composite insulators and electrical device, vol. 21 (2009).
[19] L. Zhao, J. Jianwu, S. Duan, K. Wang et al. The prediction of post insulators leakage current from environmental data, IEEE, International Conference on Electrical and Control Engineering, vol. 2, pp. 5103-5106, Yichang, China, (2011)
[20]M. M. Werneck, Danial M., Fabio V.B., et al., Detection and monitoring of leakage currents in distribution line insulators, Conf. Rec. – IEEE Instrum. Meas. Technol. Conf., Montevideo, Uruguay, pp. 468–472, (2014).
[21] J. Zhou, Y. Mao, T. Cheng, and H. Zhao, Research on Routing Algorithm for On-line Monitoring of Leakage Current of Insulators, 2017 IEEE 2nd Advanced Information Technology, Electronic and Automation Control Conference (IAEAC), Chongqing, China pp. 1822–1826, (2017).
[22] M. M. Werneck, D. M. Dos Santos, C. C. De Carvalho, F. V. B. De Nazaré, and R. C. D. S. B. All, Detection and Monitoring of Leakage Currents in Power Transmission Insulators, IEEE Sens. J., vol. 15, no. 3, pp. 1338–1346 (2015).
[23] T. Zuo, T. Liu, K. Chen, and X. Hu, On-line monitoring system of insulator leakage current based on ARM, IEEE Int. Conf. Ind. Informatics, Beijing, China, pp. 75–79 (2012).
[24] Guide for the selection and dimensioning of High-Voltage insulators for polluted conditions, document IEC60815, 2008.
[25] Guide for High-Voltage test techniques, document, IEC60060, Iec2020, vol. 2006, p. 13 (2020).
[26] CIGRE WG D1-14, Material Properties for Non-Ceramic Outdoor Insulation, August, pp. 1–75 (2004).
[27] E. Ergon, Standard for Distribution Line Design Overhead, no. 8802 (2016).
[28) Tambi, Salama Manjang, Syafaruddin, Ikhlas Kitta., Development of Real-Time Monitoring and Identification System of Aging Insulators in the Tropics, in 2019 2nd International Conference on High Voltage Engineering and Power Systems (ICHVEPS), Denpasar, Bali, Indonesia, pp. 213-217 (2020).
[29] Guide for the Recommended test methods for determining the relative resistance of insulating materials to breakdown by surface discharges, document, IEC60343, vol. 50, no. 541, (2004).
Authors: Tambi, lecturer in the Electrical Engineering Department of Halu Oleo University, a doctoral student in the electrical engineering Department of Hasanuddi University, Makassar, Indonesia, E-mail: gallatambi@gmail.com; Salama Manjang, Head of Electrical Engineering Department Hasanuddin University, Email:salamamanjang@gmail.com; Safaruddin, Head Of Electrical Engineering Study Program Magister, Hasanuddin University, Makassar, Indonesia, E-mail: syafaruddin@unhas.ac, id; Ikhlas Kitta, Lecture of electrical engineering, Hasanuddin University, Makassar, Indonesia, E-mail:ikhlaskitta@gmail.com.
Source & Publisher Item Identifier: PRZEGLĄD ELEKTROTECHNICZNY, ISSN 0033-2097, R. 96 NR 10/2020. doi:10.15199/48.2020.10.24
