Published by Andrzej LANGE1, Marian PASKO2
University of Warmia and Mazury, Department of Electrical and Power Engineering, Electronics and Automation (1), Silesian University of Technology, Institute of Electrical Engineering and Computer Science (2)
Abstract. This paper presents the results of a five-year study of a 1 MW photovoltaic power station in the Warmia and Mazury Province. The research involved measurements of active energy, currents, voltages, active, reactive and apparent power and higher harmonics of currents and voltages. The operation of this plant was analysed in terms of electricity produced and active power generated to the power grid in individual years, months and days. The analysis concerning the impact of the plant on the power grid in terms of the quality of electricity supplied included the results of three-day measurements of not only active, reactive and apparent power, but also of higher harmonics of currents generated to power grids on the low-voltage side, the results of which were recorded every second.
Streszczenie. W artykule przedstawiono wyniki pięcioletnich badań elektrowni fotowoltaicznej o mocy 1 MW z województwa warmińskomazurskiego. W czasie badań zmierzono energię czynną, prądy, napięcia, moce czynne, bierne i pozorne oraz wyższe harmoniczne prądów I napięć. Dokonano analizy pracy tej elektrowni pod względem produkowanej energii elektrycznej oraz mocy czynnej generowanej do sieci elektroenergetycznej w poszczególnych latach, miesiącach i dniach. Do analizy oddziaływania elektrowni na sieć elektroenergetyczną pod względem jakości dostarczanej energii elektrycznej przedstawiono wyniki trzydniowych pomiarów nie tylko mocy czynnej, biernej i pozornej, ale również wyższych harmonicznych prądów generowanych do sieci elektroenergetycznych po stronie niskiego napięcia, których wyniki rejestrowane były co 1 sekundę. (Wybrane aspekty pracy elektrowni fotowoltaicznej w systemie elektroenergetycznym).
Keywords: electrical power quality, higher harmonics of voltages and currents, active and reactive power, photovoltaic power plant.
Słowa kluczowe: parametry jakości energii elektrycznej, wyższe harmoniczne napięć i prądów, moc czynna i bierna, elektrownia fotowoltaiczna
Introduction
Depleting conventional energy resources such as hard coal, lignite, oil, natural gas and radioactive elements, as well as the effects of pollutions emitted from these sources, force mankind to use renewable sources of electricity. Renewable energy sources include: hydropower, solar power [1], wind power, geothermal energy, sea currents, tidal and wave energy, biofuel, biomass, biogas and ocean thermal energy. The recent Act on Renewable Energy Sources [2] has stopped the construction of new wind and water power plants. Consequently, the production from photovoltaic (PV) panels has remained for electricity generation using renewable energy sources [3, 4]. Power stations based on photovoltaic panels do not provide a fixed and rigid source of electricity, since the value of energy generated depends on solar radiation, which in our climatic conditions is not constant and is subject to dynamic changes [5, 6].
Characteristics of a photovoltaic power station
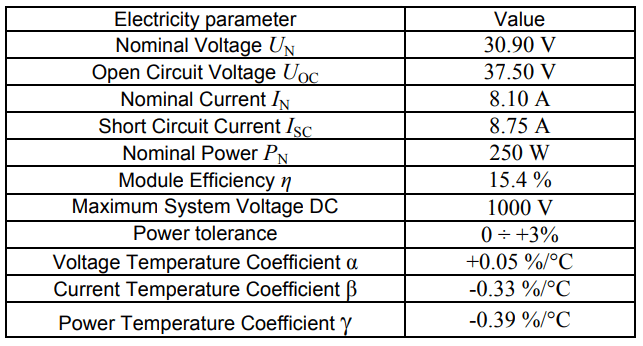
To describe the effect of the photovoltaic power station on the quality of electricity and its effectiveness, a 1 MW power station located in the Warmia and Mazury Province was selected. The power station is connected to the MV power grid by a 3×XRUHAKXS 120/50 mm2 cable line. The power station area featured a MV/LV container station with a SN = 1000 kVA transformer and MV and LV switchboards. 2×YAKY 3×240+120 mm2 cables from the LV switchboard connect six AC switchboards to which 46 three-phase SYMO 20.0-3-M inverters with rated power PN = 20 kW are connected. The inverter data are presented in Table 1. Each of the 43 inverters was connected to 88 monocrystalline photovoltaic panels, PN = 250 W, the parameters of which are presented in Table 2. Three inverters were connected to 72 monocrystalline photovoltaic panels. Panels were installed at the 30° angle. The total number of panels was 4000 and the total power installed in PV panels was 1000 kW. The rated power of a PV panel is specified in Standard Test Conditions (STC) i.e. at the sunlight intensity of 1000 W/m2 , 1.5 G AM spectrum and cell temperature of 25°C. Connecting 88 PV panels to the 20 kW inverter results in 22 kW in the PV panels, therefore each inverter is overloaded by 10%. The total power of the installed inverters is 920 kW.
Table 1. Basic data of a SYMO 20.0-3-M inverter

Table 2. Basic data of a SFE.MF-6-250 PV panel
Measurement results
The measurements were performed from the moment the power station was commissioned in May 2015 to the end of 2019. The analysis included measurement results for currents, voltages, electricity, active, reactive and apparent power, and higher harmonics of currents and voltages on the MV and LV sides of the transformer.
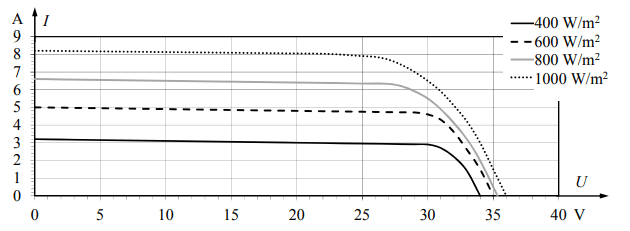
As results from the PV panel data, the power of the panel and its voltage increases along with a decrease in temperature (Fig. 1 and Fig. 2). This is of crucial importance on colder days of the power plant operations, when sunlight intensity is lower. At that time, the higher power of the panel resulting from lower temperature partially compensates for the lower intensity of solar radiation. However, the current generated by the PV panel decreases with a decrease in temperature (Fig. 3). The value of radiation intensity has a significant effect on the value of the current generated by a PV panel (Fig. 4). The lower the radiation intensity, the lower the current generated by the photovoltaic panel. The same applies to the power generated by the panel (Fig. 5). This is of crucial importance for determining the rated power of the power station. The Energy Law Act [7], the Act on Renewable Energy Sources [2, 8] and the Construction Law Act [9] do not explicitly define the rated power of a photovoltaic power station. Those legal acts include a reference to “installed power of electrical plant of a renewable energy source” – a photovoltaic cell using solar radiation energy. Therefore, it should be presumed that the legislator had in mind the rated power of PV panels. It has not been precisely described which parameters are used to determine this power. When applying for a building permit and related agreements and decisions (e.g. Environmental Decision, Zoning Conditions, sale of electricity from renewable energy sources at the auction of the Energy Regulatory Office –URE), the authorities (e.g. the Energy Regulatory Office) literally define the rated power of a photovoltaic power station as the sum of the power of PV panels specified in the manufacturer’s documentation. They do not go into details concerning the specificity of the panel operation. They treat this source of energy just like other sources, e.g. synchronous generators in conventional power stations, wind farms or hydroelectric power stations. Also, grid connection conditions are issued based on the same data, although the active power supplied to the power grid is not only determined by photovoltaic panels but also by the power of the inverters. If we connect 2 MW in PV panels to inverters of the total power 1 MW, the maximum power supplied to the grid will still be 1 MW. Based on the issued administrative decisions, the investor applies for the grid connection conditions. At this moment, it is the value provided in previous decisions that are submitted in the application. In order to avoid a costly and time-consuming environmental impact assessment required under the Acts [10, 11] and the Regulation [12], photovoltaic power stations up to 1 MW are designed and constructed.


As results from the measurements performed (Fig. 6), the power station did not reach the rated value of active power either of the installed PV panels or the installed inverters in any of the months. According to legal regulations described above, the rated power of the power station is 1 MW. However, within five years of its operation, it never reached this value. In some hours, it reached the value of 900 kW, and its maximum value was 910 kW. With the connection power and the installed power of 1 MW in the power system, it lost about 100 kW, i.e. 10% of the connection power. Given the poorly developed MW power grid outside cities where these plants are being built (due to, e.g. lower land purchase costs) and the resulting shortage of network transmission capacity, each additional kilowatt of available power should be reasonably managed. Therefore, the regulations ought to be changed or made more accurate so as there are no “idle” generation capacities in the system. Figure 6 also shows high dependency of the active power generated to the grid on the season. This relationship is even more clearly demonstrated in the diagram of the average value (median) of active energy generated during one day by a photovoltaic power station (Fig. 7). In months with poorer insolation, the average value of energy provided in one day can be several times lower than in summer months. The highest value is achieved in May, when the sun shines at a large angle and a day is long, and the average air temperature is lower than in summer months such as: June, July or August. On the other hand, August has more sunny days on average than July and lower air temperatures. Figure 8 presents the values of energy generated by the PV power station in individual months of the year.


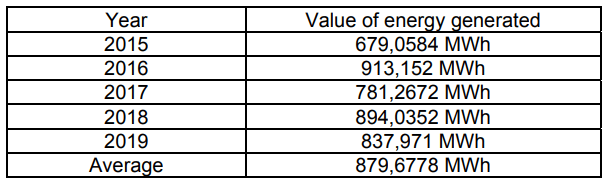
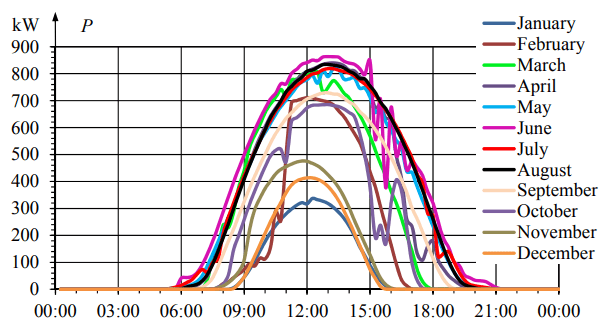
The value of energy generated in winter months, i.e. November, December, January and February, does not exceed 20% of the value of energy generated in summer months. The power station was commissioned on 21 May 2015, therefore the value of energy generated in this month was much lower than in other years. Most energy generated by the power station falls for the months of April, May, June, July, August and September. Figure 9 presents the variations of the active power values generated during the entire day by the PV power plant on selected sunny days and in individual months. Three winter months (November, December and January) clearly stand out here. In these months, active power generated to the grid is significantly lower than in other months. Even in February, March or October, on a sunny day, power generated to the power grid is only slightly lower than in May or June. At the peak of generated power, differences do not exceed 20%. The peak of the power station operation on sunny days reaching above 700 kW in summer months is recorded for maximum up to five hours a day. As results from the analysis conducted, since the time of its construction, the power station operated above 700 kW for 727 hours, i.e. 30 days out of 1686 days, which accounts for 1.80% of the entire period. In order to reduce the grid connection power, electricity storage in the form of batteries should be used to store energy in the generation peaks and to release it in the peaks of power system requirements or in hours when the electricity is most expensive. The power of such a battery would amount to about 740 kWh and the inverter power – about 200 kW. At that time, 300 kW of available connection power would be obtained, i.e. about 1/3 of the present value. Table 3 presents the values of energy generated by the power station in individual years. On average, the power station produced about 880 MWh yearly (taking into account its commissioning on 21 May 2015).
Table 3. Energy generated by the PV power station in individual years
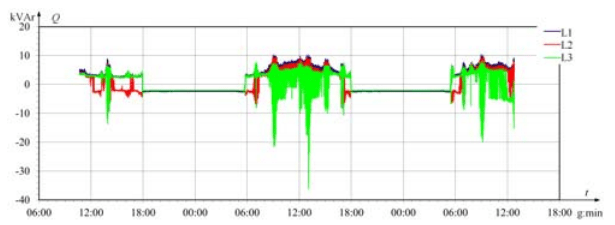
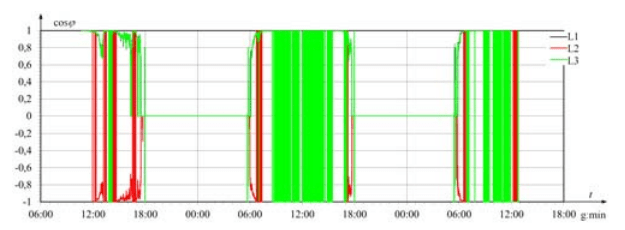
In order to investigate more precisely the effect of the PV power station on the power grid, electricity quality parameters were measured in the power station on the low voltage side, using the power quality analyser HIOKI 3196 at a 1 s interval. As results from voltage measurements on the LV side (Fig. 10), voltage increases during the day when inverters operate. Active power generated to the grid measured on the LV side (Fig. 11) is characterized by identical variability as the power measured at the MV side (Fig. 9). The negative sign of active power on the LV side (Fig. 11) results from the fact that the measurement was carried out in the same way as for the electricity receiver. As follows from the measurement of reactive power of the fundamental harmonic (Fig. 12) at the time when the panels do not operate (at night) inverters receive capacitive reactive power, and when the PV panels operate, they receive inductive reactive power and capacitive reactive power [14, 15, 16, 17, 18]. This is also confirmed by the measurement of the power factor (Fig. 13). The capacitive reactive power load of the fundamental harmonic during the time when the panels do not operate may be caused by the power consumption by cables supplying the inverters and the capacitive character of the PN semiconductor connectors in the photovoltaic panel.


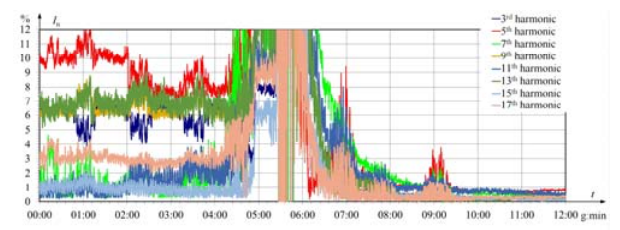
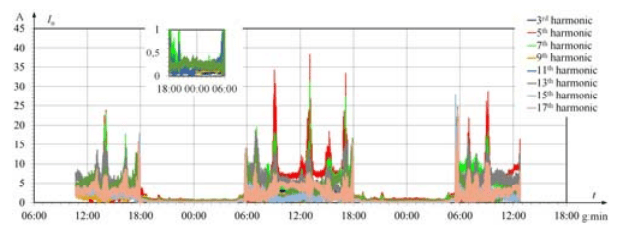
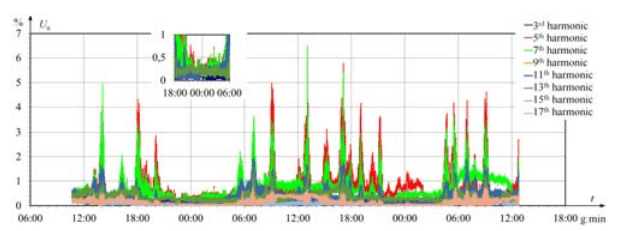
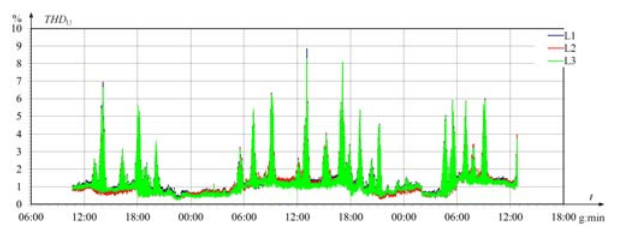
The measurement of higher harmonics of currents (relative values related to the first harmonic) generated by the power plant on the LV side shows that during the operation of PV panels (Fig. 14 and Fig. 15), the content of individual harmonics does not exceed 1%. The situation changes with lower values of currents generated to the grid (Fig. 16) and when the PV panels do not operate, i.e. at night. However, the values of individual harmonics in the load current (Fig. 17) do not exceed 40 A when inverters are in operation, and 1 A when inverters do not operate. During the start-up of the inverters, individual harmonics reach the values up to 100%, THDI (Fig. 18) even to 500%, and TiHDI to 100% (Fig. 19). At night, the values of some harmonics exceed 10%. This situation is caused by a very low value of the active component of current and its significant deformation. Inverters have a negative effect on voltage deformation in the low voltage grid to which they are connected (Fig. 20 and Fig. 21). The values of individual harmonics in the supply voltage do not exceed the permissible values specified in the standard [13] and the total content of higher harmonics in the supply voltage (Fig. 20).


Remarks and conclusions
The measurements conducted and the analysis of results lead to the following conclusions:
– The photovoltaic power station is characterized by a very high dependence of the active power supplied to the power grid on the season. In November, December, January and February, the power station supplies to the grid only 20% of the energy supplied in summer months (Fig. 7).
– At the latitude of 53° 46′, the photovoltaic power station never reached its rated power (Fig. 6). On some days and hours (12-13), the power plant reached 90% of its rated power, i.e. the power of the PV panels installed.
– The 1 MW power station at our latitude generates about 880 MWh of electricity during a year (Table 3).
– A significant amount of energy generated during the year by the PV power plant originates from the months from April to September (Fig. 7 and Fig. 8),
– The power station draws a very low reactive power of the fundamental harmonic, amounting to 2% of the apparent power (Fig. 12).
– At the time when panels do not generate power, reactive capacitive power is drawn from the grid, and when PV panels operate, reactive inductive and capacitive power of the fundamental harmonic is drawn from the grid. The power ratio changes at that time very dynamically (Fig. 13).
– The power plant generates low values of higher harmonics during operation (Fig. 14, Fig. 15, Fig. 17, Fig. 18 and Fig. 19), not exceeding 40 A (1%) for individual harmonics. However, during the start-up of the power station, when the operating current (Fig. 16) is low, the power station generates to the grid very high values reaching up to 100% for individual harmonics of currents, and the total harmonic distortion in the load current is even up to 500%. At night, inverters collect (generate) to the grid capacitive current of the content of higher harmonics reaching up to 15%.
– Inverters have a very negative effect on the low voltage power supply network (Fig. 20) distorting the network voltage from about 1% (when they do not operate) to about (2-3)% on average during the inverter operation, and in the peaks, the content of higher harmonics reaches even (6- 8)%. A distorsion of THDI current consumed by a photovoltaic power station at the start of inverters or at night (when inverters do not work) (Fig. 17 and 18) is manifested by an increase in the content of higher harmonics of THDU supply voltage (Fig. 21 and 22). “Spikes” in currents (Fig. 17) caused by an increase in the higher harmonics value of currents appear, at the same time, in the form of “spikes” (value increase) in higher harmonics of voltages (Fig. 20) and in THDU (Fig. 21).
LITERATURE
[1] Jastrzębska G.: Ogniwa słoneczne. Budowa, technologia i zastosowanie [Solar cells. Construction, technology and application], Wydawnictwa Komunikacji i Łączności, Warszawa, 2014
[2] The Act amending the Renewable Energy Sources Act and Some Other Acts of 7 June 2018, Dz.U. 2018 item 1276
[3] Sztymelski K.: Analiza uzysków rzeczywistej instalacji PV typu on-grid o mocy 2 kWp. Porównanie z symulacjami [An analysis of yields of a real 2 kWp PV on-grid plant. Comparison to simulations], XLI SPETO 2018 Conference, 91-92
[4] Piotrowski P.: Analysis of variable selection in the task of forecasting ultra-short-term production of electricity in solar systems, Electrotechnical Review. R. 90, No. 4 2014, 5-9
[5] Mazur. D., Żabiński T.: Prognozowanie wytwarzania energii z odnawialnych źródeł energii [Forecasting energy production from renewable energy sources], XLII SPETO 2019 Conference, 69-70
[6] Dobrzycki A, Ambrozik P.: Analiza wpływu elektrowni fotowoltaicznej na sieć elektroenergetyczną [An analysis of the effect of the photovoltaic power station on the power grid], Poznań University of Technology Academic Journal, No. 89, 2017, 321-333
[7] The Energy Law Act of 10 April 1997. Dz. U. 1997 No. 54 item 348 as amended
[8] The Renewable Energy Sources Act of 20 February 2015. Dz. U. 2015 item 478 as amended
[9] The Construction Law Act of 7 July 1994. Dz. U. 2019 item 1186
[10] The Environmental Protection Law Act of 27 April 2001. Dz. U. 2001 No. 62 item 627
[11] The Act on Providing Information about the Environment and its Protection, Public Participation in the Environmental Protection and on Environmental Impact Assessment of 3 October 2008. Dz. U. 2008 No. 199 item 1227
[12] The Regulation of the Council of Ministers of 10 September 2019 on projects which may significantly affect the environment. Dz. U. 2019 item 1839
[13] PN-EN 50160: 1998. Supply Voltage Parameters of Public Distribution Grids
[14] Goergens P., Potratz F., Godde M., Schnettler A.: Determination of the Potencjal to Provide Reactive Power from Distribution Grids to the Transmission Grid Using Optimal Power Flow. IEEE 50th International Universities Power Engineering Conference (UPEC), 1-4 Sept. 2015, 1-6
[15] Turitsyn K., Sulc P., Backhaus S., Chertkov M.: Options for Control of Reactive Power by Distributed Photovoltaic Generators. Proc. IEEE, Vol. 9, No. 6, Jun. 2011, 1063-1073
[16] Kundu S., Backhaus S., Hiskens I.: Distributed Control of Reactive Power from Photovoltaics Inverters. IEEE International Symposium on Circuits and Systems (ISCAS2013), 2013, 149-252
[17] Maknouninejad A., Kutkut N., Batarseh I.: Analysis and Control of PV Inverters Operating in VAR Mode at Night. IEEE Conference ISGT, 2011, 1-5
[18] Sarkar M., Meegahapola L., Datta M.: Reactive Power Management in Renewable Rich Power Grids: A Review of Grid-Codes, Renwable Generators, Support Devices, Control Strategies and Optimization Algorithms. IEEE Access, Vol.6, 2018, 41458-41489
Authors: dr inż. Andrzej Lange, University of Warmia and Mazury, Department of Electrotechnology, Power Industry, Electronic and Automation, ul. Oczapowskiego 11, 10-736 Olsztyn, e-mail: andrzej.lange@uwm.edu.pl
prof. dr hab. inż. Marian Pasko, Silesian University of Technology, Institute of Electrotechnology and Computer Science, ul. Akademicka 10, 44-100 Gliwice, e-mail: marian.pasko@polsl.pl;
Source & Publisher Item Identifier: PRZEGLĄD ELEKTROTECHNICZNY, ISSN 0033-2097, R. 96 NR 5/2020. doi:10.15199/48.2020.05.05
