Published by Electrotek Concepts, Inc., PQSoft Case Study: Wind Plant IEEE Std. 519 Compliance Evaluation, Document ID: PQS1201, Date: January 25, 2012.
Abstract: This case study presents the results for a wind plant substation IEEE Std. 519 harmonic measurement compliance evaluation. The wind plant substation supplied 65 wind turbine generators and the power quality monitor was connected to the 34.5 kV transformer secondary winding, which was considered the point of common coupling (PCC) for the harmonic analysis.
INTRODUCTION
A wind plant substation IEEE Std. 519 harmonic measurement compliance case study was completed for the 34.5 kV wind plant substation shown in Figure 1.
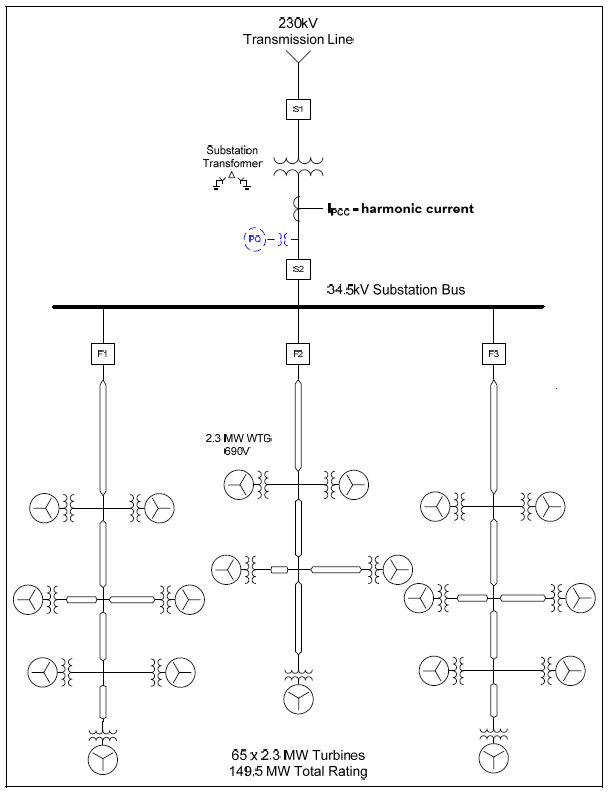
The wind plant substation was supplied from a 230 kV transmission line and included a 180 MVA, 230/34.5/13.8 kV step-down transformer with a number of 34.5 kV collector circuits supplying 65 2.3 MW (690 V secondary) Type 4 full conversion wind turbine generators. The monitor was connected at the 34.5 kV transformer secondary, which was considered the point of common coupling (PCC).
The twenty-four day monitoring period was from November 16, 2009 through December 13, 2009. The power quality instrument used to complete the harmonic measurements was the Dranetz Power Xplorer PX5. The instrument samples voltages and currents at 256 points-per-cycle and follows the IEC 61000- 4-7 method for characterizing harmonic measurement data. This involves analysis of continuous 200msec samples and storing aggregated 10-minute minimum, average, and maximum trend data. The measurement and statistical harmonic analysis was completed using the PQView® program.
MEASUREMENT DATA ANALYSIS
Figure 2 shows the measured total plant power production during the twenty-four day monitoring period. Statistical analysis of the 61,901 individual steady-state power measurements yielded an average value of 27.081 MW, a maximum value of 144.872 MW, and a CP95 value of 129.203 MW. CP95 refers to the cumulative probability, 95th percentile of a value.
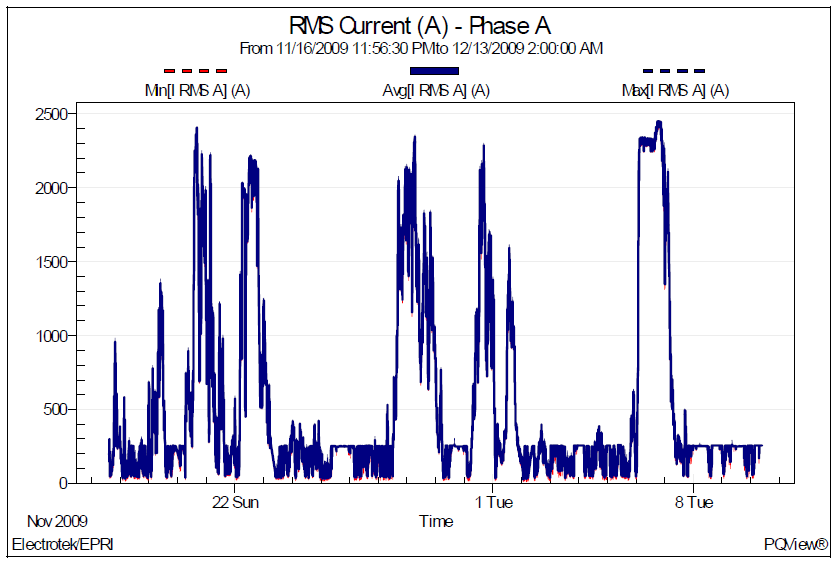
Figure 3 shows the measured total plant rms (Phase A) current trend. The corresponding phase current histogram is shown in Figure 4. The average value was 543 A, the maximum value was 2,449 A, and the CP95 value was 2,177 A (130 MVA). The CP95 value was used for the facility load current rating in the IEEE Std. 519 harmonic analysis.


The IEEE Std. 519 harmonic voltage distortion limits for the wind plant installation are summarized in Table 1. The harmonic measurement data is evaluated on a statistical basis where the limit must be met 95% of the time (CP95).
Table 1 – IEEE Std. 519 Voltage Limits for the Wind Plant Substation

Figure 5 illustrates the corresponding measured total harmonic voltage distortion (THD) trend with an overlay of the IEEE Std. 519 total distortion (VTHD) limit of 5%. The average value was 2.18%, the maximum value was 4.23%, and the CP95 value was 4.09%. The measured voltage distortion was below the IEEE Std. 519 limit of 5%.
The harmonic current limits for the wind plant installation that are summarized in Table 2 are applied to the currents measured at the point of common coupling (PCC). The short-circuit ratio is not relevant for this application because the standard stipulates that power generation equipment must meet the most stringent limits. The limits are for the worst-case normal conditions lasting longer than one hour. For shorter periods, such as during start-ups or unusual operating conditions, the limits may be exceeded by 50%.
The standard provides the current limits as a percentage of IL, the maximum load current. The measured CP95 value of the load current was 2,177 A (refer to Figure 4). Table 3 shows the resulting current in both percent and amperes. Each of the lower order harmonic currents (h<11) must be no more than 4% of the maximum load current.
Table 2 – IEEE Std. 519 Current Limits for the Wind Plant Substation

Table 3 – Harmonic Current Limits at the PCC
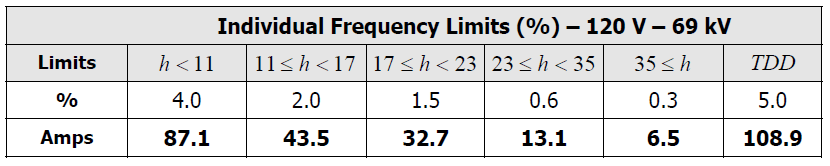

Figure 6 shows the measured total demand distortion (TDD) current trend with an overlay of the IEEE Std. 519 current distortion limit of 108.9 A. The average value was 35.75 A, the maximum value was 54.55 A, and the CP95 value was 51.65 A. The measured total demand current distortion was well below the IEEE Std. 519 limit of 5% (or 109.8 A).
Figure 7 shows the measured 5th harmonic current distortion trend in amperes with an overlay of the IEEE Std. 519 current distortion limit of 87.1 A. The average value was 11.63 A, the maximum value was 28.92 A, and the CP95 value was 23.24 A. The measured 5th harmonic current distortion was below the IEEE Std. 519 limit of 4% (or 87.1 A).
Figure 8 shows the measured 7th harmonic current distortion trend in amperes with an overlay of the IEEE Std. 519 current distortion limit of 87.1 A. The average value was 30.91 A, the maximum value was 48.01 A, and the CP95 value was 43.80 A. The measured 7th harmonic current distortion was below the IEEE Std. 519 limit of 4% (or 87.1 A).
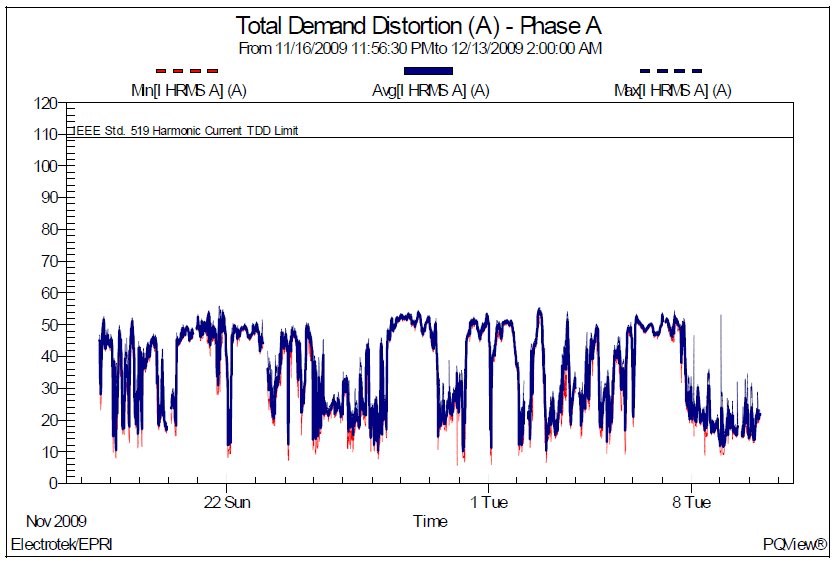
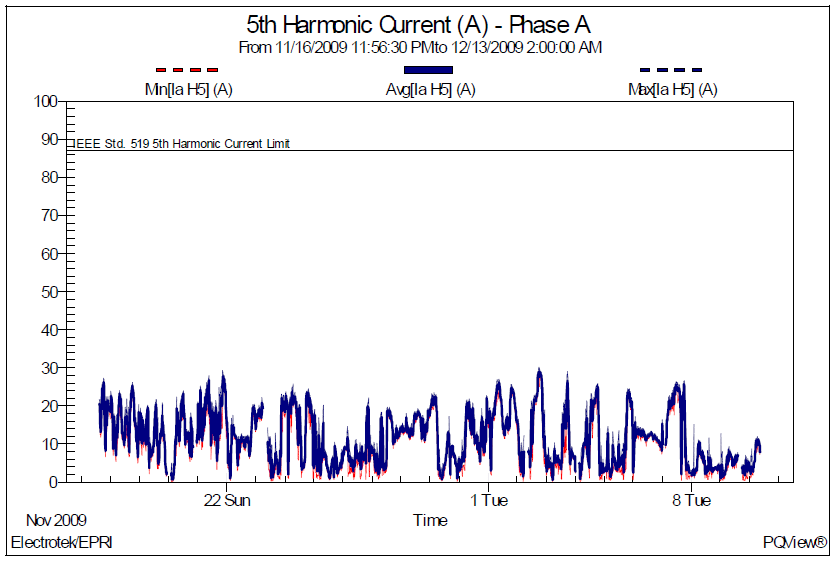

Figure 9 shows the statistical summary of total harmonic voltage distortion (VTHD) and a number of the individual harmonics for the twenty-four day monitoring period. The analysis shows that the predominate harmonics for the measured substation bus voltages were the 5th, 7th, 11th, and 13th. The measured values were below the IEEE Std. 519 voltage distortion limits, which were 5% THD and 3% for any individual harmonic.
The statistical summary in Figure 9 corresponds to the voltage distortion measurement data previously shown in Figure 5 (voltage distortion trend). Statistical analysis of the measurement data yielded a CP05 of 0.75%, an average distortion of 2.18%, and CP95 value of 4.09%.
Figure 10 shows the corresponding statistical summary of total harmonic current distortion and a number of the individual harmonics for the twenty-four day monitoring period. The analysis shows that the predominate harmonics for the measured substation currents were the 5th, 7th, 11th, and 13th. The base current for the statistical summary was 2,177 A, which was the CP95 load current value previously used in the IEEE Std. 519 evaluation.
The statistical summary in Figure 10 corresponds to the harmonic current data previously shown in Figure 6 (current demand distortion trend). Statistical analysis yielded a CP05 value of 0.74%, an average current of 1.64%, and a CP95 value of 2.37%. Analysis of the measurement results showed that the harmonic currents did not exceed the IEEE Std. 519 TDD limits during the twenty-four day measurement period.

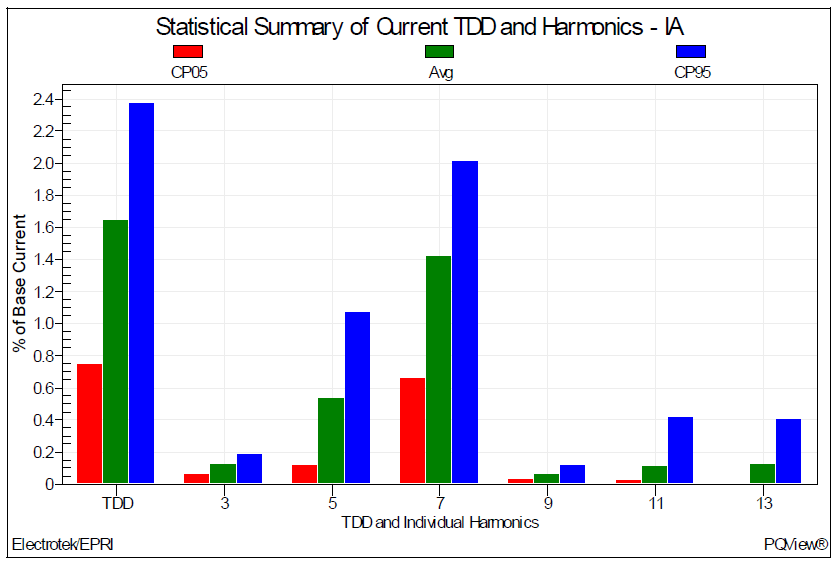

Figure 12 shows the corresponding calculated voltage waveform created using the measured harmonic spectrum data. The fundamental frequency voltage was 20.395 kV, the rms voltage was 20.089 kV, and the voltage distortion was 3.33%.

SUMMARY
This case study summarizes a wind plant substation IEEE Std. 519 harmonic measurement compliance analysis for a twenty-four day monitoring period. The wind plant substation supplied 65 2.3 MW wind turbine generators (149.5 MW total). The monitor was connected to the 34.5 kV transformer secondary winding, which was considered the point of common coupling (PCC) for the harmonic analysis.
The twenty-four day monitoring period was from November 16, 2009 through December 13, 2009. The power quality instrument used to complete the harmonic measurements was the Dranetz Power Xplorer PX5. The instrument samples voltages and currents at 256 points-per-cycle. The measurement and statistical harmonic analysis was completed using the PQView® program. Analysis of the measurement results showed that the harmonic voltages and currents did not exceed the respective IEEE Std. 519 limits during the twenty-four day measurement period.
Mitigation alternatives for reducing harmonic distortion levels include methods for modifying the power system to reduce or eliminate the harmonic resonances that can cause very high current or voltage distortion levels. For example, a passive shunt harmonic filter may be added to the utility or customer system to divert the troublesome harmonic currents off the system and into the filter.
In addition, the rating of power factor correction capacitor banks may be changed to shift the harmonic resonance frequency and reduce the resulting voltage distortion levels. This is often one of the least expensive options for both utilities and their customers. Voltage regulation and power factor correction considerations should be evaluated before changing capacitor bank ratings.
REFERENCES
1. IEEE Recommended Practice for Monitoring Electric Power Quality,” IEEE Std. 1159-1995, IEEE, October 1995, ISBN: 1-55937-549-3.
2. IEEE Recommended Practices and Requirements for Harmonic Control in Electrical Power Systems, IEEE Std. 519-1992, IEEE, ISBN: 1-5593-7239-7.
