Published by Electrotek Concepts, Inc., PQSoft Case Study: Industrial Facility IEEE Std. 519 Compliance Evaluation, Document ID: PQS1015, Date: October 15, 2010.
Abstract: This case study presents an industrial facility IEEE Std. 519 harmonic compliance evaluation. The analysis included frequency response and harmonic distortion simulations for a substation and a single industrial customer with a number of lower voltage power factor correction capacitor banks. The analysis included IEEE Std. 519 compliance calculations for various system contingencies. The mitigation alterative applied included a shunt passive harmonic filter which reduced voltage distortion levels below the specified limitations.
INTRODUCTION
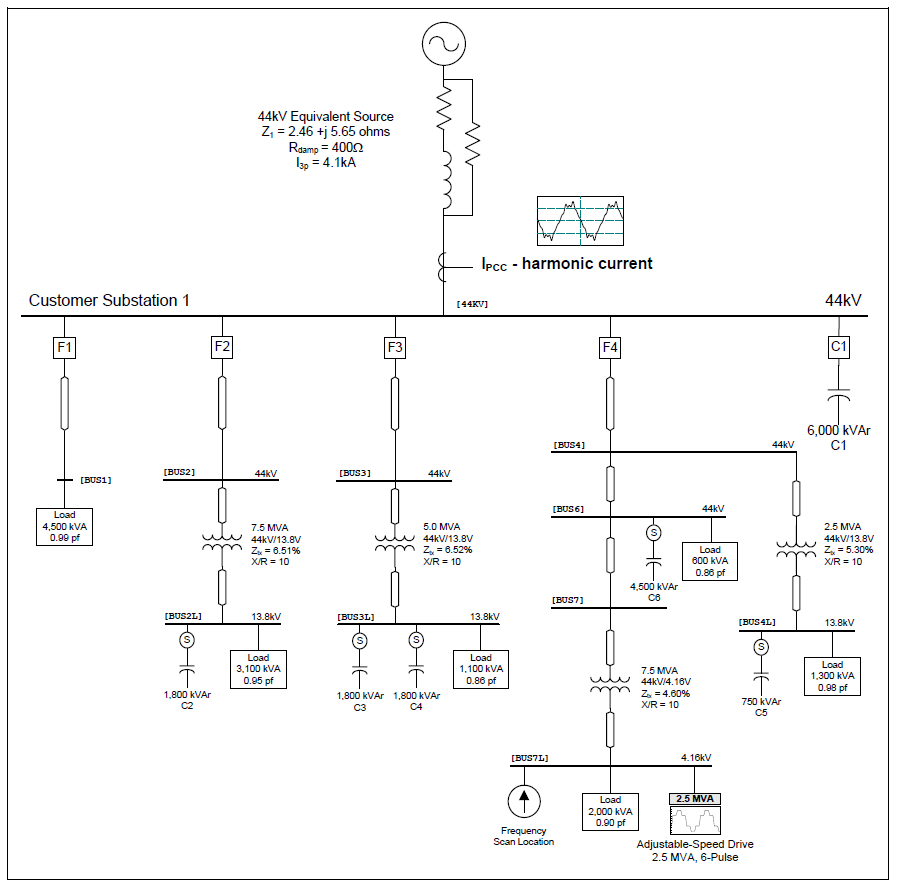
An industrial facility IEEE Std. 519 harmonic compliance case study was completed for the system shown in Figure 1. The 44 kV utility substation supplied a number of step-down transformers in a plastic extrusion facility. The facility included a number of utility and customer power factor correction capacitor banks and a 2.5 MVA, six-pulse adjustable-speed drive. The utility capacitor bank at the substation bus was rated 6,000 kVAr, 44 kV and there were also several 1,800 kVAr, 13.8 kV capacitor banks connected to various customer secondary buses.
The harmonic characteristics of the drive was determined from field measurements. The case study was completed using the SuperHarm® program. The accuracy of the simulation model was verified using three-phase fault currents and other steady-state quantities, such as steady-state voltage rise.
SIMULATION RESULTS
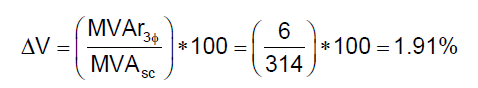
Fault currents at various points in the facility and the voltage rise at 44 kV substation bus with the 6,000 kVAr capacitor bank in-service were used to verify the accuracy of the harmonic simulation model. The simulated steady-state voltage rise at the substation bus with the 6,000 kVAr, 44 kV capacitor bank in service was approximately 1.8%. This value was validated using the following expression:
where:
ΔV = steady-state voltage rise (per-unit)
MVA3Φ = three-phase short circuit capacity (MVA = √3*44 kV*4.12kA≈314MVA)
MVAr3Φ = three-phase capacitor bank rating (MVAr)
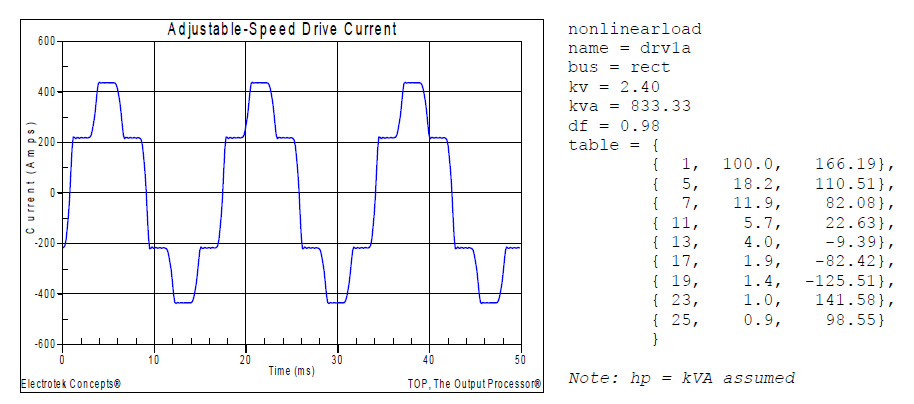
Figure 2 shows the simulated harmonic current characteristic for 2.5 MVA, 4.16 kV six-pulse adjustable speed drive. The current had a fundamental frequency value of 293 A, an rms value of 301 A, and a THD value of 23.1%. The highest harmonic current components were the 5th at 18.2% and the 7th at 11.9%. The waveform shown was created using an inverse DFT with 256 points per cycle.
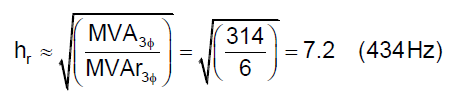
A thorough investigation of the effect of various substation and customer capacitor banks was completed using a batch solution capability that allowed multiple data cases to be completed consecutively. Different distinct frequency scan and harmonic distortion output files were created for each set of system conditions. The batch solution involved 64 different cases, representing all of the possible substation and customer capacitor bank switching conditions. The frequency scan and harmonic distortion results for each of the cases were reviewed to determine the number of cases where the IEEE Std. 519 total demand distortion (TDD) limits were exceeded. Twenty of the 64 cases exceeded the current distortion limits. Results from six of the 64 cases were used to summarize a number of the relevant observations. Figure 3 shows the impedance vs. frequency simulation result with the 6,000 kVAr, 44 kV substation capacitor bank (C1) in service (Case 9b). The frequency scan was placed at the 4.16 kV bus and the resulting impedance at the 44 kV bus was determined. The basecase result with no utility or customer capacitor banks in-service (Case 9a) was also shown on the graph so the two conditions can be easily compared. The simulated parallel resonance due to the addition of the shunt capacitor bank was 468 Hz (7.8th harmonic).
A simple expression was used to validate this result:
where:
hr = parallel resonant frequency (x fundamental)
MVA3Φ = three-phase short circuit capacity (MVA = √3*44kV*4.12kA≈314MVA)
MVAr3Φ = three-phase capacitor bank rating (MVAr)
Figure 4 shows the impedance vs. frequency simulation results for various substation and customer capacitor bank configurations. The base case result with no utility or customer capacitor banks in-service was also shown for reference. The most significant harmonic resonance frequencies were the 5th and 9th.
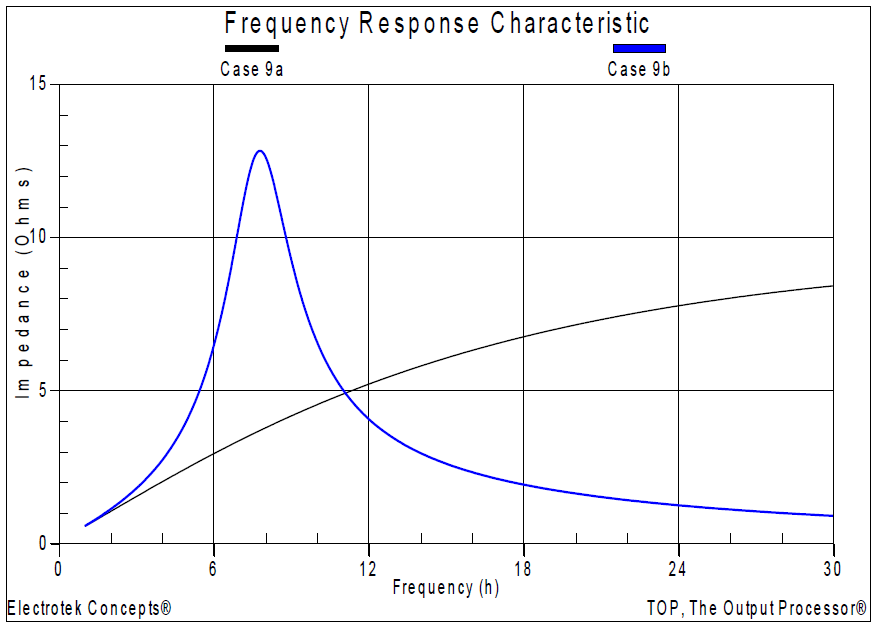
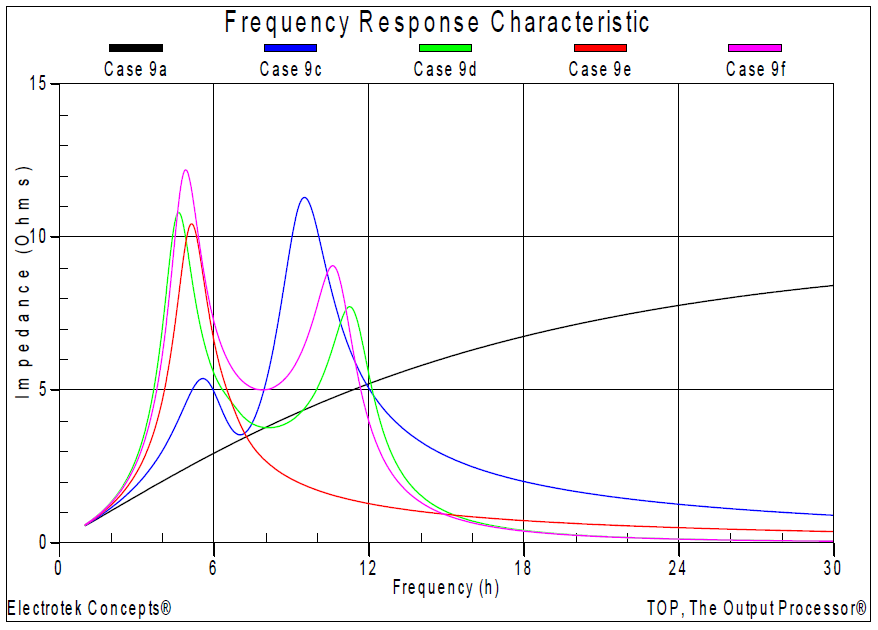
Table 1 summarizes the results for the six corresponding harmonic distortion simulations. The table includes the simulated voltage distortion (VTHD) levels at five buses for the six different operating conditions previously summarized in Figure 3 and Figure 4. The voltage distortion at several locations exceeded the IEEE Std. 519 limit of 5% for several cases.
Table 1 – Summary of the Simulated Voltage Distortion Results
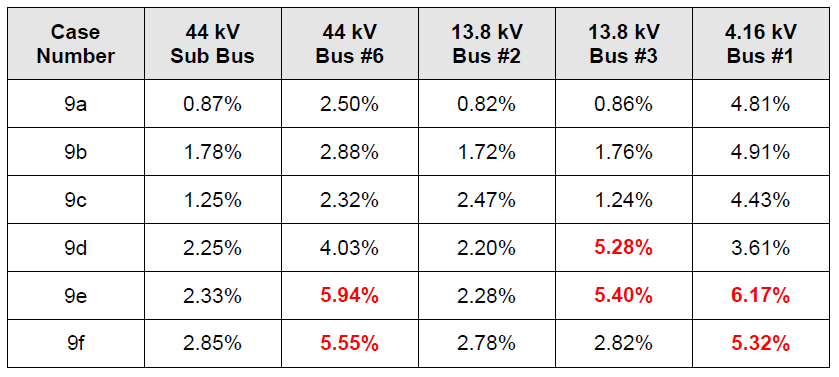
Table 2 shows the harmonic currents limits from IEEE Std. 519 that may be used for industrial customers. The ratio of the short-circuit MVA at the point of common coupling (PCC) to the average maximum demand load was approximately 20.8 (314 MVA / 15,100 kVA). That meant that the second row of the table was used to evaluate the harmonic currents at the PCC for the six different operating conditions.
Table 2 – IEEE Std. 519 Current Limits for Utility Customers
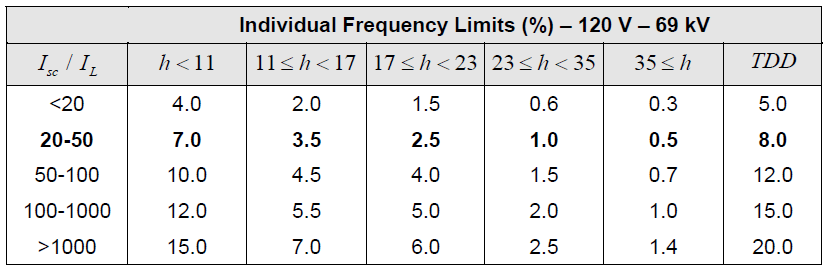
Table 3 summarizes the results of the harmonic current compliance analysis for the six simulated cases. Three of the cases shown in the table exceed the 5th harmonic and TDD current limits. The capacitor banks that were in-service for each simulation case included:
Case 9a: No Capacitor Banks (basecase condition)
Case 9b: 6,000 kVAr C1
Case 9c: 6,000 kVAr C1, 1,800 kVAr C2
Case 9d: 6,000 kVAr C1, 1,800 kVAr C3, 4,500 kVAr C6
Case 9e: 1,800 kVAr C4, 4,500 kVAr C6
Case 9f: 6,000 kVAr C1, 4,500 kVAr C6
Table 3 – Summary of Harmonic Current Limit Compliance
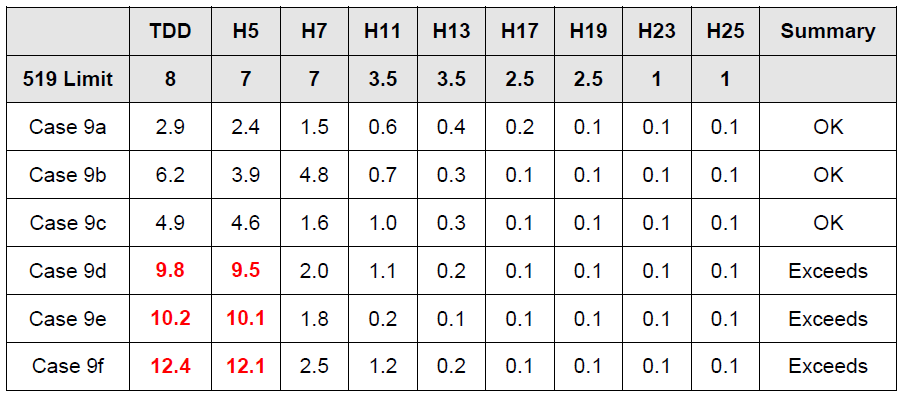
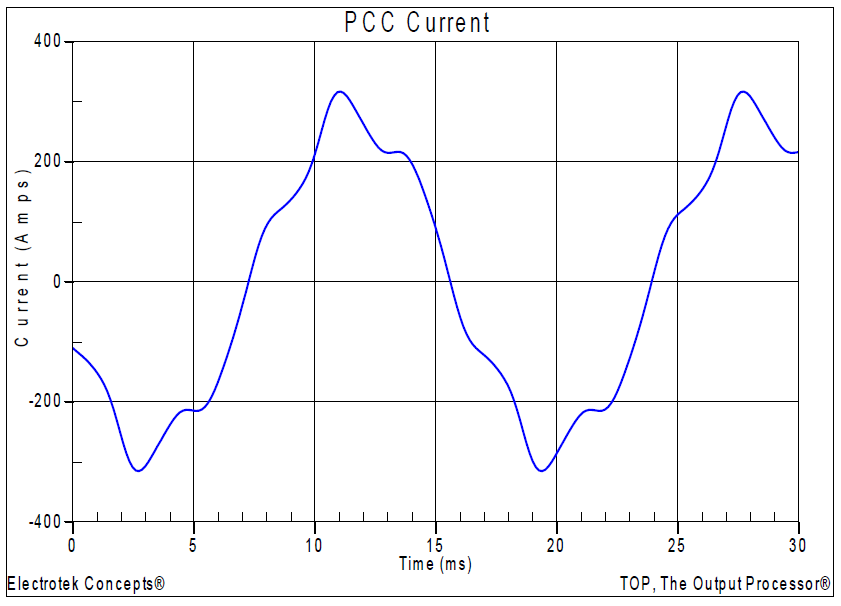
Figure 5 shows the corresponding simulated PCC current waveform (12.4% THD) for Case 9f. The waveform was created using an inverse DFT with 256 points per cycle.
The power conditioning solution alternative that was investigated during the study was adding a new passive shunt single-tuned harmonic filter on the 4.16 kV customer bus with the 2.5 MVA adjustable speed drive. Passive filters are made of inductive, capacitive, and resistive elements. They are relatively inexpensive compared with other means for eliminating harmonic distortion, but they have the disadvantage of potentially adverse interactions with the power system. They are employed either to shunt the harmonic currents off the line or to block their flow between parts of the system by tuning the elements to create a resonance at a selected harmonic frequency.
Filters are generally tuned slightly below the harmonic frequency of concern. This method allows for tolerances in the filter components and prevents the filter from acting as a direct short circuit for the offending harmonic current. It also minimizes the possibility of dangerous harmonic resonance should the system parameters change and cause the tuning frequency to shift slightly higher. The design involved adding a new 1,200 kVAr, 4.16 kV harmonic filter at the customer bus with the nonlinear load. The filter was tuned to the 4.7th harmonic, with an assumed X/R ratio of 20.
Figure 6 shows the impedance vs. frequency simulation result at the 4.16 kV bus with the 4.7th harmonic filter in-service. The previous worst-case frequency scan and the basecase with no utility or customer capacitor banks in-service was shown for reference. As can be observed in the figure, the frequency response characteristic shows a very low impedance at the filter tuning frequency.
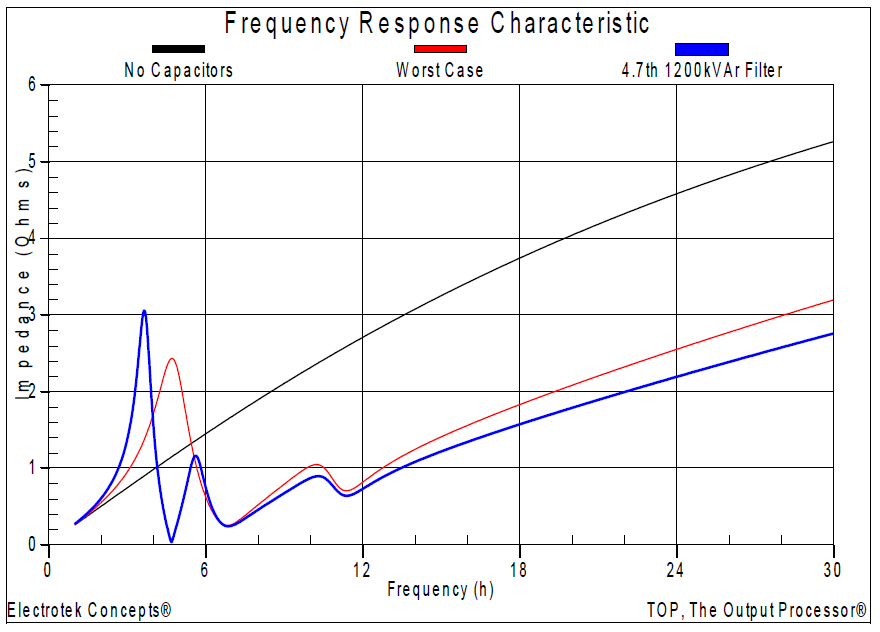
Table 4 summarizes the results for the corresponding harmonic distortion simulation. The table includes the simulated voltage distortion (VTHD) levels at the five buses for the harmonic filter mitigation case (Case 9g) previously shown in Figure 6. The resulting voltage distortion levels at all of the simulated buses were well below the IEEE Std. 519 limit of 5%.
Table 4 – Summary of the Simulated Voltage Distortion Results with Filter In-Service
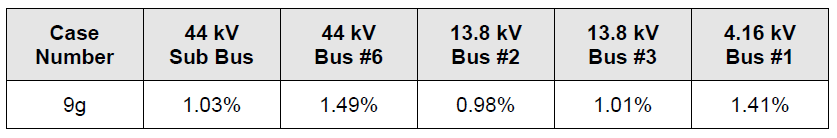
Table 5 summarizes the results of the harmonic current compliance analysis for the harmonic filter mitigation simulation case (Case 9g). None of the values shown in the table exceed the 5th harmonic or TDD current limits. The capacitor and harmonic filter banks that were in-service for the simulation case included:
Case 9g: 6,000 kVAr C1, 4,500 kVAr C6, and 1,200 kVAr 4.7th Filter at 4.16 kV Bus
Figure 7 shows the corresponding simulated PCC current waveform (3.2% THD) for Case 9g. The waveform was created using an inverse DFT with 256 points per cycle.
Table 5 – Summary of Harmonic Current Limit Compliance with Filter In-Service
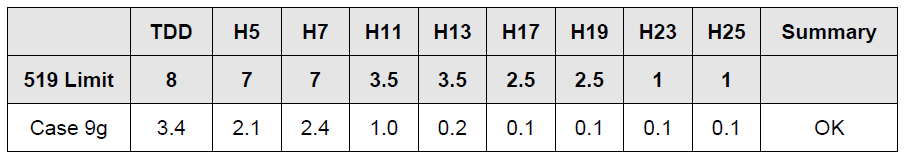
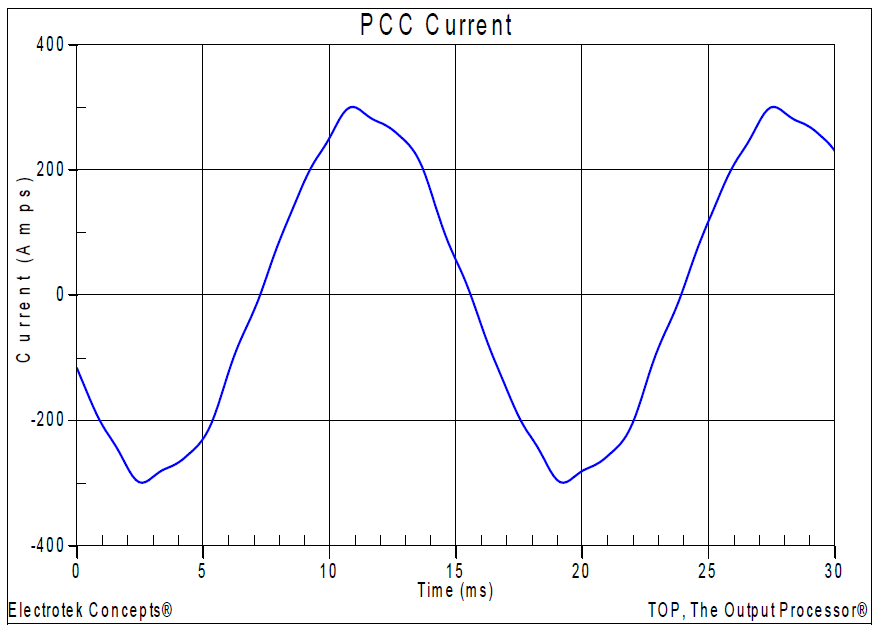
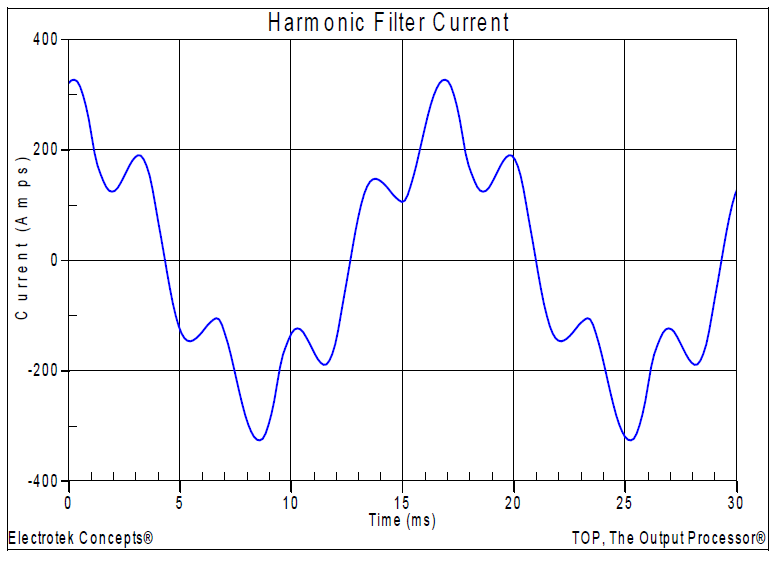
Figure 8 shows the resulting harmonic filter current for the simulation case. The current had a fundamental frequency value of 175 A, an rms value of 184 A, and a THD value of 32.4%. The highest harmonic current components were the 5th at 32.2% and the 7th at 2.08%. The waveform shown in Figure 8 was created using an inverse DFT with 256 points per cycle.
Passive harmonic filters should always be placed on a bus where the short-circuit impedance (XSC) can be expected to remain relatively constant. While the notch frequency is determined by the filter tuning, and will remain fixed, the new parallel resonance will move as the system short circuit impedance varies.
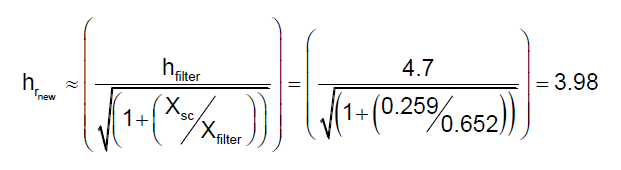
The resulting simulated new parallel resonant frequency with the harmonic filter in-service was approximately 3.7, which was verified using the following expression:
where:
hrnew = resulting (new) parallel resonant frequency (x fundamental)
hfilter = harmonic filter tuning frequency (x fundamental)
XSC = system short circuit reactance ![]()
The power conditioning mitigation alterative selected was to install a new 1,200 kVAr, 4.16 kV harmonic filter hank tuned to the 4.7th harmonic which, in turn, reduced the harmonic voltage distortion levels below the specified limits., as well as meeting the current distortion limits specified in IEEE Std. 519. Due to the excessive component duty requirements, the capacitor bank units that were used in the shunt harmonic filter design were rated at 4.8 kV for application on the 4.16 kV customer secondary bus.
SUMMARY
The case study summarized an industrial facility IEEE Std. 519 harmonic compliance evaluation. The analysis included frequency response and harmonic distortion simulations for a 44 kV substation and a single industrial customer with a number of lower voltage power factor correction capacitor banks. The case also included IEEE Std. 519 compliance calculations for various system contingencies. The mitigation alterative applied included a shunt passive harmonic filter which reduced voltage distortion levels below the specified limitations.
REFERENCES
1. IEEE Recommended Practice for Monitoring Electric Power Quality,” IEEE Std. 1159-1995, IEEE, October 1995, ISBN: 1-55937-549-3.
2. IEEE Recommended Practices and Requirements for Harmonic Control in Electrical Power Systems, IEEE Std. 519-1992, IEEE, ISBN: 1-5593-7239-7.
3. R.C. Dugan, M.F. McGranaghan, S. Santoso, H.W. Beaty, “Electrical Power Systems Quality,” McGraw-Hill Companies, Inc., November 2002, ISBN 0-07-138622-X.
