Published by Rafael ALIPIO, Renan SEGANTINI, Federal Centre of Technological Education of Minas Gerais
Abstract. This paper assesses the transient distribution of potentials along a grounding grid subjected to currents representative of first and subsequent strokes. It is shown that the transient non-uniform distribution of potential along the grounding system may lead to the flow of impulsive current between pieces of equipment grounded at distinct points. The methodology presented in this paper is useful in determining engineering actions to reduce the risks of electromagnetic disturbances propagation due to uneven potential distribution along grounding grids.
Streszczenie. Obliczono chwilowe rozkłady potencjałów w uziomie kratowym podczas odprowadzania prądów piorunowych pierwszego i kolejnych wyładowań głównych. Nierównomierny rozkład potencjału może prowadzić do przepływu prądów impulsowych pomiędzy urządzeniami uziemionymi w różnych punktach. Metoda jest użyteczna do ustalenia środków redukujących zagrożenie związane z nierównomiernym rozkładem potencjału w systemie uziomowym. (Propagacja zaburzeń elektromagnetycznych w uziomie kratowym podczas odprowadzania prądów piorunowych).
Keywords: lightning response of grounding, transient analysis of grounding, transient potential distribution, multiport wideband model.
Słowa kluczowe: odpowiedź uziomu na udar piorunowy, analiza uziomu w stanie nieustalonym, chwilowy rozkład potencjału, szerokopasmowy model wielowejściowy.
Introduction
Extended meshed earthing systems, called grounding grids, are commonly used in large installations, such as substations, to protect and safeguard personnel and equipment against the hazards and devastation that may be caused by the flow of fault currents [1]. They also provide reference voltages for electrical and electronic systems.
The grounding grids are usually designed considering only low-frequency occurrences (50/60-Hz ground-fault currents) [2]. However, the transient response of grounding grids may be also important, for instance, when they are fed by lightning currents [3]. This can occur when lightning directly strikes the substation components or when it strikes spans of power lines near the substation. In both cases, a noticeable portion of the current is driven to the ground.
When subjected to lightning currents, the grounding grid response presents certain complexities that make its behaviour quite different from that presented at low frequency [4]. Due to the impulse nature of lightning currents, they present a wideband frequency content ranging from dc to several MHz. In this frequency range, the grounding system shows different behaviour at different frequency intervals. Among other aspects, this frequency dependent behaviour of grounding leads to an uneven potential distribution along the grounding grid [3].
The non-uniform distribution of potentials along the grounding grid may be source of electromagnetic disturbances. For instance, it is common in modern substations or industrial plants the existence of electrical panels in the control room that are responsible for remote commanding the operation of some equipment installed in the substations yard. In many cases, the equipment and the panel are grounded at distinct points of the grounding system (see Fig. 1 of reference [3]). Hence, when the grounding is subjected to lightning currents, the resulting non-uniform distribution of potentials may cause the flow of impulsive currents through the closed path between the equipment at the substation yard and the electric panel at the control room. Such loop currents are source of electromagnetic disturbances, causing equipment malfunctions, failures and damage.
The objective of this work is to make a sensitivity analysis of the potential distribution in a grounding grid subjected to impulsive currents. The present paper is an extension of the previous analysis developed by the first author in [3], considering two main new aspects. First, in order to simulate the wideband behaviour of the grounding grid, an accurate multiport model is developed, which can be promptly included in widespread time-domain electromagnetic transient tools, such as ATP-EMTP, EMTPRV, and PSCAD. This multiport model allows simulating the grounding system in conjunction with the substation components, and is suitable for developing accurate electromagnetic transient studies using time-domain tools. Secondly, realistic lightning current pulse waveforms are used, which reproduce the observed concave rising portion of typical measured lightning currents.
Modelling of grounding systems
As mentioned, lightning currents present a wideband frequency content ranging from dc to several MHz. Therefore, to develop accurate analysis of the transient response of grounding systems, their frequency-dependent behaviour should be considered. To this aim, a wideband model of the grounding grid is obtained as briefly described in next paragraphs.
The wideband response of the grounding grid is determined using the accurate Hybrid Electromagnetic Model (HEM) [5], in a frequency range from dc to several megahertz. In particular, HEM is used to determine the grounding admittance matrix Yg(s) over the frequency range of interest [6]. The grounding admittance matrix physically relates the vector of nodal voltages of grounding system and the vector of injected current into each grounding node. The Hybrid Electromagnetic Model solves Maxwell’s equations numerically via the vector and scalar potentials using the thin wire approximations [5]. The calculations are performed in frequency domain and, if required, time domain results can be obtained by means of inverse Fourier or Laplace transform. The accuracy of the results provided by this model in terms of the impulse response of grounding was proved by comparison with experimental results, considering different grounding arrangements (for instance, horizontal electrodes and rods in [7] and large grids in [8]).
After calculating the frequency response of the grounding grid, a pole-residue model of the calculated nodal admittance matrix Yg(s) is obtained. The objective is to calculate a pole-residue model (1) which approximates (“fits”) the original data as close as possible.

In case of a physical system, the admittance matrix Yg(s) is symmetrical. Hence, Rm, D and E are also symmetric, being D and E real matrices. In this work, E is set equal to zero, D is related with the low-frequency response of grounding and the sum of rational functions represents the frequency response of grounding. The approximated model Yfit fits the results calculated using the accurate electromagnetic model.
To obtain a pole-residue model (1), the Vector Fitting (VF) technique is used [9]. First, the pole-residue model of the grounding system admittance matrix is obtained. Then, in order to obtain stable time-domain simulations, the passivity is enforced by perturbation of model parameters. Further details regarding the VF and the passivity enforcement by perturbation can be found in [9, 10].
Finally, once the passive pole-residue model of the grounding system admittance matrix is obtained, it can be represented in the form of an electrical network, which can be promptly included in time-domain simulations. Considering this approach, the rational functions can be easily converted into basic network elements (R, L, C). The network has branches between all nodes and ground, representing the diagonal elements of Yfit, and between all nodes, representing the off-diagonal elements of Yfit. Once determined the equivalent electrical network, it can be imported directly into time-domain electromagnetic transient tools.
Developments
We consider a square grounding grid of 60 m x 60 m, composed of square meshes with space between conductors of 5 m, as depicted in Fig 1. The conductors are constructed from copper with 7-mm radius and the grid is buried at a depth of 0.8 m in a uniform soil. There different values of soil resistivity ρ are considered, 300, 1000 and 3000 Ωm, comprising low, moderate and high values of resistivity. The relative permittivity is assumed εr=10 and the relative permeability is assumed μr=1. In a conservative approach, the frequency dependence of the electrical parameters of soil is neglected [7].

In this study we have used two lightning current waveforms corresponding to the typical first and subsequent return strokes, based on observations of Berger et al. [11], according to [12], Fig. 2. The current waveforms are chosen by Rachidi et al. [12] to fit typical experimental data and are reproduced by means of a sum of Heidler’s functions [13]. It should be stressed that subsequent stroke, which has larger rate of rise of the front, has higher frequency content in comparison with the first stroke, as mentioned in [14]. On the other hand, first stroke currents have larger energy content, due to their higher amplitude and longer duration, in comparison with subsequent strokes.
It is assumed that the discharge directly strikes the lightning protection system of the substation and the current is distributed by down-conductors through the four corners of the grid. The resultant Grounding Potential Rise (GPR) developed in points A and B of the grid, see Fig. 1, are then calculated.
The multiport wideband model of the grounding system was obtained according to Section II. It is worth mentioning that both the pole-residue model and the electrical network were obtained using the public domain calculation package for rational approximation of frequency dependent admittance matrices available in [15]. All time-domain simulations presented in the next sections were developed in the Alternative Transients Program (ATP) [16].

Fig.2. The first return-stroke current pulse is characterized by a peak value of 30 kA, zero-to-peak time of about 8-μs and a maximum steepness of 12 kA/μs, whereas the subsequent return stroke current has a peak value of 12 kA, zero-to-peak time of about 0.8-μs and a maximum steepness of 40 kA/μs
Results of Grounding Potential Rise (GPR)
Before analyzing the results, it is important to state some basic aspects concerning the propagation of current and voltage waves along buried bare conductors in soil. The wave propagation is dictated by the medium propagation constant, which is given approximately by
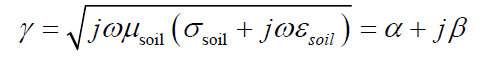
for a given angular frequency ω. In particular, the attenuation of the wave is related with the real part of the propagation constant, called attenuation constant (α). It increases with frequency and with medium conductivity. Thus, larger attenuation of voltage and current waves propagating along bare conductors buried in soils of higher conductivity (lower resistivity) is expected. Similarly, current and voltage pulses of shorter front times are expected to suffer stronger attenuation, due to their higher frequency content.
Figs. 3, 4 and 5 illustrates the GPRs developed in points A and B respectively for soil resistivity of 300, 1000 and 3000 Ωm, in response to current pulses representative of (a) first and (b) subsequent strokes. Based on the results, two main periods can be distinguished in the transient behavior of grounding grid: 1) a fast transient period and 2) a slow transient period.
In the fast transient period, the propagation and inductive effects are pronounced. In this period, the distribution of potentials along the grounding grid is not uniform, since the voltage wave experiences a strong attenuation as it propagates from the current impression points. In the analysed case, the non-uniform potential distribution is related with the transient potential difference between earth terminations A and B, vAB(t). In order to state a criterion to judge whether the potential distribution is more or less uniform, the ratio between the peak value of vAB(t) and the peak value of the transient potential developed in point A, vA(t), is calculated. The larger this ratio, the more non-uniform the potential distribution. Considering the results of Figs. 3, 4 and 5, for soils of 300, 1000 and 3000 Ωm, the ratios between the peaks of vAB(t) and vA(t) are around 37% and 99%, 13% and 92%, 4% and 45%, respectively for first and subsequent strokes. Thus, the more conductive the soil is, the more the potential distribution is non-uniform. This is due to the fact that the attenuation effects are much more significant in soils of higher conductivity. Furthermore, note that the differences between the curves of GPR along the fast transient period are more pronounced in case of subsequent strokes, due to their higher frequency content in comparison with first stroke currents.

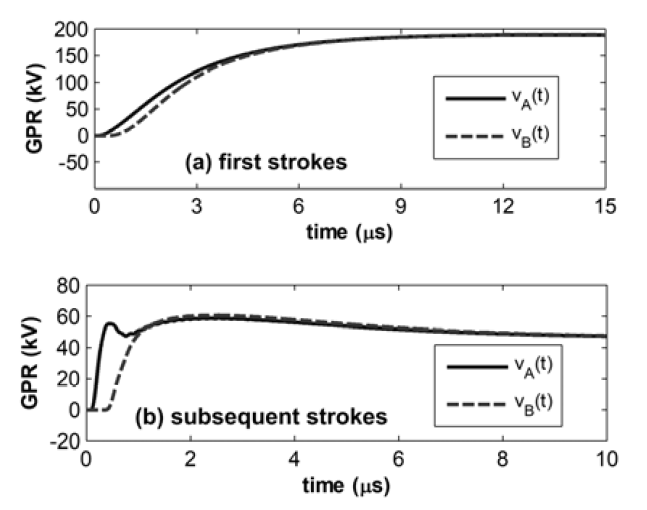
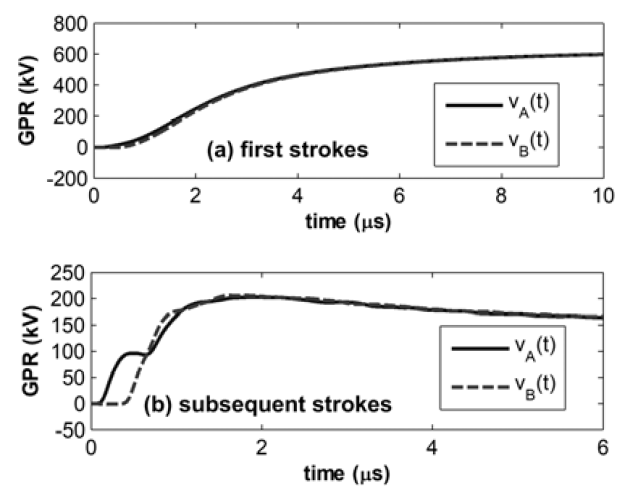
In the slow transient period, the GPR curves of points A and B present a similar behaviour and are basically coincident, indicating that all the points of the grounding grid are at the same potential. This behaviour is associated with the tail of the impressed current waves, which contain the low-frequency components of the current. Thus, during this period the propagation and inductive effects are negligible and the grounding grid presents a uniform potential distribution and can be assumed to be equipotential across its area.
Results of Impulsive Loop Currents and Energy Dissipated
Figs. 6-8 illustrate the transient potential difference between earth terminations A and B, vAB(t), respectively for soil resistivity of 300, 1000 and 3000 Ωm, considering both (a) first and (b) subsequent strokes.
Fig.6. Transient potential difference between earth terminations A and B for a soil resistivity of 300 Ωm, considering the impression into the grounding grid of current pulses representative of (a) first and (b) subsequent strokes
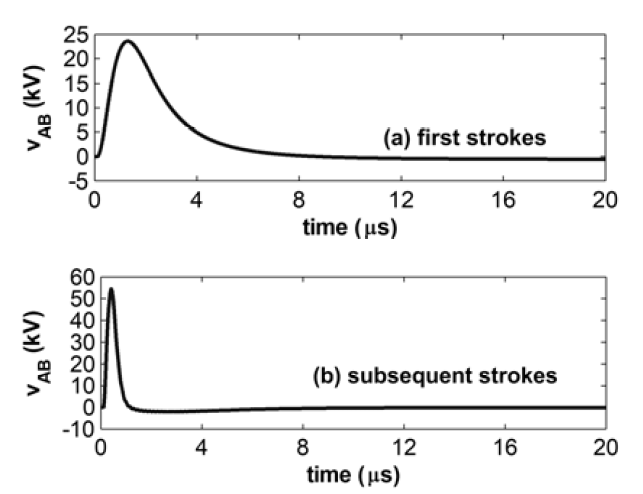
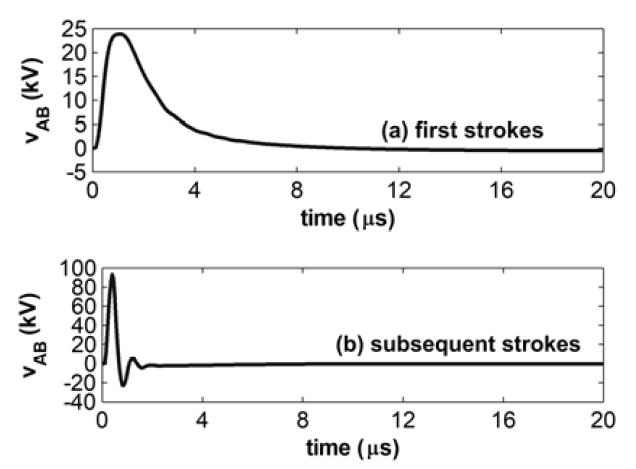
It can be seen that, along the fast transient period, the potential differences between the two earth terminations are significant and present short rise-time, mainly in case of subsequent strokes. Such potential differences may lead to the flow of impulsive loop currents between equipment grounded at distinct earth terminations and connected among each other, for instance, by control or communication cables. Along the slow transient period, there is no current flowing between the equipment, since, there is no potential difference within the grid area (the grid is at a constant potential).
The heating resulting from the energy dissipated while the loop current flows into and through a “victim” circuit is the source of damage. The lightning parameter that is most closely related to this effect is the specific energy or action integral [17]. The response of a “victim” is represented by its equivalent resistance. The dissipated energy, and therefore associated damage, can be roughly estimated as the product of the specific energy by this resistance [17].
In order to make a first assessment of the damage caused by the flow of loop currents, Fig. 9 illustrates the energy dissipated considering the application of the voltages depicted in Figs. 6-8 to a normalized equivalent resistance of 1 Ω. The figure also includes results of further simulations developed for the same grounding system buried in a soil of 100 Ωm.
It can be seen from Fig. 9 that the trend of higher energy dissipation in case where the grid is fed by currents of first strokes is inverted with increasing the soil resistivity. This interesting finding can be explained as follows. Due to the propagation characteristics in high-resistivity soils (lower attenuation and higher propagation velocity), the potential distribution is more uniform along the grounding grid in case of first stroke currents, which present lower frequency content in comparison with subsequent strokes. Thus, in spite of the higher energy content of first stroke currents, in case of grounding systems buried in soils of high resistivity, the energy dissipated by impulsive loop currents tends to be more pronounced considering subsequent currents striking the substation.
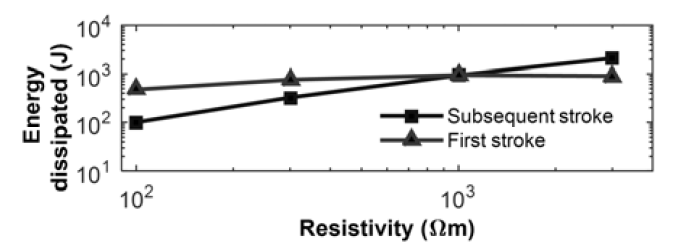
Fig.9. Energy dissipated considering the application of the voltages depicted in Figs. 6-8 to a normalized equivalent resistance of 1 Ω, including additional simulations for the same grid buried in a soil of 100 Ωm
Summary and conclusions
This paper assessed the transient distribution of potentials along a grounding grid subjected to currents representative of first and subsequent strokes. The methodology presented in this paper is useful in determining engineering actions to reduce the risks relative to the non-uniform potential distribution along grounding grids when subjected to lightning currents. Considering the grid analyzed in this paper, one practical measure consists of connecting the two distinct earth grounding points with an aerial conductor to a metal bar, preferably located at the midpoint between the two points. Then, this bar is connected to the earth grounding grid by means of a proper conductor. Depending on the configuration of the power plant this solution is not always feasible due to physical limitations, or even due to cost constraints. In such cases, it is essential to know the distribution of potentials along the earth grounding grid, especially when it is subjected to lightning currents, in order to define alternative solutions. In particular, the proper installation of surge protective devices at the terminal of sensitive equipment can be done based on the accurate knowledge of the transient potential distribution along the grounding grid.
This work was supported in part by The State of Minas Gerais Research Foundation (FAPEMIG), under grant TEC – APQ-02017-16.
REFERENCES
[1] L. Grcev, Transient Electromagnetic Fields Near Large Earthing Systems, IEEE Trans. Magnetics, 32 (1996), No. 3, 1525–1528.
[2] IEEE Guide for Safety in AC Substation Grounding, IEEE Std.80 (2013).
[3] R. Alipio, M. A. O. Schroeder, and M. M. Afonso, Voltage distribution along earth grounding grids subjected to lightning currents, IEEE Trans. Industry Applications, 51 (2015), No. 6, 4912–4916.
[4] S. Visacro, A comprehensive approach to the grounding response to lightning currents, IEEE Trans. Power Delivery, 22 (2007), No. 1, 381–386.
[5] S. Visacro and A. Soares Jr., HEM: a model for simulation of lightning-related engineering problems, IEEE Trans. Power Delivery, 20 (2005), No. 2, 1026–1208.
[6] R. Alipio and Fellipe M. S. Borges, Multiport wideband modeling of large substation grounding grids for transient analysis, in Proc. 10th Asia-Pacific International Conference on Lightning (2017), 313–317.
[7] R. Alipio and S. Visacro, Impulse efficiency of grounding electrodes: effect of frequency dependent soil parameters, IEEE Trans. Power Delivery, 29 (2014), No. 2, 716–723.
[8] S. Visacro, R. Alipio, C. Pereira, M. Guimarães, and M. A. O. Schroeder, Lightning response of grounding grids: simulated and experimental results, IEEE Trans. Electromagnetic Compatibility, 57 (2015), No. 1, 121–127.
[9] B. Gustavsen and A. Semlyen, Rational approximation of frequency domain responses by vector fitting, IEEE Trans. Power Delivery, 14 (1999), 1052–1061.
[10] B. Gustavsen, Fast passivity enforcement for pole-residue models by perturbation of residue matrix eigenvalues, IEEE Trans. Power Delivery, 23 (2008), No. 4, 2278–2285.
[11] K. Berger, R. B. Anderson, and H. Kroninger, “Parameters of
lightning flashes,” Electra, no. 41, pp. 23–37, 1975.
[12] F. Rachidi, W. Janischewskyj, A. M. Hussein, C. A. Nucci, S. Guerrieri, B. Kordi, and J.-S. Chang, “Current and electromagnetic field associated with lightning-return strokes to tall towers,” IEEE Trans. Electromagn. Compat., vol. 43, no.3, pp. 356–367, Aug. 2001.
[13] F. Heidler, “Analytische blitzstromfunktion zur LEMPberechnung,” in Proc. 18th Int. Conf. Lightning Protection, Munich, Germany, 1985, pp. 63–66.
[14] L. Grcev, “Impulse efficiency of ground electrodes,” IEEE Trans. Power Del., vol. 24, no. 1, pp. 441–451, Jan. 2009.
[15] B. Gustavsen, Matrix Fitting Toolbox [Online]. Available: https://www.sintef.no/projectweb/vectfit/, 2009.
[16] L. Prikler, H.K. Hoidalen, ATPDraw Manual, Version 5.6, 2009.
[17] CIGRE Lightning Parameters for Engineering Applications, Working Group C4.407, Aug. 2013.
Authors: prof. Rafael Alipio, Department of Electrical Engineering, Federal Center of Technological Education of Minas Gerais, Av Amazonas, 7675, postal code: 30510000, Belo Horizonte, Brazil , E-mail: Rafael.Alipio@des.cefetmg.br; Renan Segantini, E-mail: renan_nikel@hotmail.com.
Source & Publisher Item Identifier: PRZEGLĄD ELEKTROTECHNICZNY, ISSN 0033-2097, R. 94 NR 2/2018. doi:10.15199/48.2018.02.02
