Published by Ana Maria Blanco1, Britta Heimbach2, Bruno Wartmann2, Jan Meyer1, Marco Mangani2, Martin Oeschger2
1Institute of Electrical Power Systems and High Voltage Engineering, Technische Universität
Dresden, Dresden, Germany
2Elektrizitätswerk der Stadt Zürich – EWZ, Zurich, Switzerland
1E-mail: ana.blanco@tu-dresden.de
24th International Conference & Exhibition on Electricity Distribution (CIRED), 12-15 June 2017.
Session 2: Power quality and electromagnetic compatibility
Abstract: Modern wind parks usually consist of multiple individual turbines, which are connected to the grid using power electronic interfaces. Depending on their topology, they could be a source of distortion in the frequency range below 2 kHz (harmonics, interharmonics) and above 2 kHz (supraharmonics). Consequently, the assessment of the impact of wind parks on the voltage distortion in the network is an important issue. This study explains some of these issues based on extensive field measurements at a recently commissioned 12 MW wind park consisting of six turbines with full inverter (type 4) and a rated power of 2MW each. While the first part discusses the distortion characteristic of an individual turbine, the second part is dedicated to the wind park as a whole and its impact on the voltage distortion at the connection point. Based on the experiences from the project some recommendations for field measurements at wind parks are summarised.
1. Introduction
The number of wind parks is growing continuously. New park installations usually utilise turbines either of type 3 (Doubly-fed induction generator (DFIG)) or type 4 (full converter). As both of them include power electronic converters, their possible network impact with respect to harmonics is an important concern for manufacturers, planners, operators and utilities. According to current practice in most cases, emission limits in terms of harmonic current magnitudes are provided by the utility, and the planner has to confirm compliance, which is mostly done by simplified calculations. Dependencies of harmonic currents on output power, network impedance or supply voltage distortion as well as the real impact on the voltage harmonic levels in the network are in many cases not adequately considered yet. Experiences have shown that simulation based on estimations can suffer from high uncertainties and the impact assessment based only on currents might be insufficient, as it does not consider possible cancellation effects with the existing supply voltage distortion (background distortion) properly.
Several studies exist, which analyse the harmonic and interharmonic currents of wind parks and the aggregation characteristic of multiple turbines based on field measurements [1–3]. This paper aims to contribute to these research activities and discusses some aspects of the current distortion within a typical wind park installation as well as its impact on the voltage distortion at the connection point with the grid.
After a short description of the wind park layout, the measurement campaign is explained. This includes also a brief discussion of issues related to the measurement uncertainties of the used sensors and instrument transformers. The next part presents selected results for individual turbines (units), while the last part is dedicated to the harmonics at installation level. Based on the experiences from the measurement campaign the paper concludes with some general recommendations.
2. Measurement campaign
The wind park consists of six similar type four turbines and has a total rated power of 12 MW. The park is connected to a 110 kV/ 20 kV substation via a 23.5 km MV cable. Two types of measurements have been performed:
• A long-term measurement of almost 2 months in order to monitor the typical behaviour of harmonics under typical operating conditions.
• A short-term measurement where turbines have been actively controlled according to a defined schedule in order to identify the impact of specific operating conditions on harmonic distortion.
Measurements have been performed at each turbine using six GPS synchronised IEC 61000-4-30 class A power quality analyser with a frequency range up to 10 kHz and the additional capability to measure absolute harmonic phase angles. In addition, a transient recorder with a sampling rate of 1 MS/s has been used for acquiring highly synchronised data of the feeders and the complete wind park during the short-term measurements. The location of the instruments is shown in Fig. 1.
For each instrument/sensor combination individual accuracy thresholds have been identified based on a procedure introduced in [4]. Above the threshold, the measurement uncertainty at all considered frequencies is better than 10%/5°. The obtained thresholds are summarised in Table 1.
All measurement data below the threshold have been excluded from the analysis. It should be noted that especially the accuracy of harmonic phase angles has a high impact on the analysis of harmonics summation and cancellation effects [5].

Table 1 Accuracy thresholds of the measurement instruments

3 Analysis at turbine level
3.1 Magnitude/level of distortion current
Fig. 2 presents exemplarily the harmonic, interharmonic and supraharmonic currents for the wind turbine Wind turbine generator (WTG1) (dots). According to IEC 61000-4-7 harmonics and interharmonics have been measured as subgroups and supraharmonics as 200 Hz bands. The aggregation interval has been set to 10 min and root mean square (RMS) method has been applied for aggregating the 10 cycle values as defined in IEC 61000-4-30. Each dot represents the maximum value observed during the long-term measurement interval taking only values when the turbine operated between 90 and 100% of its rated output power. The grey bars represent the equivalent values reported by the respective manufacturer certificate according to IEC 61400-21.
The most significant harmonic currents are the 5th, 7th, 11th and 13th (Fig. 2, left). Related to the rated current of the turbine these values are well below 1%, most of them even below 0.5%. The dominating share of harmonics matches the certificate values reported by the manufacturer. However, for several harmonic orders significant differences in both directions (higher/lower than certificate values) can be observed. The main reason for these differences is that the total measured current is a combination of two parts: one part caused by the turbine itself and one part caused by the network due to the supply voltage distortion. According to [6] the first part can be referred to as primary emission, the second part as secondary emission. Deviations in supply voltage distortion as well as deviations in the network harmonic impedance between the test facility for certification measurements and the connection point cause the observed differences. Consequently, the simple comparison of measured harmonic currents with specified limits is often not sufficient and it might result in misleading conclusions. It can be further noted that for some orders the harmonic current is unbalanced, which is most likely caused by a slight unbalance in background distortion.
The highest levels for interharmonic currents (Fig. 2, middle) are obtained at order 2 and around order 15. Related to the rated current of the turbine these currents are below 0.25%. Most of the levels match the certificate values of the manufacturer well, because no significant interharmonic background distortion exists.
The supraharmonic currents in the frequency range 2–9 kHz are well below 0.1% in relation to the rated current of the turbine. Most of the measured levels show a significant difference to the certificate values, being usually lower. This behaviour confirms the often reported fact that the distortion above 2 kHz depends much more on the connection point characteristic than the distortion below 2 kHz [8]. Especially the impedance at higher frequencies is more volatile as it is mainly determined by the equipment connected nearby.
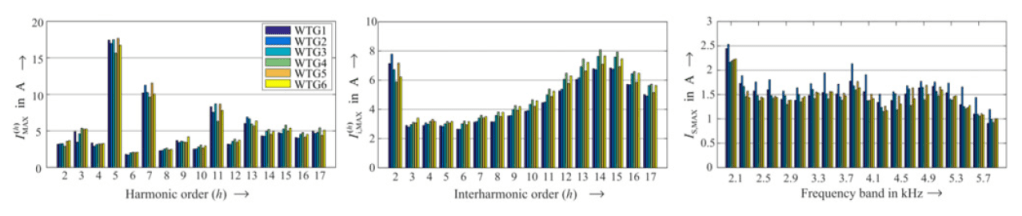
Fig. 3 compares the harmonic, interharmonic and supraharmonic currents of one phase between all six turbines. In spite of slight differences, the turbines in general behave very similar. This applies also for the other phases. The differences are caused by slight differences in the voltage distortion, output power and/or control settings of each turbine as well as differences in the circuit elements (inverter, filter, transformer etc.).

3.2 Prevailing harmonic phase angles
In order to determine the similarity between the individual turbines, not only the magnitude, but also the phase angles of distorting currents have to be considered. In general, two different options exist for the calculation of the phase angle: phase angle between voltage and current at the same frequency (relative harmonic phase angle; e.g. for harmonic power flow studies) and phase angle between harmonic current and fundamental voltage (absolute harmonic phase angle). The absolute harmonic phase angle is often referred to as prevailing phase angle. It is used to study cancellation effects between the harmonic currents of individual devices (also referred to as primary cancellation) as well as between the harmonic current of an installation and the existing background voltage harmonics (also referred to as secondary cancellation). Further details about primary and secondary cancellation can be found in [7]. This paper discusses harmonic cancellation effects and consequently applies the absolute harmonic phase angle.
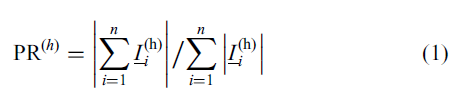
The level of similarity (or steadiness), also referred to as the level of prevalence of the harmonic phase angle for multiple measurement data i (e.g. in a certain time interval) is determined based on the complex harmonic currents Ii(h) by the harmonic prevailing ratio PR(h):
As an example Fig. 4 (left) presents all data points of the long-term measurement for the seventh current harmonic and all three phases of turbine WTG1 in the complex plane. The dispersion is caused by the supply voltage distortion as well as the varying operating points of the wind park. A prevailing location can be identified in the heat map plot (Fig. 4, right) as red area, which corresponds to the area of highest density of measurement data.

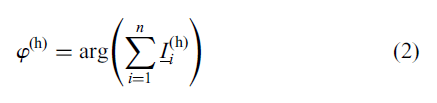
The prevailing phase angle of a set of data points is calculated by
If the data is too dispersed (usually for PR(h) < 0.8), the prevailing phase angle has no meaning and should not be reported. Further explanations on calculation and assessment of harmonic cancellation effects and prevailing ratio can also be found in [7]. Table 2 exemplarily presents the prevailing phase angles for the first two turbines WTG1 and WTG2 (cf. Fig. 1) and the first nine harmonics for the long-term measurements. The colours indicate the level of prevalence. The other turbines behave similar. Considering the whole long-term measurement, in most cases the dispersion of harmonic phase angles is high. Only 2nd, 4th and 7th harmonic orders present a consistent and distinctive prevalence. This confirms the high sensitivity of harmonic currents on the operating conditions of the wind park and that simple constant current source models are not sufficient for developing accurate models for harmonic studies.
Table 2 Prevailing phase angle in degree for turbines WTG1 and WTG2

3.3 Impact of supply voltage distortion
Output power and supply voltage distortion are the most significant factors influencing the resulting distortion current of a wind park installation. It is expected that output power mainly determines the primary emission, while supply voltage distortion causes mainly secondary emission depending on the frequency dependent input impedance of the turbines. In field measurements both factors usually fluctuate at the same time and methods to distinguish the influences of both factors are required. This section introduces a method to separate the impact of supply voltage distortion (background distortion) on distortion currents in field measurements and to identify if a linear relation exists between them.
All data of the long-term measurement are divided into a matrix of 25 × 25 ‘cells’ with approximately the same output power (Fig. 5, left). Active and a reactive output power ranges of each cell are determined by dividing the maximum active and reactive power observed during the measurement interval by 25. Next, the correlation coefficient c according to Pearson is calculated individually for each harmonic order and each cell. A correlation coefficient in the range between 0.8 and 1.0 indicates a strong linear relationship. Fig. 5(right) exemplarily shows the correlation between the 5th voltage and current harmonic magnitudes for one cell with very strong linear correlation.

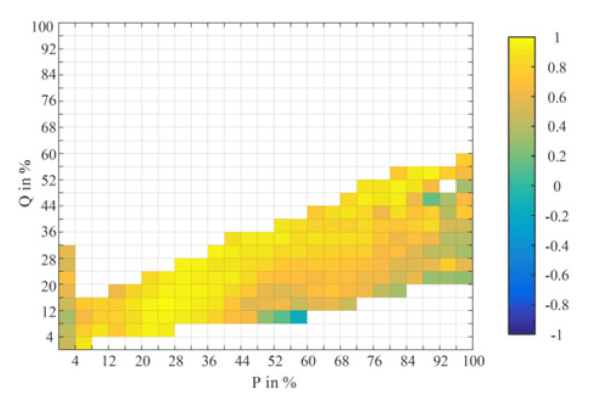
A colour map plot of the correlation coefficients allows an easy visual assessment of existing linearity. As an example, Fig. 6 shows the colour map obtained for the correlations between the voltage and current harmonics for the 7th harmonic of phase A at turbine WTG3. White cells indicate that no or not enough measurement data are available for analysis. Comparing the results of all turbines and all phases it was found that strong linear correlations exist for a dominating share of ‘cells’ for the 5th, 7th, 11th, 13th, 14th, 15th and 16th harmonic orders, which are the most dominant harmonics (Fig. 2, left). Particularly at higher reactive power output correlation seems to be usually weaker. It should be noted that a low correlation coefficient only means that no linear correlation exists, but not that no correlation exists at all.
4. Analysis at wind park level
Selected aspects of the total harmonic and interharmonic currents of the wind park and its impact on the voltage distortion at the connection point are exemplarily discussed using a part of the short-term measurements, where the active output power of the wind park has been increased stepwise from 1 to 9 MW, while reactive power has been kept constant at Q=0.
Most relevant harmonic currents (Fig. 7/top) do not show a consistent behaviour during the test. While some of them increase with increasing active output power (e.g. 3rd and 7th), others remain nearly constant (e.g. 8th and 10th). Some harmonic currents seem to decrease again slightly at higher active output powers (e.g. 2nd and 11th). Harmonic voltages (Fig. 7/bottom) are very low and in general do not increase during this test. Slight variations (e.g. for 5th harmonic) are most likely caused by fluctuations of the existing background distortion during the test (about 40 min), because such fluctuations do also affect the harmonic currents (secondary emission). Only the 7th harmonic voltage shows a clear, decreasing trend. As the 7th harmonic current increases at the same time (indirect relation), a certain level of cancellation exists between the background harmonic voltage and the voltage drop at the network impedance caused by the 7th harmonic current of the wind park. This type of cancellation is also referred to as secondary cancellation (to subsection prevailing harmonic phase angles). The polar plots in Fig. 8 confirm this explanation, as the 7th voltage harmonic considerably changes its phase angle with increasing harmonic current. Further details and a method for a simplified assessment of the level of secondary cancellation can be found in [7].
Interharmonic currents (Fig. 9) consistently increase with increasing active output power. This characteristic also applies to the higher interharmonics, which are not shown in the figure. Interharmonic voltages are very low and increase with increasing interharmonic currents. The level of increase is partly linked to the network impedance. As virtually no interharmonic background voltages exist, secondary cancellation effects like for the 7th harmonic do consequently not occur.


5. Summary
The paper discusses some aspects of the distortion characteristic of a 12 MW wind park consisting of six similar turbines based on field measurements. Distortion covers harmonics and interharmonics below 2 kHz as well as distortion above 2 kHz (supraharmonics). A statistical analysis of the typical distortion characteristic is based on long-term measurements at reference/default settings of the wind park and the turbines. The impact of different operating points or changes of parameter settings on the distortion characteristic is analysed based on short-term measurements performing different sets of ‘controlled’ tests (e.g. change of output power). Furthermore, the analysis distinguishes between the characteristics of individual turbines and the park installation as a whole.
The individual turbines behave similar, but differ partly to the distortion current values provided by the manufacturer certificate. This confirms that location-specific conditions, particularly frequency-dependent network impedance and supply voltage distortion have a significant impact on the distortion currents. The analysis at wind park level shows that, especially in case of harmonics, currents can also have a positive impact on the voltage distortion in the network. Particularly where harmonic currents exceed specified limits, it is recommended to assess this impact before considering additional mitigation equipment. This issue is also discussed in the joint CIGRE/CIRED working group C4.42. Last but not the least, it should be mentioned that during the long-term measurements the voltage quality at the connection point did fully comply with EN 50160.
Within the project, a huge amount of data has been collected. A fundamental basis for any further analysis is a careful determination of measurement accuracy, which includes all external sensors. A set of existing as well as newly developed methods have been applied to analyse different aspects of the distortion characteristic of the individual turbines and the wind park. However, a modular framework for measurement and analysis of the distortion characteristics of a customer installation is still missing and should be developed in the future.
6. References
1. Yang, K., Bollen, M., Wahlberg, M.: ‘A comparison study of harmonic emission measurements in four windparks’. IEEE Power and Energy Society General Meeting, IEEE, 2011
2. Yang, K., Bollen, M., Larsssson, A.: ‘Aggregation and amplification of wind-turbine harmonic emission in a windpark’, IEEE Trans. Power Deliv., 2015, 30, (2), pp. 791–799
3. Van Reusel, K., Bronckers, S.: ‘Summation rule for wind turbines’ harmonics challenged by measurements’. 17th Int. Conf. on Harmonics and Quality of Power, 2016
4. Meyer, J., Kilter, J.: ‘Case studies for power quality monitoring in public distribution grids – some results of working group CIGRE/CIRED C4.112’. Electric Power Quality and Supply Reliability Conf., 2014
5. Blanco, A.M., Meyer, J., Schegner, P.: ‘Calculation of phase angle diversity for time-varying harmonic currents from grid measurement’. Int. Conf. on Renewable Energies and Power Quality, 2014
6. Bollen, M.H.J., Rönnberg, S.K.: ‘Primary and secondary harmonics emission; harmonic interaction – a set of definitions’. 17th Int. Conf. on Harmonics and Quality of Power, 2016
7. Meyer, J., Bollen, M., Amaris, H., et al.: ‘Future work on harmonics – some expert opinions Part II – supraharmonics, standards and measurements’. 16th Int. Conf. on
Harmonics and Quality of Power, 2014
8. Meyer, J., Blanco, A.M., Domagk, M., et al.: ‘Assessment of prevailing harmonic current emission in public low voltage networks’, IEEE Trans. Power Deliv., 2017, 32, (2), pp. 962–970
Source & Publisher Item Identifier: CIRED, Open Access Proc. J., 2017, Vol. 2017, Iss. 1, pp. 677–681, ISSN 2515-0855, doi: 10.1049/oap-cired.2017.0457
